Distribution of eosinophils in the gastrointestinal tract of children with no organic disease
←
→
Page content transcription
If your browser does not render page correctly, please read the page content below
ORIGINAL ARTICLE                                                                                      Annals of Gastroenterology (2020) 33, 1-8

Distribution of eosinophils in the gastrointestinal tract of children
with no organic disease

Eleni Koutria, Amalia Paterelib, Maria Nonia, Carolina Gutiérrez-Junquerac, Carmen González-Loisd,
Salvatore Olivae, Carla Giordanof, Kaliopi Stefanakib, Alexandra Papadopouloua
University of Athens, Agia Sofia Children’s Hospital, Athens, Greece; University Hospital Puerta de
Hierro-Majadahonda, Autonomous University of Madrid, Spain; Sapienza University of Rome, Rome, Italy

Abstract                               Background This study aimed to assess the eosinophil (eos) density of the mucosa of the
                                       gastrointestinal (GI) tract in children undergoing endoscopic procedures following an extensive
                                       workup, without diagnosis of an organic disease.
                                       Methods Biopsies from GI endoscopies performed at 3 major children’s hospitals (Athens,
                                       Madrid and Rome), between January 2012 and June 2018, were evaluated by a single pathologist
                                       in each center. Peak eos counts were expressed /high power field and /mm2. Other histological
                                       abnormalities were also reported.
                                       Results A total of 111 children (median age 11 years; 48 boys) underwent upper endoscopy (333
                                       biopsies), while 44 (median age 12; 25 boys) underwent ileocolonoscopy (262 biopsies). The median
                                       (interquartile range) eos/mm2 were as follows: esophagus 0 (0-0); stomach 0 (0-3); duodenum 22
                                       (13-29); ileum 29 (19-46); cecum 39 (25-71); ascending colon 24 (20-41); transverse colon 27 (21-
                                       57); descending colon 21 (13-27); sigmoid colon 22 (13-30); and rectum 10 (6-22). Geographical
                                       variations in GI tissue eos counts were found amongst the participating centers, but the causative
                                       factors need further evaluation. Functional GI disorders according to the Rome IV criteria were
                                       diagnosed in 73 children (37 boys, median age 13 years). No differences were found between
                                       children with or without functional GI disorder diagnosis, with regard to eos density in the GI tract.
                                       Conclusion The reported peak counts of GI tissue eos in children with no organic diseases provide
                                       normative values that may be useful in the evaluation of children with GI symptoms suggestive of
                                       eosinophilic GI disorders.
                                       Keywords Eosinophilic gastrointestinal disorders, eosinophils, gastrointestinal tract, children
                                       Ann Gastroenterol 2020; 33 (4): 1-8

a
  Division of Gastroenterology and Hepatology, First Department               Introduction
of Pediatrics, University of Athens, Agia Sofia Children’s Hospital,
Athens, Greece (Eleni Koutri, Maria Noni, Alexandra Papadopoulou);
b
  Department of Pathology, Agia Sofia Children’s Hospital, Athens,                Eosinophilic gastrointestinal (GI) disorders (EGID)
Greece (Amalia Patereli, Kaliopi Stefanaki); cPediatric Gastroenterology      comprise a rare group of chronic inflammatory disorders of
Unit, University Hospital Puerta de Hierro-Majadahonda, Autonomous            the GI tract attracting growing interest. Clinically, they are
University of Madrid, Spain (Carolina Gutiérrez-Junquera); dPathology
                                                                              characterized by various symptoms, depending on the involved
Department, University Hospital Puerta de Hierro Majadahonda,
Autonomous University of Madrid, Spain (Carmen González-Lois);                segment of the GI tract, and histologically, by dense eosinophilic
e
 Pediatric Gastroenterology and Liver Unit, Maternal and Child Health         infiltration in the absence of an identifiable secondary cause [1].
Department, Sapienza University of Rome, Rome, Italy (Salvatore               However, the eosinophilic density of GI tract mucosa of healthy
Oliva); fDepartment of Radiological, Oncological and Pathological             children, which would provide baseline data for the diagnosis
Sciences, Sapienza University of Rome, Rome, Italy (Carla Giordano)           of EGIDs, has been poorly defined [2-5]. Inflammatory bowel
Conflict of Interest: None                                                    disease has been reported to be associated with increased
                                                                              eosinophilic infiltration of the childhood GI tract [6], while the
Correspondence to: Alexandra Papadopoulou, Chief of the Division of           association of functional GI disorders (FGIDs) with increased
Gastroenterology and Hepatology, First Department of Pediatrics, University
of Athens, Agia Sofia Children’s hospital, Thivon and Papadiamantopoulou,     eosinophil (eos) density of the child’s GI tract is controversial:
11527, Athens, Greece, e-mail: a.papadopoulou@paidon-agiasofia.gr             some studies report increased eosinophilic infiltration of the
                                                                              GI tissue mucosa in children with FGIDs [7], whereas others
Received 4 February 2020; accepted 24 May 2020;                               do not [8]. Furthermore, the geographical variations in the
published online 22 June 2020
                                                                              distribution or density of GI tissue eos in children with no
DOI: https://doi.org/10.20524/aog.2020.0518                                   organic diseases have been poorly defined.
© 2020 Hellenic Society of Gastroenterology                                                                                 www.annalsgastro.gr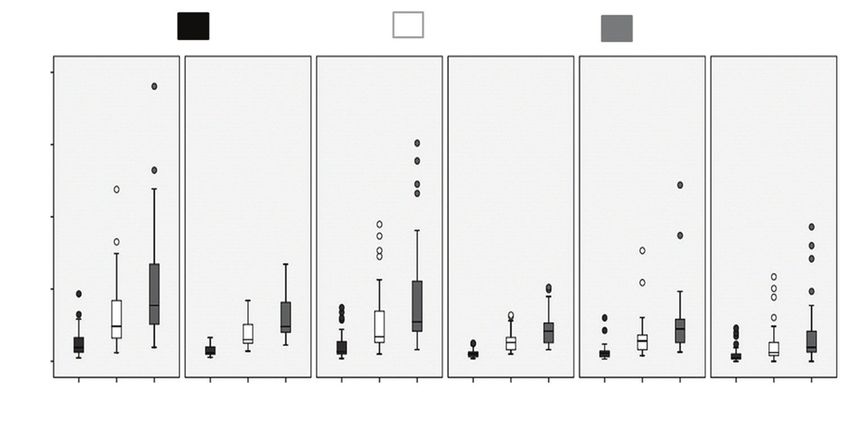
2 E. Koutri et al

   The aim of our study was to assess the eos distribution and            Statistical analysis
density in the GI tract in a pediatric population undergoing
endoscopy after an extensive workup, with no subsequent                       Descriptive analysis was performed for all variables. Categorical
diagnosis of an organic disease.                                          data were expressed as absolute number and proportions (%),
                                                                          while continuous variables were reported as the median and
                                                                          interquartile range (IQR), since the distribution was not normal.
                                                                          Continuous data were tested for normality using statistical tests
Patients and methods                                                      (Kolmogorov-Smirnoff test) and graphical methods (histogram,
                                                                          Q-Q plot). Because all data were nonparametric, Mann-Whitney
    Children who underwent GI endoscopies at 3 referral pediatric         and Kruskal-Wallis tests were used in the comparative analyses.
gastroenterology units (Athens, Madrid and Rome) between                  Boxplots were also used for the graphical presentation of
January 2012 and June 2018 were included in this study if they            continuous data in figures. Results were presented in eos/mm2,
had a normal workup prior to endoscopy, normal macroscopic                as in recent studies in the literature. However, the median density
appearance during endoscopy, and no evidence of organic disease,          of eos/hpf was also calculated for a better comparison with other
either at the time of endoscopy or at least 1 year after. The workup      studies. All statistical analyses were performed using the statistical
to exclude organic diseases included, but was not limited to,             package PSAW Statistics v23 (SPSS, Inc., Chicago, IL, USA).
the following: full blood count, C-reactive protein, erythrocyte          Statistical significance at P
Eosinophils in children’s GI tract 3
Interestingly, significant differences among the 3 centers With regard to the evaluation of any associations of FGIDs
were observed in the eosinophilic counts of all segments of with GI tissue eosinophilia, for the sake of homogeneity, we
the GI tract (Table 1), with the Rome center showing greater applied the same criteria (Rome IV criteria) [10] that have
eos counts in all of the segments except the esophagus and been valid since May 2016 for the diagnosis of FGID to all the
the rectum. Seasonal variation as a potential reason for the patients. As recent studies [11] reported that using Rome III led
differences found was excluded, as the timing of the performed to underestimation [12] of the diagnosis of FGIDs associated
endoscopies varied within the year in all centers. The role, with abdominal pain, compared to the Rome IV [10] criteria,
however, of other potential reasons, such as diet, drugs or we decided to apply the same criteria (Rome IV criteria) to all
history of atopy were not recorded in this retrospective study; of our patients, to avoid any bias by missing FGID diagnoses.
thus, the potential impact of the above factors on geographical Interestingly, we found that the Rome IV criteria were fulfilled
variation needs further investigation. for the diagnosis of FGID by 73 children (37 boys), median (IQR)
hpf 0.245 mm2 hpf 0.625 mm2 mm2
30
Peak numbers of eosinophils
25
20
15
10
5
0
Esophagus Stomach
Figure 1 Peak numbers of eosinophils in the esophageal and gastric biopsies in the whole cohort of children. Median (interquartile range) of peak
counts of eosinophils /high power field 0.245 mm2 and 0.625 mm2, and /mm2 in the esophagus (111 biopsies) and the stomach (111 biopsies) were
as follows: esophagus: 0 (0-0), 0 (0-0) and 0 (0-0), respectively; stomach: 0 (0-0.78), 0 (0-2.0) and 0 (0-3.2), respectively
hpf 0.245 mm2 hpf 0.625 mm2 mm2
250
Peak numbers of eosinophils
200
150
100
50
0
Duodenum Ileum
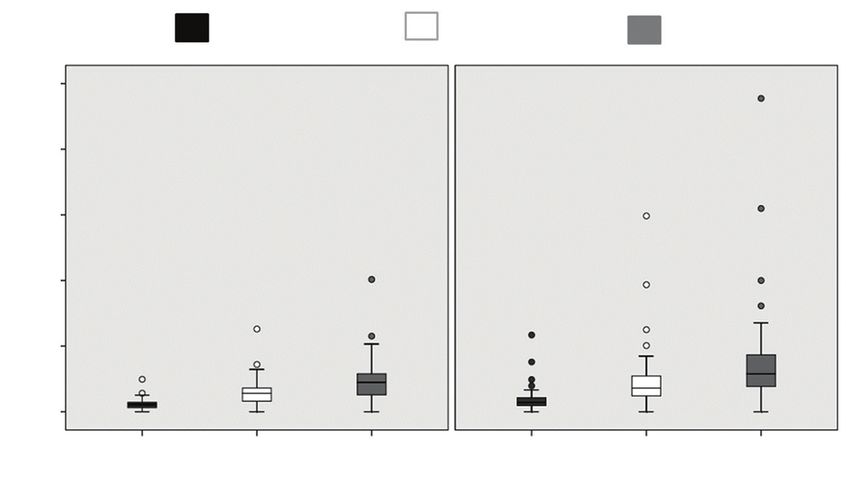
Figure 2 Peak numbers of eosinophils in the duodenal and ileal biopsies in the whole cohort of children. Median (interquartile range) of peak
counts of eosinophils /high power field 0.245 mm2 and 0.625 mm2, and /mm2 in the duodenum (111 biopsies) and ileum (44 biopsies) were as
follows: duodenum: 5.5 (3.1-7.1), 14 (8-18.1) and 22.4 (12.8-29.0), respectively; ileum: 7 (4.7-11.2), 18 (12.1-28.7) and 28.8 (19.2-45.9), respectively
Annals of Gastroenterology 334 E. Koutri et al
hpf 0.245 mm2 hpf 0.625 mm2 mm2
200
Peak numbers of eosinophils
150
100
50
0
Cecum Ascending Transverse Decending Sigmoid Rectum
colon colon colon colon
Figure 3 Peak numbers of eosinophils in the colonic biopsies in the whole cohort of children. Median (interquartile range) of peak counts of
eosinophils /high power field 0.245 mm2 and 0.625 mm2, and /mm2 in the cecum (37 biopsies), ascending colon (28 biopsies), transverse colon (44
biopsies), descending colon (31 biopsies), sigmoid colon (37 biopsies) and rectum (41 biopsies) were as follows: cecum: 9.5 (6.1-17.3), 24.2 (15.5-
44.2) and 38.7 (24.8-70.7), respectively; ascending colon: 5.9 (4.8-10.1), 15 (12.2-25.7) and 24 (19.6-41.2), respectively; transverse colon: 6.7 (5.1-
13.9), 17 (13-35.5) and 27.2 (20.8-56.7), respectively; descending colon: 5.1 (3.1-6.7), 13 (8-17) and 20.8 (12.8-27.2), respectively; sigmoid colon:
5.5 (3.1-7.3), 14 (8-18.6) and 22.4 (12.8-29.7), respectively; rectum: 2.4 (1.6-5.3), 6 (4-13.5) and 9.7 (6.4-21.6), respectively
age 13 (9-14) years, while the Rome III criteria [12] were satisfied the same was true for dilated intercellular spaces (6.4% vs. 1.6%,
by only 39 children (20 boys), median (range) age 13 (3-17) years. respectively; P=0.178). Eosinophilic surface layering was absent
FGID+ patients were found to be older than FGID-: their in all esophageal biopsies, while mild lamina propria fibrosis was
median (ΙQR) age was 13 (9-14) vs. 10 (6.5-12) years, respectively rare, as it was found in only 3 (2 FGID+ and 1 FGID-) of the 42
(PEosinophils in children’s GI tract 5
Table 1 Peak eosinophil counts in the epithelium of different segments of the gastrointestinal (GI) tract amongst participating centers
GI segment Greece Spain Italy P-value
Total n=595 biopsies N=351 biopsies N=710 slides N=99 biopsies; N=152 slides N=145 biopsies; N=150 slides
Total n=1012 slides Median (ΙQR) Median (ΙQR) Median (ΙQR)
Esophagus N=72 biopsies N=15 biopsies N=24 biopsies
N=154 slides N=48 slides N=24 slides
Eos/hpf 0.245 mm2 0.0 (0.0-0.0) 0.0 (0.0-0.39) 0.0 (0.0-0.0) 0.112
Eos/hpf 0.625 mm2 0.0 (0.0-0.0) 0.0 (0.0-1.0) 0.0 (0.0-0.0) 0.112
Eos/mm2 0.0 (0.0-0.0) 0.0 (0.0-1.6) 0.0 (0.0-0.0) 0.112
Stomach N=76 biopsies (Body); N=15 biopsies (Antrum) N=20 biopsies(Fundus)
N=154 slides N=24 slides N=20 slides
Eos/hpf 0.245 mm2 0.0 (0.0-0.0) 0.39 (0.0-0.78) 0.79 (0.0-1.38) 0.001
Eos/hpf 0.625 mm2 0.0 (0.0-0.0) 1.0 (0.0-2.0) 2.0 (0.0-3.5) 0.001
Eos/mm2 0.0 (0.0-0.0) 1.6 (0.0-3.2) 3.2 (0.0-5.6) 0.001
Duodenum N=76 biopsies N=15 biopsies N=20 biopsies
N=154 slides N=25 slides N=20 slides
Eos/hpf 0.245 mm2 15.0 (11.0-18.75) 1.96 (1.17-3.13) 6.3 (4.14-7.7)6 E. Koutri et al
Table 2 Eosinophilic counts in children with or without FGIDs
Segment of GI tract FGID+ FGID- P-value
N=595 biopsies N=293 biopsies N=302 biopsies
Median (ΙQR) Median (ΙQR)
Esophagus N=47 biopsies N=64 biopsies
Eos/hpf 0.245 mm2 0.0 (0.0-0.0) 0.0 (0.0-0.0) 0.778
Eos/hpf 0.625 mm2 0.0 (0.0-0.0) 0.0 (0.0-0.0) 0.778
Eos/mm2 0.0 (0.0-0.0) 0.0 (0.0-0.0) 0.778
Stomach N=47 biopsies N=64 biopsies
Eos/hpf 0.245 mm2 0.0 (0.0-0.78) 0.0 (0.0-0.6) 0.169
Eos/hpf 0.625 mm2 0.0 (0.0-2.0) 0.0 (0.0-1.7) 0.164
Eos/mm2 0.0 (0.0-3.2) 0.0 (0.0-2.8) 0.167
Duodenum N=48 biopsies N=63 biopsies
Eos/hpf 0.245 mm2 6.6 (3.1-8.1) 5.0 (3.5-6.2) 0.089
Eos/hpf 0.625 mm2 17.0 (8.0-20.7) 13.0 (9.0-16.0) 0.089
Eos/mm2 27.2 (12.8-33.2) 20.8 (14.4-25.6) 0.089
Ileum N=26 biopsies N=18 biopsies
Eos/hpf 0.245 mm2 7.1 (5.5-8.8) 5.7 (4.7-12.4) 0.430
Eos/hpf 0.625 mm2 18.1 (14.2-22.5) 14.5 (12.0-31.7) 0.430
Eos/mm2 29.0 (22.8-36.0) 23.2 (19.2-50.8) 0.481
Cecum N=21 biopsies N=16 biopsies
Eos/hpf 0.245 mm2 10.9 (4.5-15.0) 8.2 (6.2-19.5) 0.617
Eos/hpf 0.625 mm2 28.0 (11.5-38.3) 21.1 (16.0-49.8) 0.617
Eos/mm2 44.8 (18.4-61.2) 33.8 (25.6-79.8) 0.596
Ascending colon N=18 biopsies N=10 biopsies
Eos/hpf 0.245 mm2 7.2 (4.7-10.4) 5.2 (4.9-6.8) 0.226
Eos/hpf 0.625 mm2 18.5 (12.0-26.7) 13.5 (12.7-17.5) 0.226
Eos/mm2 29.6 (19.2-42.8) 21.6 (20.4-28.0) 0.226
Transverse colon N=27 biopsies N=17 biopsies
Eos/hpf 0.245 mm2 7.1 (5.4-12.1) 5.5 (4.9-22.1) 0.875
Eos/hpf 0.625 mm2 18.1 (14.0-31.0) 14.1 (12.5-56.4) 0.875
Eos/mm2 29.0 (22.4-49.6) 22.5 (20.0-90.3) 0.875
Descending colon N=19 biopsies N=12 biopsies
Eos/hpf 0.245 mm2 5.0 (3.1-8.6) 5.0 (3.6-5.8) 0.921
Eos/hpf 0.625 mm2 13.0 (8.0-22.0) 13.0 (9.2-15.0) 0.921
Eos/mm2 20.8 (12.8-35.2) 20.8 (14.8-24.0) 0.921
Sigmoid N=20 biopsies N=17 biopsies
Eos/hpf 0.245 5.7 (3.3-7.3) 4.7 (2.9-8.2) 0.598
Eos/hpf 0.625 14.5 (8.5-18.7) 12.0 (7.5-21.1) 0.598
Eos/mm2 23.2 (13.6-30.0) 19.2 (12.0-33.8) 0.598
Rectum N=20 biopsies N=21 biopsies
Eos/hpf 0.245 3.3 (1.5-5.6) 2.3 (1.17-4.7) 0.267
Eos/hpf 0.625 8.5 (4.0-14.75) 6.0 (3.0-12.0) 0.240
Eos/mm2 13.6 (6.4-23.2) 9.6 (4.8-18.4) 0.210
FGID, functional gastrointestinal disorders; Eos/hpf, eosinophils per high power field; IQR, interquartile range
reports on eos concentrations in normal colonic mucosa [15]. Furthermore, an important problem with existing reports in
The reasons for these geographical variations are not clear. Some the literature on GI tissue eosinophilic infiltration is that the eos
studies have suggested that environmental aero- or food allergens counts are expressed in cell number/hpf, although the size of
may have an impact on GI tissue eosinophilia [15,16], while others the hpf is not specified. It is known, however, that the area of the
do not agree [17]. As, however, data on diet, drugs or history of hpf is strongly correlated with the technical parameters of the
atopy were not collected, we cannot delineate the impact of any microscope, such as the magnification of the objective lens and
of the above factors on the observed differences. Additionally, it the diameter of the ocular. The diversity among the technical
cannot be excluded that the differences found between centers parameters of commercially available microscopes may cause
may be due to the different volumes of the samples collected in the up to fivefold discrepancies in the eos counts of the same biopsy
participating centers, with Madrid and Rome having collected half sample. To avoid heterogeneity, it has been suggested that eos
and one third respectively, compared to Athens. should be counted in at least 5 fields of view from the area with
Annals of Gastroenterology 33Eosinophils in children’s GI tract 7
peak eos density, and that eos density should be reported in spots”, e.g., places with the greatest eos concentration, without
cells/mm2 [18], a methodology adopted in this study. indicating their exact location (intracryptal or intravillous).
Interestingly, we found that the number of children In conclusion, this study provides normative values on
fulfilling the Rome IV criteria for FGID diagnosis was almost eosinophilic distribution and density in different segments of
twice that when the Rome III criteria were used. Other recent the GI tract of children with no organic diseases, which could
studies have also shown that Rome III criteria underestimated be used in the evaluation of children with suspected EGIDs
the number of children with FGIDs [10]. beyond the esophagus, the diagnosis of which in the absence of
The association of FGIDs with the eosinophilic infiltration baseline data, is often a challenging issue, as it is based on the
of GI tissue is controversial. Similarly to other studies in pathologist’s subjective judgment.
children [19], we were not able to demonstrate any differences
in the eosinophilic infiltration of the GI tract of children
diagnosed with FGIDs. In contrast, a recent meta-analysis Summary Box
of FD, including studies in adults and in children, reported
a significant increase in eosinophilic density in both the What is already known:
gastric and duodenal mucosa of patients compared to healthy
controls [20]. However, 3 of 4 studies performed in children • Eosinophilic gastrointestinal (GI) disorders
with FD showed no differences in the eos counts in the gastric (EGID) are rare, chronic inflammatory disorders
mucosa [7,21,22], while the same was shown by other studies of the GI tract, characterised by dense eosinophilic
in the childhood duodenal mucosa [8] between patients and inflammation of the GI tract, in the clinical context.
healthy controls. Furthermore, although the counts of eos in However, due to the absence of normative values
the GI mucosa of children with FGID+ did not differ, we did on eosinophiic infitration of the healthy GI tract
find a greater incidence of other histological abnormalities, mucosa, the EGID diagnosis is often challenging
such as increased intraepithelial eos and eosinophilic as it relies on the pathologist’s subjective judgment
cryptitis, that occur rarely in healthy GI tissue [3,19,23]. • The geographical variations in the eosinophil
Based on the above, we can hypothesize that there may be a distribution or eosinophilic density in the GI tract
subtle inflammation in these patients, possibly related to an of children with no organic diseases have been
imbalance in GI homeostasis that may result from any number poorly defined
or combination of factors, including dysbiosis, loss of barrier • Other diseases, such as inflammatory bowel
integrity, genetic predisposition, or immune responses to disease, have been associated with increased
dietary or luminal antigens [24]. The mild degranulation of eos- eosinophil counts in the GI mucosa, while
associated extracellular granules that we found toward the edge controversial data exist on the impact of functional
of the tissue sample biopsy in almost one third of the intestinal GI disorders (FGIDs) on the distribution and
biopsies can be attributed to tissue trauma resulting from the density of eosinophils in the childhood GI tract
use of forceps for obtaining the tissue, causing disruption of the
eos cellular integrity [25].
Our study had several limitations. One was its retrospective What the new findings are:
design, which did not allow strict conclusions to be drawn
regarding the geographical variations in the eosinophilic • The reported in this study peak eosinophil counts
infiltration of the GI tract. As data on diet, drugs and history in the epithelium of different segments of the GI
of allergy were not reported, the potential impact of any of tract of children with no organic diseases, provide
these factors on the eosinophilic density of GI tissue cannot be normative values, which could be used for the
excluded. It is also possible that the observed differences could evaluation of children with suspected EGID
be attributed to differences in the numbers of the biopsy samples • The shown in this study differences in the peak
collected by the participating centers, with Madrid and Rome counts of eosinophils in the same segments of
having collected half and one third, respectively, of the number the GI tract are attributed to the different sizes of
of biopsy samples collected in Athens. Furthermore, we did not high power fields used for calculation by different
assess inter-pathologist variation in assessing histology slides pathologists. The above discrepancies highlight the
amongst the participating centers. It should be noted, however, importance of using eosinophil density (eos/m2)
that the criteria and the procedure for the histology assessment instead of eos/hpf, that is a universally accepted
were discussed and agreed upon by all of the pathologists before tool, independent of the size of hpf
the start of the study, while three quarters of the total number of • A geographical variation in GI tissue eosinophilic
histology slides (710 of 1014) were also compared and reviewed density was found, but the causative factors need
by a senior pathologist (KS), minimizing potential errors. In further evaluation
addition, it is not possible to draw conclusions from this study • Eosinophil distribution and eosinophilic density in
as to whether the eosinophilic infiltration of the duodenum the GI tract do not differ in children with an FGID
was intracryptal or intravillous. As the aim of the study was diagnosis, according to the Rome IV criteria,
to provide data on the peak counts of eos in the “healthy” GI compared to those without such a diagnosis
mucosa, the pathologists focused on the eosinophilic “hot
Annals of Gastroenterology 338 E. Koutri et al
References Brazil. Sci Rep 2018;8:5000.
14. Kiss Z, Tél B, Farkas N, et al. Eosinophil counts in the small
intestine and colon of children without apparent gastrointestinal
1. Aceves S, Hirano I, Furuta GT, Collins MH. Eosinophilic
disease: a meta-analysis. J Pediatr Gastroenterol Nutr 2018;67:6-12.
gastrointestinal diseases—clinically diverse and histopathologically
15. Pascal RR, Gramlich TL, Parker KM, Gansler TS. Geographic
confounding. Semin Immunopathol 2012;34:715-731.
variations in eosinophil concentration in normal colonic mucosa.
2. Lowichik A, Weinberg AG. A quantitative evaluation of mucosal
Mod Pathol 1997;10:363-365.
eosinophils in the pediatric gastrointestinal tract. Mod Pathol
16. Mehta P, Furuta GT. Eosinophils in gastrointestinal disorders:
1996;9:110-114.
eosinophilic gastrointestinal diseases, celiac disease, inflammatory
3. DeBrosse CW, Case JW, Putnam PE, Collins MH, Rothenberg ME.
bowel diseases, and parasitic infections. Immunol Allergy Clin
Quantity and distribution of eosinophils in the gastrointestinal
North Am 2015;35:413-437.
tract of children. Pediatr Dev Pathol 2006;9:210-218.
4. Saad AG. Normal quantity and distribution of mast cells and 17. Matsushita T, Maruyama R, Ishikawa N, et al. The number and
eosinophils in the pediatric colon. Pediatr Dev Pathol 2011;14:294-300. distribution of eosinophils in the adult human gastrointestinal
5. Chernetsova E, Sullivan K, de Nanassy J, et al. Histologic analysis tract: a study and comparison of racial and environmental factors.
of eosinophils and mast cells of the gastrointestinal tract in healthy Am J Surg Pathol 2015;39:521-527.
Canadian children. Hum Pathol 2016;54:55-63. 18. Saffari H, Peterson KA, Fang JC, Teman C, Gleich GJ, Pease LF 3rd.
6. Lee EH, Yang HR, Lee HS. Quantitative analysis of distribution of the Patchy eosinophil distributions in an esophagectomy specimen
gastrointestinal tract eosinophils in childhood functional abdominal from a patient with eosinophilic esophagitis: Implications for
pain disorders. J Neurogastroenterol Motil 2018;24:614-627. endoscopic biopsy. J Allergy Clin Immunol 2012;130:798-800.
7. Wauters L, Nightingale S, Talley NJ, Sulaiman B, Walker MM. 19. Silva J, Canão P, Espinheira MC, Trindade E, Carneiro F, Dias JA.
Functional dyspepsia is associated with duodenal eosinophilia Eosinophils in the gastrointestinal tract: how much is normal?
in an Australian paediatric cohort. Aliment Pharmacol Ther Virchows Arch 2018;473:313-320.
2017;45:1358-1364. 20. Du L, Chen B, Kim JJ, Chen X, Dai N. Micro-inflammation in
8. Lee EH, Yang HR, Lee HS. Analysis of gastric and duodenal functional dyspepsia: A systematic review and meta-analysis.
eosinophils in children with abdominal pain related functional Neurogastroenterol Motil 2018;30:e13304.
gastrointestinal disorders according to Rome III criteria. J 21. Ashorn M, Ruuska T, Karikoski R, Välipakka J, Mäki M. Gastric
Neurogastroenterol Motil 2016;22:459-469. mucosal cell densities in Helicobacter pylori-positive and -negative
9. Collins MH, Capocelli K, Yang G-Y. Eosinophilic gastrointestinal dyspeptic children and healthy controls. J Pediatr Gastroenterol
disorders pathology. Front Med (Lausanne) 2018;4:261. Nutr 1994;18:146-151.
10. Hyams JS, Di Lorenzo C, Saps M, Shulman RJ, Staiano A, van 22. Faure C, Patey N, Gauthier C, Brooks EM, Mawe GM. Serotonin
Tilburg M. Functional disorders: children and adolescents. signaling is altered in irritable bowel syndrome with diarrhea
Gastroenterology 2016;150:1456-1468. but not in functional dyspepsia in pediatric age patients.
11. Edwards T, Friesen C, Schurman JV. Classification of pediatric Gastroenterology 2010;139:249-258.
functional gastrointestinal disorders related to abdominal pain 23. Elizabeth A. Montgomery. Biopsy interpretation of the
using Rome III vs. Rome IV criterions. BMC Gastroenterol gastrointestinal tract mucosa. In: Lynsandra Voltaggio (editor),
2018;18:41. third edition. Philadelphia: Wolters Kluwer; 2018, pp. 228-229.
12. Rasquin A, Di Lorenzo C, Forbes D, et al. Childhood functional 24. Kato M, Kephart GM, Talley NJ, et al. Eosinophil infiltration and
gastrointestinal disorders: child/adolescent. Gastroenterology degranulation in normal human tissue. Anat Rec 1998;252:418-425.
2006;130:1527-1537. 25. Burns G, Pryor J, Holtmann G, Walker MM, Talley NJ, Keely S.
13. Strozzi D, Botacin MAS, Mekdessi MA, et al. Frequency of Immune activation in functional gastrointestinal disorders.
esophageal eosinophilia in a pediatric population from Central Gastroenterol Hepatol (N Y) 2019;15:539-548.
Annals of Gastroenterology 33You can also read