Regional community profile: Wellington Community Trust
←
→
Page content transcription
If your browser does not render page correctly, please read the page content below
Regional
community profile:
Wellington Community Trust
October 2020
Contents
1. Summary of Findings                                                                                                       3

2. Background                                                                                                                5
   2.1 Indicator data                                                                                                        6
   2.2 Interpreting the indicator data tables in this report                                                                 7

3. Indicator Data                                                                                                            8
   3.1 Population                                                                                                            8
   3.2 Socio-economic deprivation                                                                                          13
   3.3 Employment and income                                                                                               16
   3.4 Education                                                                                                           17
   3.5 Housing                                                                                                             19
   3.6 Children and young people                                                                                           21
   3.7 Community wellbeing                                                                                                 23
   3.8 Environment                                                                                                         25

References                                                                                                                 26

                              Centre for Social Impact | Wellington Community Trust – Community Profile September 2020 | Page 2
1. Summary of Findings
Population and projections (2018 Census)
  ●   Population: The WCT region is home to around 469,047 people, or 9.8% of New Zealand’s
      population. It has five territorial authority areas. Two thirds of the people in the WCT region
      reside in two of these five areas – Wellington City (45%) and Lower Hutt City (22%). Porirua
      has 12% of the WCT population, followed by 11% in Kapiti Coast District and 9% in Upper
      Hutt City.
  ●   Population projection: The WCT region’s population will increase by 11% by 2038.
      Projected population growth in the region is lower than the projected New Zealand average
      (20%). This means that by 2038, the WCT region is projected to represent a slightly reduced
      9.0% of New Zealand’s population.
  ●   Ethnicity: Porirua (22%) and Lower Hutt (10%) have populations with the highest proportion
      of Pacific Peoples in the WCT region. Both areas also have the populations with the highest
      proportion of Māori (18% and 16% respectively). Population projections show that Māori and
      Pacific communities will grow further in proportion in these two areas by 2038. Wellington City
      has the highest proportion of Asian and MELAA (Middle Eastern, Latin American and African)
      communities in the WCT region, at 17% and 3% respectively. Wellington City also has the
      highest proportion of overseas-born population in the WCT region, at 32%.
  ●   Age: The age profile across the WCT region varies considerably by area. A third or more of
      Porirua’s population (37%) and Lower Hutt’s population (33%) are children and young people
      aged 0–24 years. The majority of children and young people in Porirua identify as Māori or
      Pacific. Wellington City has the largest youth population aged 15–24 years. The age profile of
      all areas is projected to age. This trend is most noticeable in Kapiti Coast, which has the
      highest median age. By 2038, the proportion of over 65’s in the Kapiti Coast is expected to
      increase to over a third of the population (34%).

Indicators of inequity
  ●   Socio-economic deprivation is highest in Porirua and Lower Hutt, and lowest in Upper
      Hutt, Wellington City and Kapiti Coast.
              The 2018 NZ Deprivation Index (NZDep18) describes the areas of New Zealand living
              in areas of highest (decile 10) and lowest (decile 1) deprivation. Lower Hutt has the
              highest average NZDep18 score in the WCT region of 5.8; with 21% (21,549) of the
              population in that area living in deciles 9–10. However, 44% of people in Porirua live
              in deciles 9–10. This equates to 24,891 people and is over twice the national average
              (10% of the population live in each decile). No-one in Upper Hutt, and only 1% of
              people in Wellington City live in deciles 9–10.
              There are 20 Statistical Area Level 2 (SA2) areas within the WCT region that have a
              decile rating of nine or 10, showing small pockets of high deprivation. Nine of the 20
              areas are in Porirua (Ascot Park, Cannons Creek East, Cannons Creek North,
              Cannons Creek South, Elsdon-Takapuwahia, Porirua Central, Porirua East, Titahi Bay
              South and Waitangirua); and eight of the 20 areas are in Lower Hutt (Avalon East,
              Delaney, Moera, Naenae Central, Naenae North, Naenae South, Taita North and
              Taita South).

                            Centre for Social Impact | Wellington Community Trust – Community Profile September 2020 | Page 3
● People who identify as Māori and/or Pacific Peoples are over-represented in areas of
highest deprivation. In Porirua, Pacific Peoples are more than three times as likely as
NZ Europeans to live in deciles 9–10, and Māori are more than twice as likely.
Although 44% of people overall in Porirua live in deciles 9–10, people who identify as
Pacific, Māori or MELAA are significantly over-represented in areas of highest
deprivation; with 83% of Pacific Peoples living in deciles 9–10, 63% of Māori and 60%
of MELAA communities, compared with only 26% of NZ Europeans.
A similar trend can be observed in Lower Hutt, where 43% of Pacific Peoples and
30% of Māori live in deciles 9–10, compared with 16% of NZ Europeans.
● Overall, more children and young people live in areas of highest deprivation than other
age groups – particularly in Porirua and Lower Hutt.
In Porirua, children and young people aged 0–24 years are over-represented in areas
of highest deprivation – over half of all children and young people live in deciles 9–10.
This trend is also apparent in Lower Hutt, where a quarter or more of children and
young people live in deciles 9–10. Children aged 5–14 years in Lower Hutt are
particularly over-represented in areas of highest deprivation (37%).
● Other indicators point to inequities experienced by children and young people in the
WCT region – particularly Māori, Pacific and MELAA children and young people, and
those living in Porirua and Lower Hutt.
Māori and Pacific children have the lowest rates of participation in ECE. Pacific and
MELAA children in Porirua have the lowest rates of participation in the WCT region.
Asian and NZ European young people in the WCT region have higher rates of NCEA
level 2 achievement than Māori and Pacific young people. NCEA achievement
inequities can also be observed for MELAA young people in Wellington City and
Upper Hutt.
National data shows that higher numbers of Māori and Pacific children and young
people across all age groups between 0–24 years old experience risk factors.
Regional risk factor data shows that the highest proportions of children aged 0–14
with two or more risk factors are in Porirua and Lower Hutt. Porirua and Lower Hutt
also have the highest proportion of young people aged 15–24 with one or more risk
factors. Both areas have the highest proportion of Māori and Pacific children and
youth populations in the WCT region.
NEET rates (not in employment, education or training) for young people aged 20–24
years in the WCT are a significant concern. Over a fifth of people in this age group are
NEET in Porirua (24%), Kapiti Coast (23%), Lower Hutt (21%) and Upper Hutt (20%).
Porirua has a high proportion of sole-parent households – 19%, compared with 11%
in Wellington City.
● The WCT region has employment and income inequities – with all other ethnic groups
having lower rates of employment and lower median personal incomes than NZ
Europeans. The greatest inequities are experienced by MELAA communities.
Median personal incomes are highest for people in Wellington City ($40,550) and
lowest for people in Kapiti Coast ($30,500).
Employment rates and median incomes are much higher for NZ Europeans than for
other ethnic groups in the region.
People who identify as MELAA have the lowest median personal incomes –
particularly in Upper Hutt ($18,050), Lower Hutt ($18,900) and Porirua ($20,350).
Centre for Social Impact | Wellington Community Trust – Community Profile September 2020 | Page 4In Porirua, Pacific median incomes are significantly lower than the area’s overall
median. In the Kapiti Coast, Asian median incomes are lowest compared to the area’s
overall median.
● Inequities in relative housing affordability show that more residents spend over the
median income on housing in Porirua and Kapiti Coast, particularly compared to
residents of Wellington City. Damp and mould are a significant issue for households in
Porirua; and for Pacific and Māori households across the region.
Centre for Social Impact | Wellington Community Trust – Community Profile September 2020 | Page 52. Background
This community profile analyses regional indicator data on the people and places in the Wellington
Community Trust (WCT) region likely to be experiencing the greatest inequalities and inequity, based
on the presence of multiple risk indicators.
2.1 Indicator data
Reliable indicator data can help generate a picture of the population groups and/or geographic
communities that may experience risk and inequity relative to others; and show how these risks and
inequities change over time. We can see how people’s life outcomes are shaped by wider systems or
conditions that they may experience, but do not design or control.
For funders, this type of data analysis can inform thinking about where their funding might be invested,
and which communities or population groups might be prioritised to address the inequity picture.
Tracking data over time can also help re-prioritise or sharpen the funding focus, based on changing
indicators of risk.
Table 1 below outlines the indicator data that has been used to develop this picture of potential
inequities for communities in the WCT region.
Table 1: Indicator data and sources
Focus Indicators Data source
Population / Total population Census 2018
demographics
Population projections (to 2038)
Population by ethnic group and by age
Median age
Population born overseas
Regional refugee resettlement
Socio-economic Total population living in areas of highest deprivation NZ Deprivation Index
deprivation 2018; Census 2018
Population living in areas of highest deprivation by ethnic
group and age
Employment and Employment Census 2018
income
Median personal income
Education Prior participation in ECE rates Education Counts, 2020
NCEA level 2 achievement rates
Centre for Social Impact | Wellington Community Trust – Community Profile September 2020 | Page 6Focus Indicators Data source
School stand-down rates
School transience rates
Housing Housing affordability Census 2018; Quality of
Life Project 2018;
Housing Affordability
Housing appropriateness Measure (MBIE) 2019
Housing quality (dampness and mould indicators)
Child and young Children and young people at risk of poor future life Treasury 2016; Census
people outcomes 2018
NEET youth
Sole-parent households
Community Quality of life indicators Quality of Life Project
wellbeing 2018; NZ General Social
Survey 2016 and 2018;
Regional wellbeing indicators Indicators Aotearoa 2019
Voter participation
Environment Swimmable lakes, rivers and beaches Land Air Water Aotearoa
2020
It should be noted that indicator data does not always measure the things that people, families and
whānau value about their wellbeing and their communities. There are often assumptions within the
data – for example, that diverse people in a given community share similar experiences and
opportunities on the basis of where they live.
Indicators are typically risk-focused and involve the ‘absence’ of something in a community, rather
than its strengths. For example, analysing total personal income may not always be an effective
measure of wellbeing in communities that have strong social ties and local food systems, reflecting
more self-determining ways of living. As such, this data should be used with caution, alongside other
sources of information that explore community aspirations and priorities, to develop meaningful
funding priorities.
2.2 Interpreting the indicator data tables in this report
Indicator data within this report is presented in tables with additional commentary that explores trends
that can be seen in the data. The tables are colour-coded using a red-amber-green scale to visually
show which data is highest and lowest. For example, a deprivation index score of 1 (lowest
deprivation) would be green and a score of 10 (highest deprivation) would be red:
Deprivation index
1 2 3 4 5 6 7 8 9 10
score
Centre for Social Impact | Wellington Community Trust – Community Profile September 2020 | Page 7The colour scale can be reversed in terms of whether green represents the highest or lowest numbers.
In most cases – except for Tables 3–9 – the principle is that green indicates where communities
appear to be doing well, and red where communities appear to be doing worse.
3. Indicator Data
3.1 Population
Table 2 highlights some key population statistics for the WCT region, which is home to around
469,047 people, or 9.8% of the total population of New Zealand. Between 2006 and 2018, the WCT
region’s population grew by 12%. This is a slower rate of growth than the NZ average of 16%.
By 2038, the population of the WCT region is projected to increase by 11% to 519,100. This is a much
slower rate of growth than the NZ average of 20%; meaning that the WCT region’s share of the total
NZ population will decrease to 9.0% by 2038.
Table 2: Key population statistics for the WCT region (Statistics NZ, 2018a)
469,047 + 12% 9.8%
Increase in the WCT region’s
Total population in the WCT The WCT region population as
population since 2006 (12
region a percentage of the NZ total
years)
519,100 + 11% 9.0%
Increase in the projected Projected WCT region’s
Total projected population in the
WCT region’s population from population as a percentage of
WCT region by 2038
2018 to 2038 (20 years) the NZ total by 2038
Two thirds of the people in the WCT region reside in Wellington City (45%) and Lower Hutt City (22%).
Porirua has 12% of the WCT population, followed by 11% in Kapiti Coast District and 9% in Upper Hutt
City.
Population analysis at the SA2 area level (Statistical Area Level 2), i.e. the next smallest area unit
after territorial local authorities [formerly called census area units], shows that the SA2 areas in the
WCT region with highest total population are:
● Porirua: Endeavour, Waitangirua
● Wellington: Karori Park, Mount Victoria, Karori South, Mount Cook West, Dixon Street
● Lower Hutt: Waiwhetu
● Kapiti Coast: Waikanae West, Paraparaumu Beach North.
Centre for Social Impact | Wellington Community Trust – Community Profile September 2020 | Page 8Ethnic groups
Tables 3 and 4 below show the WCT region’s ethnic group make up. The ethnic group mix varies
across the territorial authorities - note that percentages will not always add up to 100% as people can
identify with more than one ethnic group.
Kapiti Coast and Upper Hutt have the highest proportion of NZ European populations. Their Māori,
Pacific Peoples and Asian populations are lower than the national average.
Pacific communities
Almost a quarter of Porirua’s population identifies as Pacific (22%, 14,868 people). The Pacific
population is significantly larger in Porirua than any other area in the WCT region. It is more than
double the next highest proportion in Lower Hutt (10%, 12,003 people) and more than triple the
national average (7%).
Projected population change by 2038 will continue this trend – with Porirua and Lower Hutt’s
population projected to include 32% and 16% Pacific Peoples respectively.
Across the WCT region’s Pacific population, 62% identify as Samoan, 20% as Cook Island Māori, 10%
as Tokelauan, 8% as Tongan, 5% as Niuean, 4% as Fijian, 4% as other Pacific Peoples and 1% as
Pacific not further defined.
The 10 SA2 areas with highest total Pacific populations are in Porirua and Lower Hutt:
● Porirua: Waitangirua, Cannons Creek East, Cannons Creek North, Ascot Park, Porirua East,
Cannons Creek South, Titahi Bay South
● Lower Hutt: Taita North, Naenae Central, Taita South.
Māori communities
Porirua (18%, 12,006 people) and Lower Hutt (16%,19,260 people) have the WCT region’s highest
proportion of Māori. However, due to the larger size of population in Wellington City, the 8% Māori
population is also equivalent to 17,409 people.
By 2038, the proportion of Māori living in Porirua and Lower Hutt will have grown significantly to 27%
and 24% respectively. Kapiti Coast’s Māori population will also increase to 20%, which will be higher
than the projected national average of 18%.
The 10 SA2 areas with highest total Māori populations are:
● Lower Hutt: Glendale, Arakura, Naenae Central
● Kapiti Coast: Otaki
● Porirua: Titahi Bay South, Elsdon-Takapuwahia, Waitangirua, Cannons Creek North, Titahi
Bay North, Cannons Creek East.
Asian and MELAA communities
Wellington City (17%, 37,158) has the region’s largest Asian community, followed by Lower Hutt (13%,
15,888). The national average is 13%. By 2038, Wellington City’s Asian population is projected to
increase to 28%, compared to 22% nationally.
Across the WCT region’s Asian population, 34% identify as Indian, 32% as Chinese and 11% as
Filipino.
The WCT region’s Middle Eastern, Latin American and African (MELAA) population is double the
national average at 2%; whilst Wellington City’s MELAA population (3%) is triple the national average.
Centre for Social Impact | Wellington Community Trust – Community Profile September 2020 | Page 9Table 3: Percentage population by ethnic group and territorial authority, 2018 (Statistics NZ, 2018a)
Pacific
NZ European Māori Asian MELAA
Peoples
New Zealand 62% 15% 7% 13% 1%
WCT region 70% 14% 9% 14% 2%
Kapiti Coast district 78% 13% 3% 4% 1%
Porirua city 51% 18% 22% 7% 1%
Upper Hutt city 71% 14% 5% 7% 1%
Lower Hutt city 58% 16% 10% 13% 1%
Wellington city 67% 8% 5% 17% 3%
Table 4: Projected percentage population by ethnic group and territorial authority, 2038 (Statistics NZ, 2018a)
NZ European Māori Pacific Peoples Asian
New Zealand 66% 18% 10% 22%
Kapiti Coast District 85% 20% 5% 9%
Porirua City 64% 27% 32% 13%
Upper Hutt City 84% 18% 7% 13%
Lower Hutt City 68% 24% 16% 20%
Wellington City 67% 10% 5% 28%
Migrant and refugee communities
Table 5 provides data about the WCT region’s migrant (overseas-born) communities. Wellington City
has the largest overseas-born population in the WCT region, at 32%. This has increased from 28% in
2013. Across all other territorial authorities in the WCT region, the proportion of overseas-born
residents is lower than the national average of 27%.
New migrant communities (living in New Zealand for less than one year) are often considered as
having settlement needs that can make them more vulnerable than other communities. Settlement
challenges can include things like language barriers, underemployment, social isolation and access to
housing (Centre for Social Impact, 2018a). In the WCT region, the highest proportion of new migrants
is in Wellington City (7%).
Table 5: Percentage population born overseas by territorial authority and length of time in New Zealand, 2013–
2018 (Statistics NZ, 2018a)
% Born overseas % Born overseas and living in NZSince 2011–12, the Wellington region has received 25% (=1895) of New Zealand’s refugee
resettlement quota. The proportion of the national annual refugee quota population who are resettled
in the Wellington region has steadily decreased from 30% in 2011–12, to just 12% in 2019–20. The
current border restrictions mean that there have been no quota refugees resettled into Wellington to
date in 2020–21. This data does not include people resettling in the region through other resettlement
pathways, including those with Refugee and Protected Persons Status (approved claims for asylum)
and the Refugee Family Support Category (refugee family reunification).
The majority of quota refugees resettled into the Wellington region in the last five years have been
from Syria, Myanmar and Colombia (Immigration NZ, 2020).
Age
Table 6 shows that the populations of Wellington City and Porirua have the lowest median ages (34.1
and 35.1 years respectively). Both Kapiti Coast (47.9 years) and Upper Hutt (39.1 years) have median
ages higher than the New Zealand average. Overall, New Zealand’s median age lowered between
2013 and 2018 by 0.6 years. Porirua, Upper Hutt and Lower Hutt followed suit, with populations
becoming slightly younger on average.
Table 6: Difference in the median age of the population by territorial authority, 2013–2018 (Statistics NZ, 2018a)
2013 Median 2018 Median
Difference
age age
New Zealand 38 37.4 -0.6
Kapiti Coast 46.9 47.9 1.0
Porirua City 35.2 35.1 -0.1
Upper Hutt 39.7 39.1 -0.6
Lower Hutt 37.2 36.9 -0.3
Wellington City 33.9 34.1 0.2
Table 7 shows that Porirua’s population has the largest proportion of children aged 0–14 years in the
WCT region. A third or more of Porirua’s population (37%) and Lower Hutt’s population (33%) are
children and young people aged 0–24 years.
In Porirua, 42% of children aged 0–4 years and 47% of children aged 5–14 years identify as Māori or
Pacific, compared to 28% and 32% nationally.
Wellington City has the largest youth population aged 15–24 years (17%), which is higher than the
national average of 13%. Within this age group, 67% of Wellington’s young people identify as NZ
European, and 14% identify as Asian. In Porirua, 50% of young people aged 15–24 years identify as
Māori or Pacific, compared to 28% nationally.
Kapiti Coast has the largest proportion of people aged 65 years and over. The area’s population is
also ageing, with the median age increasing by one year since 2013, and the proportion of over 65’s
expected to increase to over a third by 2038 (34%). Wellington City’s population is also projected to
age, with the proportion of over 65’s set to increase to 18% by 2038.
Centre for Social Impact | Wellington Community Trust – Community Profile September 2020 | Page 11Table 7: Percentage population by age group and territorial authority, 2018 (Statistics NZ, 2018a)
0-4 years 5-14 years 15-24 years 25-64 years 65+ years
New Zealand 6% 13% 13% 52% 15%
Kapiti Coast District 5% 12% 9% 47% 26%
Porirua City 8% 16% 13% 52% 12%
Upper Hutt City 6% 13% 12% 53% 15%
Lower Hutt City 7% 14% 12% 54% 14%
Wellington City 5% 11% 17% 56% 10%
Table 8: Projected percentage population by age group and territorial authority, 2038 (Statistics NZ, 2018a)
0-4 years 5-14 years 15-24 years 25-64 years 65+ years
New Zealand 5% 12% 12% 48% 23%
Kapiti Coast District 5% 11% 8% 42% 34%
Porirua City 6% 13% 11% 46% 24%
Upper Hutt City 5% 12% 11% 46% 26%
Lower Hutt City 6% 12% 11% 49% 23%
Wellington City 5% 10% 15% 52% 18%
Table 9 details the SA2 areas in the WCT region with the 10 lowest and 10 highest median ages. The
lowest median age areas are all in Wellington City and Porirua, with the majority of the highest median
age areas in Kapiti Coast.
Table 9: SA2 areas in the WCT region with the lowest and highest median age, 2018 (Statistics NZ, 2018a)
Lowest median age (SA2 areas) Highest median age (SA2 areas)
Wellington Botanic
21.8 Waikanae West 61.8
Gardens
Wellington University 22.5 Waikanae Park 58
Mount Cook East 24.6 Peka Peka 52.1
Wellington City Vivian West 25.8 Forest Lakes 52
Dixon Street 25.9 Kapiti Coast Waikanae East 51.2
Wellington Central 26 Paraparaumu Beach West 50.5
Mount Cook West 27.6 Maungakotukutuku 50.3
Waitangirua 26.4 Te Horo 50.1
Porirua City Cannons Creek North 27.1 Otaki Forks 50
Cannons Creek East 27.4 Wellington City Oriental Bay 50
Centre for Social Impact | Wellington Community Trust – Community Profile September 2020 | Page 123.2 Socio-economic deprivation
Deprivation indices combine multiple risk indicators to demonstrate relative deprivation across the
country. In Aotearoa New Zealand there are two primary deprivation indices:
● The NZ Deprivation Index or NZDep18, developed by the University of Otago, uses nine
census data indicators. It was first published in 1991 and is updated with each new census. It
uses a decile scoring system where one is the least deprived and 10 is the most deprived
(Atkinson, Salmond & Crampton, 2019).
● The NZ Index of Multiple Deprivation or IMD, developed by the University of Auckland in 2013,
uses 28 indicators from the Government’s integrated data infrastructure (IDI). It uses a quintile
scoring system where one is the least deprived and 5 is the most deprived (Exeter, D. J.,
Zhao, J., Crengle, S., Lee, A., and Browne, M., 2017).
There are a number of differences in how the two indices are compiled, although both provide a similar
picture of deprivation. The NZDep18 has been most recently updated and re-published and is
therefore used as the primary focus in this report.
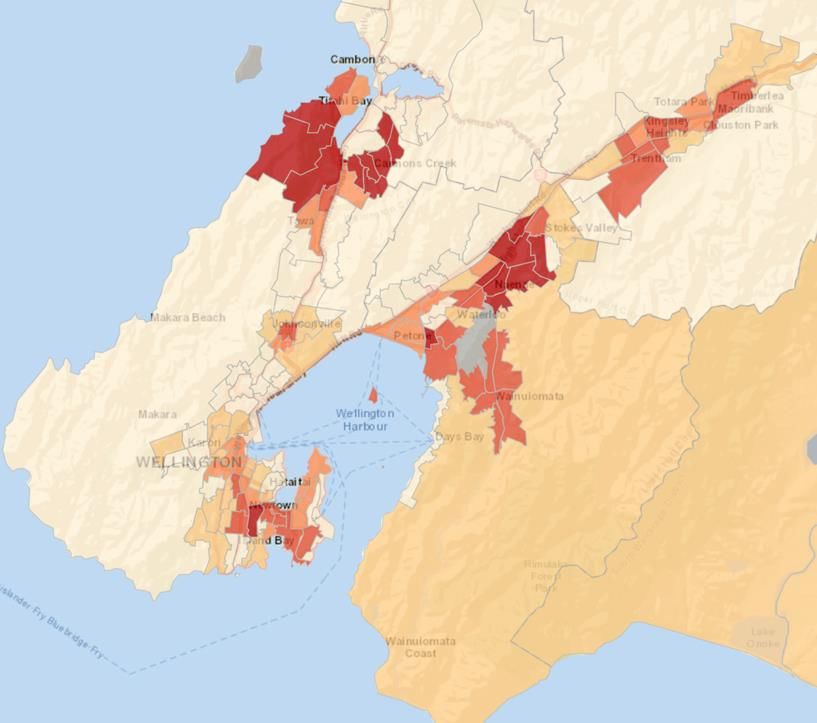
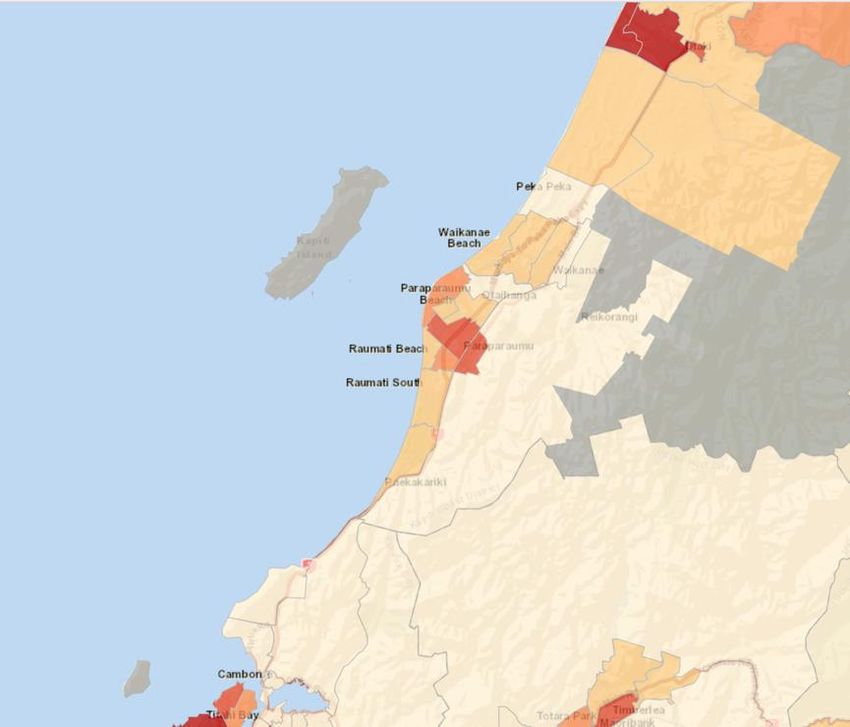
Map 1 illustrates the areas of the WCT region that have the highest (deciles 9–10) and lowest (deciles
1–2) socio-economic deprivation based on the NZDep18 decile scores of SA2 areas. An interactive
version of this map can be viewed online.
Analysis of the deprivation score of all SA2 areas within each territorial authority provides an average
deprivation index score – see Table 10. Lower Hutt has the highest average NZDep18 score in the
WCT region of 5.8, with 21% (21,549) of the population in that area live in deciles 9–10 (highest
deprivation). However, 44% of people in Porirua live in deciles 9–10 – this equates to 24,891 people
and as a proportion is over twice the national average (10% of the population live in each decile). No
one in Upper Hutt, and only 1% of people in Wellington City, live in deciles 9–10.
Centre for Social Impact | Wellington Community Trust – Community Profile September 2020 | Page 13Map 1: NZDep2018 decile in the WCT region by SA2, 2018 (Atkinson et al., 2018)
Centre for Social Impact | Wellington Community Trust – Community Profile September 2020 | Page 14Table 10: Average deprivation index score and percentage of the total population living in deciles 9–10 by
territorial authority, 2018 (Atkinson et al., 2018)
% Population living in Total population living in
Average NZDep18 score
deciles 9-10 deciles 9-10
New Zealand 5.0 10% 479,336
Kapiti Coast district 4.6 10% 5,307
Porirua city 5.5 44% 24,891
Upper Hutt city 5.0 0% -
Lower Hutt city 5.8 21% 21,549
Wellington city 3.8 2% 3,642
In total, there are 20 SA2 areas in the WCT region that are rated as being deciles 9–10 on the
NZDep18 index. These areas are:
● Porirua (9): Ascot Park, Cannons Creek East, Cannons Creek North, Cannons Creek South,
Elsdon-Takapuwahia, Porirua Central, Porirua East, Titahi Bay South and Waitangirua.
● Lower Hutt (8): Avalon East, Delaney, Moera, Naenae Central, Naenae North, Naenae South,
Taita North and Taita South.
● Kapiti Coast (2): Otaki and Otaki Beach.
● Wellington City (1): Newtown South
Tables 11 and 12 detail the percentage of each ethnic group and each age group that are living in
deciles 9–10. Although 44% of people overall in Porirua live in deciles 9–10, people who identify as
Pacific, Māori or MELAA are significantly over-represented in areas of highest deprivation; with 83% of
Pacific Peoples living in deciles 9–10, 63% of Māori and 60% of MELAA communities. Similar
inequities can be observed in Lower Hutt.
In Porirua, children and young people aged 0–24 years are over-represented in the areas of highest
deprivation – over 50% across all child and youth age groups live in deciles 9–10. This is partly
attributable to Porirua’s overall low age profile. This trend is also apparent in Lower Hutt, with children
aged 5–14 particularly over-represented in areas of highest deprivation.
Table 11: Percentage population by ethnic group living in deciles 9–10, 2018 (Atkinson et al., 2018; Statistics NZ,
2018a)
NZ European Māori Pacific Peoples Asian MELAA
Kapiti Coast district 8% 27% 18% 10% 7%
Porirua city 26% 63% 83% 47% 60%
Upper Hutt city 0% 0% 0% 0% 0%
Lower Hutt city 16% 30% 43% 19% 37%
Wellington city 1% 2% 4% 2% 8%
Centre for Social Impact | Wellington Community Trust – Community Profile September 2020 | Page 15Table 12: Percentage population living in deciles 9–10 by age and territorial authority, 2018 (Atkinson et al., 2018;
Statistics NZ, 2018a)
All ages 0-4 years 5-14 years 15-24 years 25-64 years 65+ years
Kapiti Coast district 10% 12% 8% 10% 10% 9%
Porirua city 44% 51% 51% 54% 41% 34%
Upper Hutt city 0% 0% 0.% 0% 0% 0%
Lower Hutt city 21% 25% 37% 23% 2% 17%
Wellington city 2% 2% 4% 2% 2% 2%
3.3 Employment and income
Employment in the WCT is, overall, in line with the New Zealand average – with slightly higher
employment in Wellington City and Upper Hutt and slightly lower employment in Porirua. In line with
national trends, Māori and Pacific Peoples experience greatest inequalities in terms of employment.
Table 13 shows that the most significant employment inequities in the WCT region are experienced by
people who identify as MELAA, particularly in Porirua where only 54% of MELAA communities aged
15–64 years are in employment.
Table 13: Percentage population aged 15-64 years in employment (full time or part time), by territorial authority
area and ethnic group (Statistics NZ, 2018)
NZ Pacific
Total Māori Asian MELAA
European Peoples
New Zealand 75% 78% 66% 66% 69% 67%
Kapiti Coast 75% 76% 68% 70% 75% 72%
Porirua City 73% 78% 64% 64% 68% 54%
Upper Hutt 76% 78% 66% 66% 71% 66%
Lower Hutt 75% 78% 66% 69% 71% 60%
Wellington City 78% 80% 72% 73% 72% 64%
Some income indicators are included within the NZDep18 indicator, however, Table 14 below outlines
the median personal income by territorial authority area and ethnic group in further detail, as an
indicator of potential income inequality.
Median personal incomes are highest for people in Wellington City ($40,550) and lowest for people in
Kapiti Coast ($30,500).
Incomes are much higher for NZ Europeans than for other ethnic groups. People who identify as
MELAA have the lowest median personal incomes – particularly in Upper Hutt ($18,050), Lower Hutt
($18,900) and Porirua ($20,350).
In Porirua, Pacific median incomes are also significantly lower than the area’s overall median. In the
Kapiti Coast, Asian median incomes are lowest compared to the area’s overall median.
Centre for Social Impact | Wellington Community Trust – Community Profile September 2020 | Page 16Table 14: Median personal income for the population aged 15–64 years, by territorial authority area and ethnic
group (Statistics NZ, 2018)
All ethnic NZ Pacific
Māori Asian MELAA
groups European Peoples
New Zealand $31,250 $34,550 $25,250 $25,350 $26,550 $24,550
Kapiti Coast $30,500 $31,450 $26,950 $25,650 $24,400 $27,300
Porirua City $32,000 $38,000 $27,300 $24,250 $26,300 $20,350
Upper Hutt City $34,250 $36,350 $28,100 $27,300 $26,700 $18,050
Lower Hutt City $33,050 $37,050 $27,000 $26,500 $27,850 $18,900
Wellington City $40,550 $44,900 $34,650 $30,350 $30,950 $22,000
3.4 Education
Education indicators can be a useful tool for understanding potential inequities that exist for children
and young people. Education is a key determinant of a person’s future social and economic wellbeing.
Educational outcomes can determine social development, future employment opportunities, income/
economic wellbeing and overall personal wellbeing including health and social capital (Centre for
Social Impact, 2018b).
New Zealanders with no qualifications have an unemployment rate 48% higher than those whose
highest qualification is a school qualification. Average earnings are 24% higher for those with a tertiary
qualification. Educational attainment can be influenced by a range of factors including early learning,
school transience, stand-downs and suspensions and wider factors including family income (Centre for
Social Impact, 2018b).
Table 15 details the percentage of school children who start school at aged five with some prior
participation in early childhood education (ECE). Across the WCT region, participation in ECE is
generally higher than the New Zealand average. NZ European and Asian children have the region’s
highest rates of participation. Māori and Pacific children have the lowest rates of prior participation in
ECE. Pacific and MELAA children in Porirua have the lowest overall rates of participation in the WCT
region.
Table 15: Percentage of children starting school with prior participation in early childhood education in the year to
June 2020, by territorial authority area and ethnic group (Education Counts, 2020a)
NZ Pacific
Total Māori Asian MELAA
European Peoples
New Zealand 90% 94% 83% 76% 89% 82%
Kapiti Coast 99% 99% 96% 96% 100% n/d
Porirua City 97% 99% 96% 94% 96% 94%
Upper Hutt 99% 99% 99% 100% 99% n/d
Lower Hutt 99% 99% 98% 96% 100% 100%
Wellington City 99% 100% 98% 96% 98% 98%
Table 16 details the percentage of school leavers that have attained NCEA level 2 qualifications. In
line with the NZ picture, Asian and NZ European young people in the WCT region have higher rates of
Centre for Social Impact | Wellington Community Trust – Community Profile September 2020 | Page 17NCEA level 2 achievement than Māori and Pacific young people. NCEA achievement inequities can
also be observed for MELAA young people in Wellington City and Upper Hutt.
Table 16: Percentage of young people aged 18 years leaving school with NCEA level 2 or above, by territorial
authority area and ethnic group (Education Counts, 2019)
NZ Pacific
All leavers Māori Asian MELAA
European Peoples
New Zealand 79% 82% 65% 74% 90% 84%
Kapiti Coast 88% 88% 81% 91% 95% 90%
Porirua City 77% 79% 71% 79% 87% 77%
Upper Hutt City 85% 86% 78% 83% 84% 78%
Lower Hutt City 80% 83% 69% 73% 85% 86%
Wellington City 90% 92% 81% 85% 92% 74%
Table 17 details the rates of student stand-downs across all age groups. Stand-down rates are highest
in Lower Hutt and Upper Hutt. They are significantly higher for Māori and Pacific students, especially
in these two areas.
Table 17: Age-standardised stand-down rates per 1,000 students, by territorial authority area and ethnic group
(Education Counts, 2020b)
Ethnic Group Age Group
Total NZ
Europ- Māori Pacific Asian Other 5–9 10–14 15+
ean
New Zealand 29.0 24.4 48.6 34.4 6.0 14.9 12.5 44.1 33.1
Kapiti Coast 10.6 8.5 17.7 4.2 13.2 0.0 5.9 19.5 4.4
Porirua City 26.1 18.1 36.9 25.5 10.7 7.6 4.4 36.3 54.7
Upper Hutt City 32.0 26.7 53.7 42.6 3.1 35.9 16.1 51.9 29.7
Lower Hutt City 35.8 25.7 65.2 44.7 5.0 15.2 8.7 55.5 52.5
Wellington City 7.7 5.4 18.1 16.1 2.7 9.3 3.4 11.6 9.0
Table 18 shows the relative levels of school transience. Transience can be linked to other factors -
particularly insecure housing. Regularly changing schools can have a negative impact on student
attendance and attainment, as well as transitions between the school levels. Student transience is
highest in Porirua and Lower Hutt.
Centre for Social Impact | Wellington Community Trust – Community Profile September 2020 | Page 18Table 18: School transience rate (number of students per 1,000 who move school more than twice in a year), by
territorial authority (Education Counts, 2020c)
Transience rate
Total 4.0
Kapiti Coast District 6.4
Porirua City 9.0
Upper Hutt City 3.8
Lower Hutt City 6.7
Wellington City 3.6
3.5 Housing
The Ministry of Housing and Urban Development (HUD) has developed a Housing Affordability
Measure (HAM). This identifies the proportion of renters and homeowners who have below the
estimated national median equivalised* income after housing costs such as rent, mortgage payments,
body corporate fees, rates and insurance (*equivalised means that the income remaining after housing
costs has been adjusted for the number of adults and children in the household). As such, the HAM is
a useful guide for understanding relative housing affordability (in relation to income) between territorial
authority areas and regions for both renters and homeowners. HAM data from the WCT region is
detailed in Table 19.
Across the wider Wellington region, housing costs relative to income are lower than the NZ average.
Within Wellington City homeowners and renters spend below the median income on housing. In
Porirua and Kapiti coast, three quarters of home owners and almost two thirds of renters spend above
the median income on housing.
Table 19: Share of households spending over the median equivalised income on housing costs in the quarter to
December 2019 (HUD, 2019)
Homeowners spending above Renters spending above
median income on housing median income on housing
New Zealand 71% 57%
Kapiti Coast 74% 62%
Porirua City 75% 62%
Upper Hutt City 71% 59%
Lower Hutt City 70% 59%
Wellington City 54% 41%
Wellington Region 64% 52%
Three of the WCT region’s territorial local authorities (Porirua City, Lower Hutt City and Wellington
City) participate in the New Zealand Quality of Life Survey, alongside Auckland, Hamilton, Tauranga,
Christchurch and Dunedin. Table 20 details data from this survey in relation to housing affordability
and appropriateness. Across the WCT region, residents in Porirua are least likely to think their housing
costs are affordable and that their housing meets the needs of their household. Results from residents
in Lower Hutt and Wellington City were more positive than the average across the eight cities that
participate in this survey.
Centre for Social Impact | Wellington Community Trust – Community Profile September 2020 | Page 19Table 20: Quality of life housing indicators (Quality of Life Project, 2018)
Percentage of residents who Percentage of residents who
think their housing costs are think their housing meets the
affordable needs of their household
8 City total 47.0% 81.0%
Porirua City 47.0% 80.0%
Lower Hutt City 58.0% 83.0%
Wellington City 51.0% 83.0%
Tables 21 and 22 detail NZ Census data about the condition of housing in terms of dampness and
mould respectively. Dampness and mould can be caused by poor quality housing and inadequate
heating and ventilation, as well as climate conditions.
Damp and mould are a significant issue for households in Porirua. Pacific and Māori households have
a higher instance of households that are always damp and mouldy, followed by MELAA households.
Table 21: Percentage of occupied dwellings that are ‘always’ damp, by territorial authority and ethnic group
(Statistics NZ, 2018)
NZ Pacific
Total Māori Asian MELAA
European Peoples
New Zealand 3% 2% 7% 9% 3% 5%
Kapiti Coast 1% 1% 3% 2% 1% 0%
Porirua City 5% 3% 8% 11% 3% 9%
Upper Hutt City 2% 2% 6% 7% 3% 4%
Lower Hutt City 3% 2% 7% 9% 3% 4%
Wellington City 3% 3% 5% 8% 3% 7%
Table 22: Percentage of occupied dwellings that ‘always’ have an area of mould bigger than A4 in size, by
territorial authority and ethnic group (Statistics NZ, 2018)
NZ Pacific
Total Māori Asian MELAA
European Peoples
New Zealand 5% 4% 9% 12% 4% 6%
Kapiti Coast 3% 2% 5% 6% 3% 1%
Porirua City 7% 4% 10% 14% 4% 7%
Upper Hutt City 4% 3% 7% 8% 3% 4%
Lower Hutt City 5% 4% 9% 12% 4% 7%
Wellington City 5% 5% 8% 11% 4% 8%
Centre for Social Impact | Wellington Community Trust – Community Profile September 2020 | Page 203.6 Children and young people
The New Zealand Treasury (2016) has developed a risk framework to identify children and young
people that are most at risk of poor future life outcomes. This framework (Table 23) identifies four risk
factors for children aged 0–5 years and 6–14 years, five risk factors for young people aged 15–19
years and five for young people aged 20–24 years.
Table 23: Child and youth risk factors (Treasury, 2016)
Child risk factors Youth risk factors
0–14 years 15–19 years 20–24 years
Having a Child Youth & Family Teenage boys with Youth Justice Young offenders with a custodial
finding of abuse or neglect or Corrections history sentence
Being mostly supported by benefits Teenagers with health, disability Young offenders with a community
since birth issues or special needs sentence and CYF history
Having a parent with a prison or Teenage girls supported by Jobseekers in poor health with
community sentence benefits CYF history
Having a mother with no formal Mental health service users with Sole parents not in full-time
qualifications stand-down or CYF history employment with CYF history
Experienced significant childhood Long-term disability beneficiaries
disadvantage
Children with two or more risk factors and young people with one or more risk factor(s) are more likely
to leave school with no qualifications, to spend time on benefit, and to receive a prison or community
sentence when they grow up. The more risk factors a child or young person has, the more likely these
outcomes are. It is important to note, however, that these risk factors are not a guarantee of poor
future outcomes and do not fully consider the presence of other protective factors that might support
positive outcomes.
Nationally:
● 13% of children aged 0–5 years have two or more risk factors across all ethnic groups; 33% of
children 0–5 with two or more risk factors are Māori, 17% are Pacific and 9% are NZ
European.
● 14% of children aged 6–14 years have two or more risk factors; 35% of children 6–14 with two
or more risk factors are Māori, 20% are Pacific and 9% are NZ European.
● 14% of young people aged 15–19 years have one or more risk factors; 33% of young people
aged 15–19 with one or more risk factors are Māori, 16% are Pacific and 11% are NZ
European.
● 8% of young people aged 20–24 years have one or more risk factors; 20% of young people
aged 20–24 with one or more risk factors are Māori, 9% are Pacific and 6% are NZ European.
Regional data is also available by age group, as shown in Table 24. This shows that the highest
proportions of children aged 0–14 years with two or more risk factors are in Porirua and Lower Hutt. In
both areas, Māori and Pacific children make up a significant portion of the 0–14 age group – 43% of
children aged 0–4 years and 48% of children aged 5–14 years in Porirua are Māori and Pacific; 30%
of children aged 0–4 years and 35% of children aged 5–14 years in Lower Hutt are Māori and Pacific.
Centre for Social Impact | Wellington Community Trust – Community Profile September 2020 | Page 21Porirua and Lower Hutt also have the highest proportion of young people aged 15–24 with one or
more risk factors. In both areas, Māori and Pacific young people make up a significant portion of the
15–24 age group – 50% of young people aged 15–24 years in Porirua are Māori and Pacific, and 35%
in Lower Hutt.
Table 24: Percentage of children (0-14 years) with two or more risk factors and percentage of young people (15-
24 years) with one or more risk factor (Treasury, 2016b)
0-5 years 6-14 years 15-19 years 20-24 years
New Zealand 13% 14% 14% 8%
Kapiti Coast 13% 11% 13% 9%
Porirua City 14% 14% 16% 10%
Upper Hutt 9% 10% 14% 7%
Lower Hutt 12% 14% 14% 9%
Wellington City 4% 4% 7% 3%
Table 25 details the percentage of young people aged 15–24 years who are not in education,
employment or training (NEET). NEET rates for young people aged 15–19 years are highest in
Porirua, Lower Hutt and Upper Hutt. NEET rates for young people aged 20–24 years are a significant
concern. More than a fifth of young people in this age group are NEET in Porirua (24%), Kapiti Coast
(23%), Lower Hutt (21%) and Upper Hutt (20%).
Table 25: Percentage of young people (15-24 years) not in education, employment or training (NEET) (Treasury,
2016c)
15-19 years 20-24 years
Wellington region rank
10th lowest (7.2%) 14th lowest (16%)
out of 16 regions
Kapiti Coast 7.4% 22.5%
Porirua City 9.1% 23.9%
Upper Hutt 8.5% 20.4%
Lower Hutt 8.7% 20.8%
Wellington City 5.7% 12.2%
Children in sole-parent households may experience further disadvantage due to lower household
income and other related factors such as material hardship or insecure housing. Table 26 shows that
Porirua has a high level of sole-parent households (19%), whilst Wellington City has a low percentage
(11%).
Table 26: Percentage of people in families with solo-parent households, by territorial authority (Statistics NZ,
2018a)
Sole-parent households
New Zealand 15%
Kapiti Coast 15%
Porirua City 19%
Upper Hutt 16%
Lower Hutt 16%
Wellington City 11%
Centre for Social Impact | Wellington Community Trust – Community Profile September 2020 | Page 223.7 Community wellbeing
Tables 27 and 28 detail community wellbeing and quality of life indicator data from two key sources –
the New Zealand General Social Survey and the Quality of Life Project (see also section 3.5 on
housing). These data sources provide insight into resident’s perceptions of their community’s strengths
and challenges.
Table 27: Regional wellbeing indicators for the Wellington region (Indicators Aotearoa NZ, 2019)
Wellbeing indicator 2016 2018
Family People aged 15 years or above who rated their 80.9% (5th highest out 81.8% (7th highest out
wellbeing family wellbeing as 7/10 or higher of 12 regions) of 12 regions)
People aged 15 years or above who rated their 81.7% (=8th highest out 82.1% (4th highest out
Life satisfaction life satisfaction as 7/10 or higher of 12 regions) of 12 regions)
People aged 15 years or above who rated the
Sense of 87.9% (4th highest out 84.8% (11th highest out
‘worthwhileness’ of the things they do as 7/10 or
purpose of 12 regions) of 12 regions)
higher
People aged 15 years or above who rated their
Sense of 89.5% (5th highest out
sense of belonging to New Zealand as 7/10 or n/d
belonging of 12 regions)
higher
Experience of People aged 15 years or above who experienced 17.1% (6th highest out 18.3% (6th highest out
discrimination discrimination in the last 12 months of 12 regions) of 12 regions)
People aged 15 years or above who reported
17.1% (6th highest out 16.9% (6th highest out
Loneliness feeling lonely some, most or all of the time in the
of 12 regions) of 12 regions)
last 4 weeks
People aged 15 years or above who could easily 77.3% (8th highest out 75.9% (11th highest out
Social support or very easily ask someone for a place to stay of 12 regions) of 12 regions)
Cultural People aged 15 years or above participated in 67.4% (3rd highest out
traditional cultural activities n/d
participation of 6 regions)
Analysis of Wellington regional data (Table 27) shows that in 2018, communities compared
themselves well to the rest of New Zealand in relation to life satisfaction, experience of discrimination
and loneliness; and less well in relation to sense of purpose and access to social support – which
noticeably decreased from 2016.
Table 28 details sub-regional data for participating territorial authorities in the WCT region (Porirua,
Lower Hutt and Wellington City), where:
● Communities in Porirua self-rated relatively well for access to social support and sense of
community; but relatively poorly for community safety and the view that Porirua is a great
place to live.
● Communities in Lower Hutt self-rated relatively well for quality of life, community safety and
sense of community; but relatively poorly for experience of stress and loneliness.
● Communities in Wellington City self-rated relatively well across all indicators – particularly for
the view that Wellington is a great place to live, that cultural diversity makes the city a better
place to live, and for community safety.
Centre for Social Impact | Wellington Community Trust – Community Profile September 2020 | Page 23Table 28: Quality of Life Project indicators across participating areas of the WCT region (Quality of Life Project,
2018)
People who People who feel
People who believe
perceived the local People who feel a cultural diversity
their quality of life is
area as a great sense of makes the area a
good (extremely
place to live community (agree better place to live
good, very good or
(strongly agree or or strongly agree) (better or much
good)
agree) better place)
8 City total 84% 79% 52% 58%
Porirua City 82% 72% 59% 58%
Lower Hutt City 89% 81% 58% 57%
Wellington City 89% 94% 54% 77%
People who have
People who felt experienced of
People with access lonely or isolated in stress in the last
People who feel
to support in times the last 12 months 12-months that has
safe after dark
of need (definitely (sometimes, most had a negative
(very or fairly safe)
or probably) of the time or impact (sometimes,
always) most of the time or
always)
8 City total 93% 48% 35% 72%
Porirua City 94% 33% 34% 70%
Lower Hutt City 93% 53% 32% 68%
Wellington City 95% 73% 37% 72%
Table 29 looks at voter participation across general and Māori electorates that cover the WCT region
(and in some cases areas outside of the region), as an indicator of civic engagement. Voter
participation is lowest in the Māori electorates Te Tai Hauāuru (Kapiti Coast and Porirua), Ikaroa-
Rāwhiti (Upper Hutt, Lower Hutt – but also covering Wairarapa outside of the WCT region) and Te Tai
Tonga (Wellington City – but also covering the South Island). Participation is also lower than the
national average in Porirua, Upper Hutt and Lower Hutt; but higher across Wellington City.
Table 29: Voter participation in the 2017 general election across the WCT region by General and Māori
electorates (Indicators Aotearoa NZ, 2019)
Electorates Voter participation 2017
Ōtaki (Kapiti Coast) 84%
Te Tai Hauāuru (Māori electorate - Kapiti Coast, Porirua) 69%
Mana (Porirua) 82%
Rimutaka (Upper Hutt) 82%
Hutt South (Lower Hutt) 83%
Ikaroa–Rāwhiti (Māori electorate – Wairarapa, Upper Hutt, Lower Hutt) 68%
Ōhāriu (Wellington City) 85%
Rongotai (Wellington City) 85%
Wellington Central (Wellington City) 86%
Te Tai Tonga (Māori electorate - Wellington City, South Island) 71%
Centre for Social Impact | Wellington Community Trust – Community Profile September 2020 | Page 243.8 Environment
It is difficult to find detailed environmental data published by region or by local authority in New
Zealand. Most regional data is published by Regional Councils via ‘State of the Environment’ reports –
and these are updated infrequently.
Wellington Regional Council’s ‘State of the Environment’ report (2012) provides an overview of some
key environmental indicators in the WCT region. Air quality in the region is good 'most of the time’ in
Wellington, Porirua and Kapiti due to their coastal environments. Air quality can sometimes be lower in
Upper Hutt and Lower Hutt due to their locations and the common use of domestic fires during cold
weather. Dairying and vegetable growing in the Regional Council area is having a negative impact on
soil quality.
Data from Land Air Water Aotearoa (LAWA) shows the current water quality of rivers, lakes and
beaches in the WCT region is a significant issue, with only six monitored sites suitable for swimming
(all in central Wellington); whilst nine monitored sites have caution advised for swimming (all central
Wellington) and 57 monitored sites are unsuitable for swimming (LAWA, 2020).
Centre for Social Impact | Wellington Community Trust – Community Profile September 2020 | Page 25References
Atkinson, J., Salmond, C., and Crampton, P. (2019). NZDep2018 Index of deprivation: Interim
research report December 2019. Wellington: University of Otago. Retrieved from
https://www.otago.ac.nz/wellington/otago730394.pdf
Centre for Social Impact. (2018a). Effective philanthropic support for diverse communities. Retrieved
from https://do6qmrbufqcd2.cloudfront.net/1001/18-fn-effective-philanthropic-support-full-ƒ3.pdf
Centre for Social Impact. (2018b). Understanding the landscape of Auckland and Northland, an
evidence review. Retrieved from https://do6qmrbufqcd2.cloudfront.net/1001/18-fn-0070-evidence-
review-07.pdf
Education Counts. (2019). NCEA Level 2 achievement. Retrieved from
https://www.educationcounts.govt.nz/statistics/indicators/main/education-and-learning-outcomes/1781
Education Counts. (2020a). Prior participation in ECE year to June 2020. Retrieved from
https://www.educationcounts.govt.nz/statistics/early-childhood-education/participation
Education Counts. (2020b). Stand-downs, suspensions, exclusions and expulsions from school.
Retrieved from https://www.educationcounts.govt.nz/statistics/indicators/main/student-engagement-
participation/stand-downs-suspensions-exclusions-expulsions
Education Counts. (2020c). Transient students. Retrieved from
https://www.educationcounts.govt.nz/statistics/indicators/main/student-engagement-
participation/transient-students
Exeter, D. J., Zhao, J., Crengle, S., Lee, A., and Browne, M. (2017). The New Zealand indices of
multiple deprivation (IMD): a new suite of indicators for social and health research in Aotearoa, New
Zealand. Auckland: The University of Auckland. Retrieved from
https://www.fmhs.auckland.ac.nz/assets/fmhs/soph/epi/hgd/docs/EXETER_PLOS_IMD.pdf
Ministry of Housing and Urban Development. (2019). Housing affordability measure. Retrieved from
https://www.hud.govt.nz/news-and-resources/statistics-and-research/housing-affordability-measure-
ham/housing-affordability-measure-downloads-and-notes-of-interest/
Immigration New Zealand. (2020). Refugee statistics. Retrieved from
https://www.immigration.govt.nz/about-us/research-and-statistics/statistics
Indicators Aotearoa NZ – Ngā Tūtohu Aotearoa. (2019). Wellbeing indicators. Retrieved from
https://wellbeingindicators.stats.govt.nz
Land Air Water Aotearoa (LAWA). (2020). Can I swim here? Retrieved from
https://www.lawa.org.nz/explore-data/swimming/
Quality of Life Project. (2018). Quality of life indicators. Retrieved from
http://www.qualityoflifeproject.govt.nz/index.htm
Statistics NZ. (2018a). NZ Census 2018. Retrieved from http://nzdotstat.stats.govt.nz/
The Treasury. (2016a). The characteristics of children at risk. Wellington: The Treasury. Retrieved
from https://treasury.govt.nz/sites/default/files/2016-02/ap16-01-infographic.pdf
Centre for Social Impact | Wellington Community Trust – Community Profile September 2020 | Page 26The Treasury. (2016b). Insights: children and youth at risk. Retrieved from
https://insights.treasury.govt.nz/insights/#
The Treasury. (2016c). Insights: youth transitions to adulthood. Retrieved from
https://insights.treasury.govt.nz/insights/#
Centre for Social Impact | Wellington Community Trust – Community Profile September 2020 | Page 27You can also read