2018 Interim Results 8 August 2018 - Investor Relations Asia Pacific
←
→
Page content transcription
If your browser does not render page correctly, please read the page content below

2018 Interim Results
8 August 2018

Confidential and Proprietary Information
© Cathay Pacific Airways Limited and its subsidiaries

Agenda

                                                        •   Briefing highlights
                                                        •   Operating performance
                                                                     - Passenger Services
                                                                     - Cargo Services
                                                                     - Operating costs
                                                                     - Subsidiaries and Associates
                                                                     - Other financials
                                                        •   Fleet Profile
                                                        •   Transformation Update
                                                        •   Outlook
                                                        •   Q&A

                                                        Hosted by:
                                                        -   Rupert Hogg, Chief Executive Officer
                                                        -   Martin Murray, Chief Financial Officer
                                                        -   Paul Loo, Chief Customer and Commercial
                                                            Officer
Confidential and Proprietary Information
© Cathay Pacific Airways Limited and its subsidiaries                                                 2
Briefing highlights

Confidential and Proprietary Information
© Cathay Pacific Airways Limited and its subsidiaries
Continued recovery driven by the airlines

                                                         HK$’m                            1H2018    1H2017
                                                         Airlines’ loss before taxation     (743)     (3,755)
                                                         Gains on disposal of
                                                         investment and deemed partial
                                                         disposal of associate                  -        830
                                                         Taxation                           (161)        160
                                                         Airlines' loss after taxation      (904)     (2,765)
                                                         Share of profits from
                                                                                             641         714
                                                         subsidiaries & associates
                                                         Group attributable loss            (263)     (2,051)

                                                        The Group reported an attributable loss of
                                                        HK$(263) million for the first six months of 2018.

                                                        This compares to a loss of HK$(2,051) million in the
                                                        first half of 2017.

Confidential and Proprietary Information
© Cathay Pacific Airways Limited and its subsidiaries                                                           4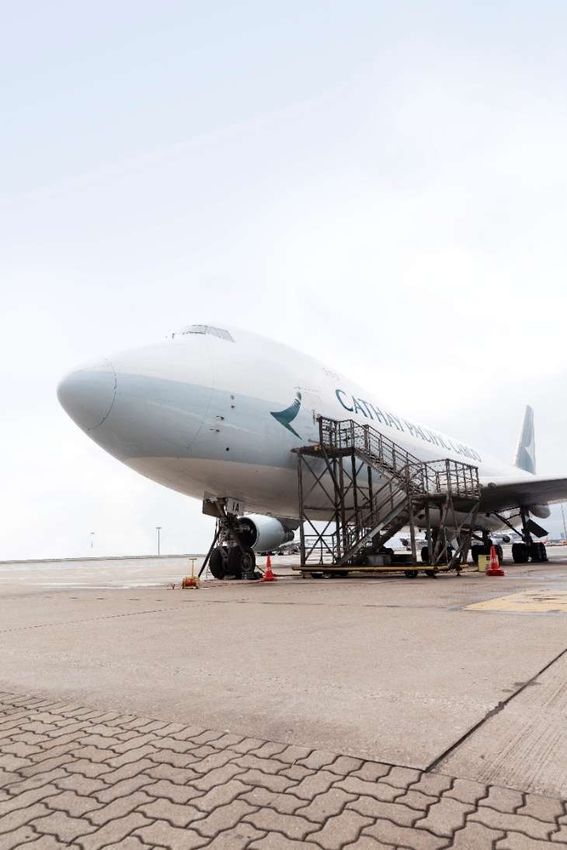
Positive revenue momentum despite headwinds; cost
pressures remain
                                                        •   Strong revenue growth across all categories
                                                            (Passenger, Cargo & Ancillary).
                                                        •   Transformation programme – focus on customer
                                                            service and revenue management in the
                                                            passenger business has resulted in yield
                                                            improvement.
                                                        •   Cargo continues recovery with positive momentum
                                                            in capacity, yield and load factor.
                                                        •   Operating costs increased due to higher fuel costs,
                                                            FX movements, a new accounting standard,
                                                            investment in fleet and customer-facing initiatives.
                                                        •   Satisfactory performance from subsidiaries.
                                                        •   Growth in Air China (reported 3 months in arrears)
                                                            offset by June 2018 FX losses in Air China Cargo
                                                            JV following RMB depreciation.
                                                        •   Stronger cash generation and debt reduction

Confidential and Proprietary Information
© Cathay Pacific Airways Limited and its subsidiaries                                                            5
Transformation delivering results

                                                                     Attributable Profit (HK$m)
      3,000

      2,000

      1,000

            -
                           H1 15                        H2 15         H1 16        H2 16          H1 17   H2 17   H1 18

    (1,000)

    (2,000)

    (3,000)

    (4,000)

                                                                Airlines      Subsidiaries & Associates

Confidential and Proprietary Information
© Cathay Pacific Airways Limited and its subsidiaries                                                                     6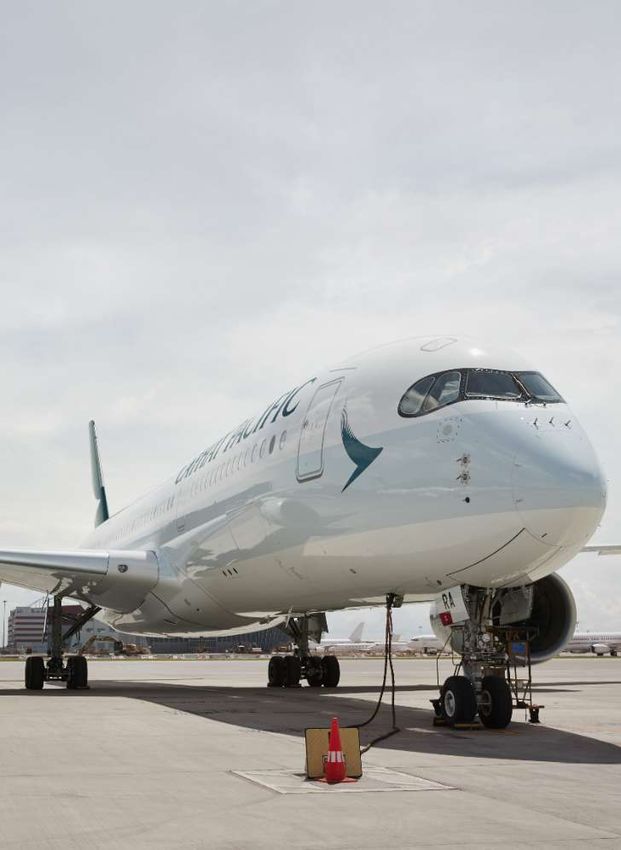
Financial & operating highlights

  Group Financial Statistics                                          1H2018             1H2017              Change
  Group Revenue                                             HK$m             53,078            45,858                +7,220
  Airlines’ loss after taxation                             HK$m              (904)            (2,765)               +1,861
  Group attributable profit/(loss)                          HK$m              (263)            (2,051)               +1,788
The company has declared a 1st interim dividend of HK$10 cents

  Operating Statistics
                                                                               1H2018          1H2017 Change
  – Cathay Pacific & Cathay Dragon
  Available tonne kilometres (ATK)                                 million            15,747       15,190            +3.7%
  Available seat kilometres (ASK)                                  million            75,770       73,444            +3.2%
  Available cargo & mail tonne kilometres (AFTK)                   million             8,542         8,206           +4.1%
  Passenger yield                                                   HK₵                 55.4          51.5           +7.6%
  Cargo and mail yield                                              HK$                 1.93          1.66       +16.3%
  Cost per ATK (with fuel)                                          HK$                 3.29          3.14           +4.8%
  Cost per ATK (without fuel)                                       HK$                 2.29          2.17           +5.5%
                                                                    HK$
  Underlying* cost per ATK (without fuel)                                               2.20          2.13           +3.3%
* Excludes exceptional items and is adjusted for the effect of foreign currency movements and adoption of HKFRS 15
Confidential and Proprietary Information
© Cathay Pacific Airways Limited and its subsidiaries                                                                         7
Strong revenue growth partially offset by cost pressures*

 4,000
                                                           1,467
                                                                                                Airline loss before tax
 3,000

                                         5,616
 2,000                                                              (1,037)        (98)
                                                                                              (213)
 1,000
HK$'m

                                                                                                           (1,311)           (188)
            0

                                                                                                                                          (1,014)
(1,000)
                                                                                                                                                        (210)         (743)

(2,000)

(3,000)

(4,000)             (3,755)

(5,000)
                    2017 airlines' Pax and Cargo Other revenue     Net fuel cost   Staff   Inflight service    Landing,      Aircraft    Owning the    Other items  2018 airlines'
                   loss (including   Revenue                                               and passenger parking and       maintenance    assets        (including loss (including
                      exceptional                                                             expenses      route expenses                            commissions)    exceptional
                    items) before                                                                                                                                   items) before
                          tax                                                                                                                                             tax

    * Reported costs (include exceptional items and before adjustment for year-on-year foreign currency movements and adoption of HKFRS15)
        Confidential and Proprietary Information
        © Cathay Pacific Airways Limited and its subsidiaries                                                                                                                 8
Operating performance
Passenger Services

Confidential and Proprietary Information
© Cathay Pacific Airways Limited and its subsidiaries

Traffic volume and yield growth despite intense
competition
                                                                                                     1H 2018   1H 2017   % Var

                                                            ASK                            Million    75,770    73,444    +3.2%

                                                            RPK                            Million    63,810    62,242    +2.5%
                                                            Revenue Passengers
                                                                                             '000     17,485    17,163    +1.9%
                                                            carried
                                                            Passenger load factor              %        84.2      84.7   -0.5%pt
                                                                                            HK$
                                                            Passenger revenue                         35,452    32,105   +10.4%
                                                                                           million

                                                            Passenger yield          HK cents           55.4      51.5   +7.6%*
                                                            Passenger Revenue
                                                                                     HK cents           46.8      43.7    +7.1%
                                                            per ASK
                                                        * +6.6% excluding IFRS15 impacts

                                                        •      Capacity growth reflects the introduction of five
                                                               new routes, increased frequencies on existing
                                                               routes and the use of larger aircraft on popular
                                                               routes.
                                                        •      Yield improvement reflects improvements in
                                                               revenue management, strong premium class
                                                               demand, favourable foreign currency movements
Confidential and Proprietary Information                       and increased revenue from fuel surcharges.
© Cathay Pacific Airways Limited and its subsidiaries                                                                            10
Passenger revenue and yield – continued recovery
Revenue – Yield –
HK$ million HK cents
40,000 57.0
55.0
53.0
30,000 51.0
49.0
47.0
20,000 45.0
1H 2016 2H 2016 1H 2017 2H 2017 1H 2018
Passenger revenue Passenger yield
Confidential and Proprietary Information
© Cathay Pacific Airways Limited and its subsidiaries 11Capacity growing and revenue efficiency strengthening
RASK –
Capacity - HK cents
ASKs
100,000 48.0
46.0
44.0
80,000
42.0
84.6% 84.0% 84.2%
84.5% 84.7% 40.0
60,000
38.0
36.0
40,000
34.0
32.0
20,000 30.0
1H16 2H16 1H17 2H17 1H18
Available seat kilometres (ASK) Load factor (as a proportion of ASK) Passenger revenue per ASK
Confidential and Proprietary Information
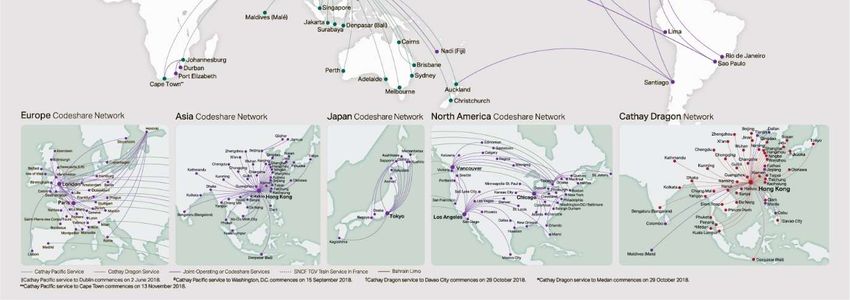
© Cathay Pacific Airways Limited and its subsidiaries 12New destinations and frequencies strengthen the
network
January • Introduced a four-times weekly service to Nanning
February • Announced new seasonal service to Cape Town
with three-times weekly in November
March • Introduced a four-times weekly service to Brussels
and Jinan
• Increased services to Tel Aviv from four to six times
weekly and Fukuoka from eleven to fourteen times
weekly, reintroduced Tokyo Haneda service
April • Announced new four-times weekly to Davao and
three-times weekly to Medan in October
• Barcelona service becomes year-round
May • Introduced a three-times weekly seasonal service to
Copenhagen
June • Introduced a four-times weekly service to Dublin
July • Announced new four-times weekly to Seattle in
March 2019
September • Introduction of a four-times weekly service to
Washington D.C.
October • Increased services to Tel Aviv from six times weekly
to daily and Adelaide from five to six times weekly
Confidential and Proprietary Information
© Cathay Pacific Airways Limited and its subsidiaries Cities in green are not directly served by any other airline from Hong Kong 13Capacity growth focused on Europe and SW Pacific; robust
load factors to the Americas
YTD June 2018 statistics (excluding HKFRS15 impact on yield)
Europe North Asia
ASK: +11.8% ASK: +1.6%
LF: -2.8%pts LF: +0.4%pt
Yield: +9.7% Yield: +7.4%
Southwest India, Middle
Pacific East, Sri
Lanka and
ASK: +6.2% South Africa
LF: -3.6%pts ASK: -0.2%
Yield: +3.0% LF: -1.9%pts
Yield: +11.5%
Southeast Americas
Asia
ASK: -1.6%
ASK: +2.7% LF: +2.4%pts
LF: -1.0%pts Yield: +4.2%
Yield: +9.0%
Planned 2H Planned 2018
Actual 1H
2018 ASK System wide ASK
2018 ASK:
+3.2%
+ growth = growth
Confidential and Proprietary Information
© Cathay Pacific Airways Limited and its subsidiaries
+ 5.4% +4.3% 14Customer investment - On the Ground
Asia Miles – more miles and more seats
• Enhancement of the Asia
Miles program announced in
June
• Customers will earn more
miles on flights and a 20%
increase in seat availability
for redemption
15
Disruption communications and self-service on mobile
• 4 new flight disruption
notification and self service
applications to be launched
(Disruption, Protection, Seat
change, Flight number
change)
• Passengers can choose to
accept protection and
booking will be confirmed
Confidential and Proprietary Information
© Cathay Pacific Airways Limited and its subsidiaries
and ready to go 15Customer investment - In the Air
New and more comfortable economy seats
• New economy class seats
to be installed on the 777
fleet
• Consistent and improved
passenger experience
across long haul aircraft
New business class long haul dining and service experience
• A la carte menu, plated
meals, more choices,
increased Hong Kong
signatures
• Breakfast card, healthy
options, express meals
• More crew interaction
Confidential and Proprietary Information
© Cathay Pacific Airways Limited and its subsidiaries 16Customer investment - Digital
Inflight connectivity on all Boeing 777s and A330s
• Already available on all
A350s
• Now installation of the Gogo
2KU system has started
• All Boeing 777 and A330
fleets to be equipped by
2020
New and improved online booking management
• New user interface for easy
and intuitive navigation
launched in May
• Enables more self-service
functions allowing more
choice and better
understanding
Confidential and Proprietary Information
© Cathay Pacific Airways Limited and its subsidiaries 17Operating performance Cargo Services Confidential and Proprietary Information © Cathay Pacific Airways Limited and its subsidiaries
Strong growth in tonnage, yield and revenue efficiency on
modest capacity increase
                                                                                                 1H 2018   1H 2017   % Var

                                                            Available cargo & mail
                                                                                       Million     8,542     8,206    +4.1%
                                                            Tonne Kilometres (AFTK)
                                                            Cargo and mail RFTK        Million     5,831     5,435    +7.3%
                                                                                          '000
                                                            Cargo & mail carried                   1,038       966    +7.5%
                                                                                       tonnes

                                                            Cargo & mail load factor       %        68.3      66.2   +2.1%pt
                                                                                        HK$
                                                            Cargo and mail revenue                11,276     9,007   +25.2%
                                                                                       million

                                                            Cargo and mail yield         HK$        1.93      1.66   +16.3%
                                                            Cargo and mail revenue
                                                                                         HK$        1.32      1.10   +20.0%
                                                            per AFTK

                                                        •      Capacity growth reflects good freighter and
                                                               passenger belly utilisation.
                                                        •      Load factor improving; HK and China stable whilst
                                                               rest of network strong.
                                                        •      Strong yield improvement.
                                                        •      Increased demand for specialist cargo shipments
                                                               and the movement of higher value goods to and
                                                               from Asia.
Confidential and Proprietary Information
© Cathay Pacific Airways Limited and its subsidiaries                                                                        19
Cargo revenue and yield – growth continues
Revenue –
Yield – H$
HK$ million
14,000 1.9
12,000 1.7
10,000 1.5
8,000 1.3
6,000 1.1
4,000 0.9
2,000 0.7
0 0.5
1H16 2H16 1H17 2H17 1H18
Cargo and mail revenue Cargo and mail yield
Confidential and Proprietary Information
© Cathay Pacific Airways Limited and its subsidiaries 20Load factor; continuous improvement
Year to June Load Factor
2017 : 66.2%
2018 : 68.3%
75%
73%
71%
69%
67%
65%
63%
61%
59%
57%
55%
Jan Feb Mar Apr May Jun Jul Aug Sep Oct Nov Dec
2013-2017 average 2017 2018
Confidential and Proprietary Information
© Cathay Pacific Airways Limited and its subsidiaries 21Capacity, load factor and revenue efficiency growth
Capacity - Cargo Revenue
AFTKs per AFTK – HK$
12,000 1.4
1.2
10,000
1.0
8,000
69.2% 0.8
6,000 66.5% 68.3%
66.2%
62.2% 0.6
4,000
0.4
2,000
0.2
0 0.0
1H16 2H16 1H17 2H17 1H18
Available cargo and mail tonne kilometres (AFTK) Load factor (as a proportion of AFTK)
Cargo Revenue per AFTK
Confidential and Proprietary Information
© Cathay Pacific Airways Limited and its subsidiaries 22Operating performance Operating costs Confidential and Proprietary Information © Cathay Pacific Airways Limited and its subsidiaries
Increased external pressure on underlying operating costs
per ATK (with and without fuel)

                                                        •   Significant increase in fuel price, partially offset
                                                            by smaller hedging losses

                                                        •   Higher depreciation and finance charges on
                                                            investment in new fleet (to be fully leveraged in
                                                            2H18), partially offset by efficiencies in fuel
                                                            consumption

                                                        •   Increase in route-related expenses on higher
                                                            navigation, overflying and landing & parking
                                                            charges

                                                        •   Accelerated investment in customer experience

Confidential and Proprietary Information
© Cathay Pacific Airways Limited and its subsidiaries                                                              24
Operating cost - breakdown
5%
2%
5%
Fuel, including hedging losses
30% Staff costs
9%
Landing, parking and route
expenses
Aircraft depreciation and
operating leases
Aircraft maintenance
14% Inflight service and passenger
expenses
Net finance charges
Others
19%
16%
Confidential and Proprietary Information
© Cathay Pacific Airways Limited and its subsidiaries 25Average into-plane fuel prices rose 27.9% year on year;
Brent rising and crack spread widening
USD/BBL
100.00
90.00
CX Jet Cost and Calculated CX Brent Price
80.00
70.00
60.00
50.00
40.00
30.00
20.00
Aug/16
Sep/16
Nov/16
Dec/16
Aug/17
Sep/17
Nov/17
Dec/17
Jan/16
Feb/16
Mar/16
Apr/16
May/16
Jun/16
Jul/16
Oct/16
Jan/17
Feb/17
Mar/17
Apr/17
May/17
Jun/17
Jul/17
Oct/17
Jan/18
Feb/18
Mar/18
Apr/18
May/18
Jun/18
Jet Actual Cost Calculated CX Brent Price Brent Daily Spot
Fuel costs and KPI’s 1H 2018 1H 2017 % Var
Group gross fuel cost (HK$m) 15,393 11,700 31.6%
Group fuel hedging losses (HK$m) 653 3,237 -79.8%
Group fuel cost (HK$m) 16,046 14,937 7.4%
Average calculated Airlines Brent price (US$/bbl) $70.5 $54.1 30.4%
Average into-plane fuel price ex hedges (US$/bbl) $88.0 $68.8 27.9%
Airlines Fuel consumption per mRTK (bbl) 1,840 1,888 -2.5%
Confidential and Proprietary Information
© Cathay Pacific Airways Limited and its subsidiaries 26Forward fuel hedging position
Fuel hedging coverage - CFH reserve at June 2018 a credit of HK$846m
Fuel hedging Average strike price
Period
cover (Brent, USD/Bbl)
3rd Quarter 2018 45.1% 80.41
4th Quarter 2018 45.2% 80.58
1st Quarter 2019 31.0% 67.84
2nd Quarter 2019 29.5% 69.68
3rd Quarter 2019 31.7% 60.58
4th Quarter 2019 25.4% 61.76
1st Quarter 2020 17.6% 63.50
2nd Quarter 2020 7.2% 67.18
3rd Quarter 2020 0.3% 68.66
Confidential and Proprietary Information
© Cathay Pacific Airways Limited and its subsidiaries 27Underlying costs per ATK (ex fuel) up 3.3%
As reported (HK$M): 2018 2017 % Var
Staff 8,834 8,736 +1.1%
Inflight service and passenger expenses 2,625 2,412 +8.8%
Landing, parking and route expenses 8,472 7,161 +18.3%
Aircraft maintenance 4,490 4,302 +4.4%
Depreciation, amortisation and operating leases 7,257 6,446 +12.6%
Net finance charges 896 693 +29.3%
Others (including commissions) 3,459 3,249 +6.5%
Total operating costs (without fuel) 36,033 32,999 +9.2%
Cost per ATK (without fuel) 2.29 2.17 +5.5%
Underlying * cost per ATK (without fuel) 2.20 2.13 +3.3%
* Underlying costs exclude exceptional items and are adjusted for the effect of foreign currency movements and
adoption of HKFRS 15. Exceptional items include a HK$101 million gain on the disposal of CO2 emissions credits
(2017: provisions for a European Commission airfreight fine of Euros 57.12 million (equivalent to approximately
HK$498 million) and redundancy costs of HK$224 million for the re-organisation of our head office).
Confidential and Proprietary Information
© Cathay Pacific Airways Limited and its subsidiaries 28Net benefits of a weaker US$ in the early part of the
period have partially unwound (DXY Index)
A weaker US$ has a beneficial impact on our revenues, but an adverse impact on cost
c10% weaker Q1 YOY, strengthening Q2 2018
Confidential and Proprietary Information
© Cathay Pacific Airways Limited and its subsidiaries 29Airlines constant base adjustments
Reported Constant
HK$ millions 2018 Exceptional HKFRS15 Currency base 2018
Passenger & cargo services 46,728 (375) (793) 45,560
Catering, recoveries and other services 4,299 (613) (19) 3,667
Total revenue 51,027 - (988) (812) 49,227
- -
Staff (8,834) 31 (8,803)
Inflight service and passenger expenses (2,625) (12) 16 (2,621)
Landing, parking and route expenses (8,472) 761 154 (7,557)
Fuel, including hedging losses (15,737) 2 (15,735)
Aircraft maintenance (4,490) 6 (4,484)
Owning the assets (8,153) 24 (8,129)
Others (including commissions) (3,459) (101) 239 304 (3,017)
Total operating expenses (51,770) (101) 988 537 (50,346)
Airlines profit before taxation (743) (101) - (275) (1,119)
The exceptional item represents a HK$101 million gain on the disposal of EU CO2 emissions credits
Confidential and Proprietary Information
© Cathay Pacific Airways Limited and its subsidiaries 30Underlying cost per ATK without fuel (before exceptional
items) movement
HK$c
229.5
3.40
219.8
6.27
1.05
HK$c
212.5
0.15 4.62
0.85
0.13 0.77
3.3% increase
2017 Actual Staff Inflight Landing, Aircraft Owning the Others 2018 Actual Impact of Impact of 2018 Actual
service and parking and maintenance assets (including (constant HKFRS 15 currency
passenger route commissions) base) movements
expenses expenses
Confidential and Proprietary Information
© Cathay Pacific Airways Limited and its subsidiaries 31Operating performance Subsidiaries and Associates Confidential and Proprietary Information © Cathay Pacific Airways Limited and its subsidiaries
Major subsidiaries

               –        Performance remains steady
               –        Fleet modernisation
               –        At the end of 2018, CX will acquire the remaining 40% shareholding in Air Hong
                        Kong to become a wholly owned subsidiary

               –        Increase in material and staff costs more than offset an increase in revenue

               –        Membership exceeds ten million worldwide, increased business volume YOY

               –        3% increase in tonnage handled. Results impacted by higher volume of transit
                        cargo and increased cost pressures

Confidential and Proprietary Information
© Cathay Pacific Airways Limited and its subsidiaries                                                  33
Associates
– Cathay Pacific has 18.13% interest in Air China
– Our share of Air China’s results is based on its financial statements drawn up
three months in arrears
– Contribution from the share of profits higher than the same period in 2017
– Traffic and revenue growth for both passenger and cargo, together with the
benefits of a stronger RMB through the first quarter of 2018. This was partly
offset by rising fuel costs
– Contribution from the share of profits lower than the same period in 2017
– Favourable operating result with an improved cargo yield, despite higher fuel
costs
– Unrealised exchange losses on USD denominated loan and lease obligations
more than offset the improved operating result
34
Confidential and Proprietary Information
© Cathay Pacific Airways Limited and its subsidiariesOperating performance Other financials Confidential and Proprietary Information © Cathay Pacific Airways Limited and its subsidiaries
Strong group cash flow; capital employed steady and
gearing reducing
                                                                        30 Jun 2018 30 Jun 2017
  Cash Flow                                                                                          % Var
                                                                           HK$M        HK$M
  Net cash inflows from operating activities                                       8,493     2,786   +204.8%

  Net cash outflows from investing activities*                                   (3,769)   (7,093)    -46.9%

  Net cash inflow/(outflow) pre financing                                          4,724   (4,307)        n/a

  Net (out)/in flows from financing activities                                   (8,486)     1,037        n/a
  * Excluding movement in other liquid funds (non-cash & non-cash equivalents)

                                                                        30 Jun 2018 31 Dec 2017
  Balance Sheet                                                                                      % Var
                                                                           HK$M        HK$M
  Shareholders’ Funds                                                             65,056    61,101      6.5%

  Net Borrowings                                                                  55,272    59,300      -6.8%
  Capital Employed (including non-controlling
                                                                                 120,507   120,572      -0.1%
  interests)

  Net Debt/Equity Ratio                                                             0.85      0.97 -0.12 times
Confidential and Proprietary Information
© Cathay Pacific Airways Limited and its subsidiaries                                                        36
1H Group profit/(loss) and net debt/equity ratio 10 year
comparison
8,000 1.20
7,000
6,000 1.00
5,000
Profit/(loss) (HK$'m)
D/E ratio (Times)
0.80
4,000
3,000
0.60
2,000
1,000
0.40
0
(1,000) 0.20
(2,000)
(3,000) 0.00
1H09 1H10 1H11 1H12 1H13 1H14 1H15 1H16 1H17 1H18
Profit/(Loss) Net debt/equity ratio
Group Profit 1H 1H 1H 1H 1H 1H 1H 1H 1H 1H
Margin 2009 2010 2011 2012 2013 2014 2015 2016 2017 2018
% 2.6 16.5 6.0 (1.9) 0.1 0.7 3.9 0.8 (4.5) (0.5)
Confidential and Proprietary Information
© Cathay Pacific Airways Limited and its subsidiaries 37Fleet Profile Confidential and Proprietary Information © Cathay Pacific Airways Limited and its subsidiaries
CX & KA Fleet profile as at 30 June 2018

           Aircraft type                                        Finance   Operating
                                                        Owned                          Total
           Includes parked aircraft                             Leased     Leased
           A320-200                                       5         -        10          15
           A321-200                                       2         -         6           8
           A330-300                                      30        11        17          58
           A350-900                                      16         4         2          22
           A350-1000                                      1         -         -           1
           747-400BCF                                     -         -         1           1
           747-400ERF                                     -         6         -           6
           747-8F                                         3        11         -          14
           777-200                                        5         -         -           5
           777-300                                       12         -         -          12
           777-300ER                                     19        11        23          53
           Total                                         93        43        59         195

• Fleet simplification
           •        Simplifying the number of sub-fleets will reduce cost and reduce the complexity in
                    our deployment.

Confidential and Proprietary Information
© Cathay Pacific Airways Limited and its subsidiaries                                                39
Continued investment in more fuel-efficient fleet
providing enhanced customer experience
• New modern aircraft deliveries.
• 22 A350-900 aircraft are in service
• Our first A350-1000 was delivered in June and a second aircraft delivered in July.
We expect to receive six more deliveries by the end of 2018
• Retirement of older fleet types.
• Three A330-300 aircraft were returned up to June 2018
In operation Passenger Freighter Total
1 January 2018 176 20 196
New deliveries 1 - 1
Returned from AHK - 1 1
Returned to lessors (3) - (3)
30 June 2018 174 21 195
Confidential and Proprietary Information
© Cathay Pacific Airways Limited and its subsidiaries 40Fuel efficient forward deliveries
Scheduled new aircraft deliveries as at 30 June 2018
Aircraft type 2018 2019 2020 >2021 Total
A321NEO 9 23 32
A350-900 2 4 6
A350-1000 7* 4 3 5 19
777-9X 21 21
Total 7* 6 16 49 78
* The second of the A350-1000s for 2018 was delivered in July
Confidential and Proprietary Information
© Cathay Pacific Airways Limited and its subsidiaries 41Transformation Update Confidential and Proprietary Information © Cathay Pacific Airways Limited and its subsidiaries
Growth-led transformation: the context

                                Market context                        Economic context

 Structural challenges continue                         Positive global economy but uncertainty
 • Capacity is growing to our key markets               increasing
 • Direct flights are increasing                        • US$ strengthening, revenue pressure
 • Competition is improving                             • Greater geopolitical and trade uncertainty,
 • Customer expectations are evolving                     impact on corporate & consumer sentiment
                                                        • HK$ strengthening

Confidential and Proprietary Information
© Cathay Pacific Airways Limited and its subsidiaries                                                   43
Progress in first half of 2018, building on strategic foundations
laid in 2017…
Organisation change Digital Capability Customer wins
• New HQ organisation fully • Rapid experimentation – 80+ • Enhanced Asia Miles program -
embedded & greater synergies proof of concepts undertaken 20% increase in redemption
realised between KA / CX • AML Blockchain POC to seat availability
• Outports and subsidiaries improve customer experience • Disruption Management from
restructuring underway from • 24 Core Digital Capabilities now Customer Mobile
mid-2018 prioritised and being delivered, • Enhanced Online Booking
• Centers of excellence driving e.g. Phase 2 of Integrated Management
expertise and efficiency Operational Datahub & • Dining and service
• Subsidiaries management partnership with AWS to enhancements in Long Haul
restructuring implement machine learning Business Class
Confidential and Proprietary Information
© Cathay Pacific Airways Limited and its subsidiaries 44….with marked progress being realised across the strategic
pillars…
Customer Centric Operational Excellence High Performance
• Record-breaking network • Global Contact Centers • “Serve to Lead”: front line
expansion continues fueled by overhaul underway (July 2018) experience for Senior Leaders
new aircraft such as A350-1000 • New crew rostering system • Revamped service delivery
• In-flight connectivity across • Operational review commencing training
A350, A330 & Boeing 777 fleet • Line Maintenance productivity • Modernised approach to
• More comfortable Economy drive outside of Hong Kong Employee Reward
seats • 605 Lean practioners trained so
• Enhancements to Social far
Customer Care team
Confidential and Proprietary Information
© Cathay Pacific Airways Limited and its subsidiaries 45…and drive towards continuous improvement
Productivity and Value Management
End-to-end process re-design
Process Transformation Digital / Lean Global Business Service
• Commitment to transform our 9 • 2,100 Lean practioners (yellow • GBS team established Q4 2017
core processes belt +) and now has >70 people
• 6 are already underway with the • Digital and analytical capability • As processes are redesigned,
rest to start by Q1 ’19 being invested in transactional tasks will shift to
• Will provide the platform to • Robotic process automation GBS
drive digitization and apply new removes repetitive tasks, • 20% reduction in employee cost
technologies to our business reducing costs and errors realised to date
Confidential and Proprietary Information
© Cathay Pacific Airways Limited and its subsidiaries 46Outlook Confidential and Proprietary Information © Cathay Pacific Airways Limited and its subsidiaries
Outlook
                                                        •     The overall business environment is expected to remain
                                                              challenging with the strength of the US dollar and the
                                                              uncertainty arising from global trade concerns.

                                                        •     Passenger business will continue to be affected by intense
                                                              competition, particularly in the back-end.

                                                        •     Higher fuel costs will adversely affect results, but our
                                                              hedging losses will reduce.

                                                        •     Operational challenges and constraints will continue to
                                                              impose costs on the Group.

                                                        But

                                                        •     We expect the airlines to perform better in the second half of
                                                              the year than the first half.

                                                        •     Passenger yields expected to continue to improve and the
                                                              cargo business is expected to remain strong.

                                                        •     Our new fleet improves the customer experience, provides
                                                              network optionality and reduces our fuel consumption.

                                                        •     Transfomation programme remains on target to take us back
                                                              to achieving sustainable long-term performance for our
Confidential and Proprietary Information
                                                              airline business and position us for future growth.
© Cathay Pacific Airways Limited and its subsidiaries                                                                      48
Q&A For more information, please visit our website www.cathaypacific.com Confidential and Proprietary Information © Cathay Pacific Airways Limited and its subsidiaries
HKFRS 9 & 15

IFRS 9

•       IFRS9 changes the treatment and categorisation of financial assets
        previously classified as “available for sale’ with fair value gains and losses
        recognised through OCI (recycled to P&L on disposal). Under IFRS9, equity
        investments are classified as fair value through P&L, unless an irrevocable
        election on initial recognition is made for OCI (with no recycling).

IFRS15

•       IFRS15 impacts the timing of revenue recognition and the presentation of
        revenue.
           –        Timing: Brings forward the recognition of ticket breakage revenue according to the pattern of
                    rights exercised by the customer
           –        Presentation:
                       •        Gross up of revenue where we are deemed as the principal rather than agent
                       •        Alignment of revenue presentation with the underlying performance obligations

Confidential and Proprietary Information
© Cathay Pacific Airways Limited and its subsidiaries                                                           51
Impact of adoption of HKFRS 9 & 15
Opening retained profit reserve
• IFRS15: +HK$631 million on advance recognition of ticket breakage from unearned
transportation revenue under HKFRS 15 (Airlines and Air China, net of tax)
• IFRS9: +HK$725 million net transfer from investment revaluation reserves upon
classification of equity investments at fair value through P&L vs OCI under HKFRS 9
(Airlines and Air China)
In year profit or loss account reclassifications (IFRS15)
• +HK$761 million cargo handling revenue gross up and HK$239 million freightage
revenue gross up (both to other revenue)
• HK$350 million and HK$37 million flight related ancillary income reclassified from
other revenue to passenger services and cargo services respectively which are not
considered distinct from the travel or carriage component
Confidential and Proprietary Information
© Cathay Pacific Airways Limited and its subsidiaries 520
20
40
60
80
100
120
140
160
180
200
1/1/2008
4/1/2008
7/1/2008
10/1/2008
1/1/2009
4/1/2009
7/1/2009
Confidential and Proprietary Information
Brent prices
10/1/2009
1/1/2010
4/1/2010
© Cathay Pacific Airways Limited and its subsidiaries
7/1/2010
10/1/2010
1/1/2011
4/1/2011
7/1/2011
10/1/2011
1/1/2012
4/1/2012
7/1/2012
10/1/2012
1/1/2013
4/1/2013
7/1/2013
10/1/2013
1/1/2014
4/1/2014
7/1/2014
10/1/2014
1/1/2015
4/1/2015
7/1/2015
10/1/2015
1/1/2016
4/1/2016
7/1/2016
10/1/2016
1/1/2017
4/1/2017
USD/BBL - Brent - Daily Closing Price and 250 Day Simple Moving Average 2008 - 2018
7/1/2017
Brent
10/1/2017
1/1/2018
4/1/2018
Bent 250d SMA
7/1/2018
53You can also read