Acquisition of OneWest - Creating a Commercial Bank for the Middle Market July 22, 2014

Page created by Patricia Chapman
 
CONTINUE READING
Acquisition of OneWest - Creating a Commercial Bank for the Middle Market July 22, 2014
Acquisition of OneWest
Creating a Commercial Bank for the Middle Market

July 22, 2014

                                       0
Acquisition of OneWest - Creating a Commercial Bank for the Middle Market July 22, 2014
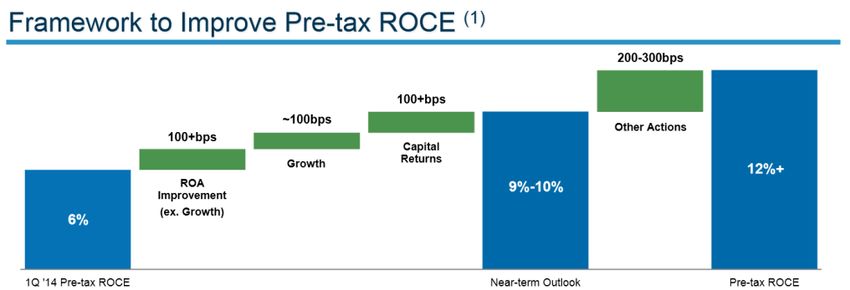
Forward Looking Statements

This presentation contains forward-looking statements within the meaning of applicable federal securities laws with respect to the planned acquisition of IMB Holdco LLC
and its subsidiaries (“OneWest”), OneWest’s future performance, the expected costs be incurred in connection with the acquisition, integration with CIT Group Inc.
(“CIT”), and the impact of the transaction of CIT’s future performance.

Forward-looking statements are based upon our current expectations and assumptions concerning future events, which are subject to a number of risks and
uncertainties that could cause actual results to differ materially from those anticipated. The words “expect,” “anticipate,” “estimate,” “forecast,” “initiative,” “objective,”
“plan,” “goal,” “project,” “outlook,” “priorities,” “target,” “intend,” “evaluate,” “pursue,” “commence,” “seek,” “may,” “would,” “could,” “should,” “believe,” “potential,”
“continue,” or the negative of any of those words or similar expressions is intended to identify forward-looking statements. All statements contained in this presentation,
other than statements of historical fact, including without limitation, statements about our plans, strategies, prospects and expectations regarding future events and our
financial performance, are forward-looking statements that involve certain risks and uncertainties. While these statements represent our current judgment on what the
future may hold, and we believe these judgments are reasonable, these statements are not guarantees of any events or financial results, and our actual results may
differ materially.

In addition, forward-looking statements in this presentation are subject to certain risks and uncertainties related both to the acquisition transaction itself and to the
integration of the acquired business with CIT after closing, including the possibility that regulatory and other approvals and conditions to the transaction are not received
or satisfied on a timely basis or at all or are obtained subject to conditions that are not anticipated; the possibility that modifications to the terms of the transaction may be
required in order to obtain or satisfy such approvals or conditions or that such approvals are obtained subject to conditions that are not anticipated; changes in the
anticipated timing for closing the transaction; difficulty and delays in integrating OneWest with CIT or fully realizing projected cost savings and other projected benefits of
the transaction; business disruption during the pendency of or following the transaction; the inability to sustain revenue and earnings growth; changes in general
economic conditions, including changes in interest rates and capital markets; changes in law or regulations, diversion of management time on transaction-related issues;
reputational risks and the reaction of customers and counterparties to the transaction; and changes in asset quality and risk as a result of the transaction.

Annualized, pro forma, projected and estimated numbers are used for illustrative purposes only, are not forecasts and may not reflect actual results.

We describe other risks that are applicable to our businesses generally that could affect our results in Item 1A, “Risk Factors,” of our latest Annual Report on Form 10-K
for the year ended December 31, 2013, which was filed with the Securities and Exchange Commission. Accordingly, you should not place undue reliance on the
forward-looking statements contained in this presentation. These forward-looking statements speak only as of the date on which the statements were made. CIT
undertakes no obligation to update publicly or otherwise revise any forward-looking statements, except where expressly required by law.

For additional information, please see CIT’s Form 8-K filed with the SEC on July 22, 2014.

Totals may not foot due to rounding.

                                                                                        1
Acquisition of OneWest: Delivering On Our Strategic Agenda

                    Creates a Commercial Bank With $67 Billion in Assets

                    •   CIT Bank more than doubles in size to $41 billion in assets and $28 billion in deposits
Advances Our        •   73 branches in Los Angeles and Southern CA, one of the country’s most attractive banking markets
Bank Strategy       •   Adds $15 billion of deposits, including over $2 billion of commercial deposits
                    •   Reduces CIT’s cost of deposits from 1.6% to ~1.2% and overall cost of funds from 3.3% to ~2.4%

                    • OneWest’s west coast-focused middle market and specialty lending businesses are attractive
Complements Our         strategic additions to CIT’s North American Commercial Finance segment
Commercial
                    • OneWest's deposit and payment solutions will enable CIT to serve its existing clients’ cash
Finance Franchise       management needs

                    • CIT deploys more than $1 billion of excess capital, inclusive of $500 million of additional share
Accelerates             repurchase, resulting in a Tier 1 Common ratio between 12.5% and 13.0% at close
Realization of
                    • OneWest's operating profitability accelerates the rate at which CIT can utilize its NOL, benefiting
Embedded Value          cash taxes and regulatory capital, and increasing the present value of the NOL by $300–400 million

                    •   ~20% accretive to earnings per share in 2016
Financially         •   ~12–13% pre-tax return on tangible common equity
Compelling          •   ~8% tangible book value per share dilution with approximately four-year earnback
                    •   ~15% IRR

                                                          2
Transaction Summary

                                                                                                                                                                     Pro Forma

 Assets ($ billions)¹                                                                      $44                                       $23                                      $673
 Deposits ($ billions)¹                                                                    $14                                       $15                                      $283
 Net Income ($ millions)²                                                                $643                                       $243                                   ~$8704
 Branches                                                                                      0                                       73                                       73.
                                         • CIT will acquire 100% of OneWest for $2.0 billion in cash and 31.3 million CIT shares
 Consideration                           • 59% cash / 41% stock
                                         • $3.4 billion transaction value5
                                         • CIT's Board has authorized an additional $500 million share repurchase to be executed through 6/30/15
 Capital Distribution
                                         • Going forward, CIT is targeting a dividend and total payout ratio in line with bank peers
 Ownership                               • 85% CIT, 15% OneWest
 Additions to Senior                     • Steven Mnuchin will join CIT as Vice Chairman
 Management                              • Joseph Otting will become President & CEO of CIT Bank, and with Nelson Chai, Co-President of CIT
                                         • Steven Mnuchin and OneWest Independent Director Alan Frank will join CIT's board, increasing its size
 Board of Directors
                                            from 13 to 15 members
                                         • CIT Bank will merge into OneWest Bank, which will remain an OCC-regulated national bank
 CIT Bank
                                            headquartered in California, and be renamed CIT Bank

 Timing                                  • First half of 2015, subject to regulatory approvals
¹ Unaudited GAAP financial data of CIT and OneWest as of June 30, 2014, unless otherwise noted
² “Net Income” represents mean of published 2016 analyst pre-tax income estimates adjusted to reflect a 30% GAAP effective tax rate (for CIT) and Net Income before Extraordinary Items
  & Adjustments in 2013 Call Report (for OneWest); see Appendix page 22 for calculation
³ Pro forma represents the sum of the CIT and OneWest data is not reflective of any purchase accounting marks or merger adjustments; numbers may not tie due to rounding
4 Combined Net Income reflects impact of planned share repurchase, cost synergies, cash consideration funding and other adjustments; see Appendix for additional detail
5 Based on CIT stock price of $44.33

                                                                                           3
Combination
    With OneWest

4
OneWest is a Leading Los Angeles Based Bank

 Franchise Highlights                                                                          73 Branches in Southern California
                                                                                                             This map is saved in Dealworks folder 1601736-002
 Founded                           2009
 Branches                          73 (63 in Los Angeles MSA, all in CA)
 Employees¹                        2,160
                                                                                               Ventura                                             California
 2013 Earnings²                    $243 million                                                                     Pasadena
 Assets                            $23 billion                                                    Oxnard
                                                                                                                                       Los Angeles
 Loans
 Total                             $14 billion
  Legacy                           $8 billion (87% FDIC-covered)                                                                                           Palm Desert
  Commercial                       $5 billion
  Other                            $1 billion
 Cash                              $5 billion
 Investment Securities             $1 billion
                                                                                                                                                        Escondido
 Deposits                          $15 billion (0.77% cost)                                                                    Rancho Santa
                                                                                                                               Rancho Santa Fe
                                                                                                                                            Fe

 Other Funding                     $4 billion in FHLB advances
                                                                                                                                        La Jolla
                                                                                                    OneWest Branches (73)
                                                                                                                                                     San Diego
                                   $2.8 billion of tangible common equity                           Cities
 Capital
                                   12.5% TCE/TA3                                                    Los Angeles MSA

Source: Unaudited GAAP financial data of OneWest as of June 30, 2014, unless otherwise noted
1 Full time equivalent employee count
2 Net Income before Extraordinary Items & Adjustments in 2013 Call Report
3 Tangible Common Equity / Tangible Assets

                                                                                        5
Los Angeles is One of the Country's Most Attractive Banking Markets

 Los Angeles Deposit Market Share of LA-Based Banks¹

 $ billions
       $18.2
                        $13.3           $12.4
                                                          $7.1
                                                                           $4.8        $3.8         $3.3        $3.0       $2.3      $2.3

   City National OneWest              East West        PacWest            Cathay       F&M          BBCN     Banc of CA   Wilshire   Hanmi

 Top MSAs by Gross Deposit Growth, ‘03–13                                              Top MSAs by Deposits

 $ billions                                                                            $ billions
       $212                                                                                 $558

                      $103                                                                            $281
                                       $63                                                                        $206
                                                      $60            $59                                                    $141     $127

       NYC              LA          Chicago          Miami          Dallas                    NYC      LA       Chicago     Miami    Phila

     Los Angeles MSA has the second highest number of middle-market firms in the U.S., after NYC
Source: SNL Financial
Note: Summary of Deposits data as of June 30, 2013
¹ Deposits in Los Angeles MSA of banks headquartered in Los Angeles MSA
                                                                                   6
OneWest’s Commercial Banking Platform Has Experienced Strong Growth

    • OneWest has grown into a leading “hometown bank” in the attractive Los Angeles market through disciplined, opportunistic
       acquisitions and consistent organic growth
    • Attracted senior executives and origination professionals from some of the country’s leading banks, who have worked together to
       grow the commercial lending and real estate franchise
    • Invested significantly in a full suite of branch banking and commercial products and services including wholesale lending businesses,
       numerous deposit products, and cash management services
    • OneWest’s Organic non-CD Commercial Deposits² had an average cost of 0.27% in H1 2014

    Organic Commercial Loans1                                                             Organic Commercial Deposits3

    $ billions                                                          $4.5              $ billions
                                                                 $4.2
                              103% CAGR                  $3.8                                                       38% CAGR                    $2.3
                                                 $3.2                                                                                    $1.8
                                          $2.8                                                                            $1.6 $1.7 $1.6
                           $2.2 $2.4                                                                     $1.3 $1.4 $1.5
                    $1.8                                                                       $1.1 $1.1
             $1.4
      $0.9

      Q1     Q2     Q3     Q4      Q1      Q2     Q3      Q4     Q1      Q2                    Q1   Q2    Q3   Q4    Q1   Q2   Q3   Q4   Q1     Q2
                 2012                        2013                   2014                               2012                 2013           2014
1 Includes Commercial & Industrial and Commercial Real Estate loans originated by OneWest
2 Reflects YTD average cost of non-CD Commercial Checking and Business Money Market accounts
³ Includes commercial checking accounts, money market accounts and CDs

                                                                                    7
CIT Will Be Majority Deposit Funded

 CIT                                                           OneWest                                                      Pro Forma

 Total Funding

        Secured debt                                                        FHLB                                                             FHLB
           17%                                                              22%                                                               8%
                                                                                                                               Secured
                                                                                                                                debt
                                                                                                                                11%

   Unsecured                            Deposits                                                       Deposits               Unsecured                        Deposits
     debt                                44%                                                            78%                     debt                            57%
     39%                                                                                                                        24%

      Total: $31 billion / Cost of Funds: 3.3%                      Total: $19 billion / Cost of Funds: 0.8%                    Total: $50 billion / Cost of Funds: ~2.4%

 Deposits

                  Other                                                    Online    Other                                                   Other   Commercial
                                                                                      5%        Commercial                                    6%        8%
                   7%                                                       2%
                                                                                                  16%

                                                                                                                              Brokered
                                         Online                                                                                 19%                            Branch
      Brokered
                                          54%                                                                                                                   40%
        39%                                                                                           Branch
                                                                                                       77%                          Online
                                                                                                                                     27%
     Total: $14 billion / Cost of Deposits: 1.6%                  Total: $15 billion / Cost of Deposits: 0.8%                 Total: $28 billion / Cost of Deposits: ~1.2%
Source: Unaudited GAAP financial data of CIT and OneWest as of June 30, 2014
Note: Pro Forma column represents the sum of the CIT and OneWest data and is not reflective of any purchase accounting marks or merger adjustments

                                                                                         8
More Than Half of CIT's Total Assets Will Be in CIT Bank

 CIT                                                           OneWest                                                      Pro Forma

 Total Assets

                                                                       Non-Bank
                                            Bank
Complementary Commercial Franchises

                                   North American
                                  Commercial Finance
                            Corporate Finance              $7.3 billion                                           Commercial Lending
                            Commercial Real Estate          1.7 billion                                           Middle Market        $2.9 billion
                            Equipment Finance               4.3 billion
                                                                                                                  Commercial RE         1.6 billion
                            Commercial Services             2.3 billion

                                     CIT will be able to                                                     Cash Management Services
                                     serve its existing
                                                                                                               $2.3 billion of Commercial Deposits
                                       clients’ cash
                                    management needs                                                                     Deposit Services
                                                                                                                        Payment Solutions

 Combined Industry Expertise

             Aerospace & Defense ▪ Apparel & Footwear ▪ Business Services ▪ Communications & Technology ▪ Consumer Products
                   Energy ▪ Entertainment ▪ Furniture & Home Furnishings ▪ Gaming ▪ Healthcare ▪ Industrials ▪ Office Imaging
                Power ▪ Private Equity ▪ Refactoring ▪ Restaurants ▪ Retail ▪ Sports & Media ▪ Textiles ▪ Transportation & Logistics

Note: Items in bold indicates industries in which OneWest has dedicated Specialty Lending teams; OneWest Commercial Lending portfolio includes only loans originated by OneWest

                                                                                         10
OneWest’s Legacy Portfolio is a Low-Risk Earnings Source

  • $9 billion portfolio yielding ~5%
  • Acquired through four transactions in 2009 and 2010, three of which were FDIC-assisted
  • Substantially all loans were originally covered by loss share agreements
  • Retention of FDIC loss shares agreements is a condition of closing

 Portfolio Largely Covered by Loss Share                                         Ongoing Loan Portfolio Transformation

                                                                                     Legacy Loan Portfolio      Originated Loan Portfolio
               Reverse                             Covered Loan Portfolio
              mortgages²
                                                                                   1%     1%
              $1bn / 10%                           ~67% of overall                                7%
                                                                                                             18%
          MBS                                      Legacy Portfolio                                                 33%      40%
       $1bn / 13%                                  expected to have                                                                  ~65%
                                                   associated loss shares
        CRE, C&I                                                                   99%   99%
        and Other      Single family               at closing²                                    93%
                        residential²
                                                                                                             82%
       $2bn / 20%                                                                                                   67%
                       $5bn / 57%                  Loss share through                                                        60%
                                                   2019–2020                                                                         ~35%

            Total: $9 billion¹                                                    2009   2010    2011        2012   2013 Q2 2014 2016E

Source: Unaudited GAAP financial data of OneWest
Note: Financial data as of June 30, 2014
¹ Excludes $1 billion indemnification asset
² Loss share agreements expire in 2019–2020

                                                                            11
Proven Management Team With Deep Experience

                                                                John Thain
                                                             Chairman and Chief
                                                              Executive Officer

             Steven Mnuchin                     Nelson Chai                      Joseph Otting                         Jeff Knittel
            Vice Chairman of CIT              Co-President of CIT                Co-President of CIT                     President of
            Member of CIT’s Board               President of NA                 CEO and President of                 Transportation and
            Chairman of CIT Bank              Commercial Finance                     CIT Bank                       International Finance

Andrew Brandman              Robert Ingato                     Scott Parker                       Lisa Polsky                    Margaret Tutwiler
      Chief                         General                           Chief                            Chief Risk                Communications and
   Administrative                   Counsel                         Financial                           Officer                  Government Relations
      Officer                                                        Officer

                                                                       12
Integration Framework

    Limited Integration Risk
                                      Low Risk Balance Sheet
                                                                        SIFI Readiness

• CIT will maintain OneWest’s     • ~60% of OneWest’s balance       • CIT was preparing to surpass
  existing branches and            sheet is cash, securities,         $50 billion of assets on an
  infrastructure                   FDIC indemnification assets        organic basis
• Complementary commercial         or covered loans                 • CIT has already invested in its
  lending franchises              • CIT and OneWest originate         BSA/AML, stress testing,
• Extensive integration            commercial assets in similar       capital planning, risk
  experience                       industries and with consistent     management and liquidity
                                   credit profiles                    infrastructure
• Modest cost reduction targets
                                                                    • Additional investments relate
                                                                      primarily to data, liquidity and
                                                                      operational risk reporting
                                                                      requirements to regulators

                                                13
Financially
       Attractive
     Combination

14
Attractive Opportunity

 Transaction Multiples

                                                         CIT’s Acquisition of OneWest
                                                                                        Adjusted for
                                                                                     NOL Benefit and                               Recent                            California
                                                                    Stated             9.0% TCE/TA¹                          Transactions²                             Banks³
 Price / Tangible Book Value                                            1.2x                               1.1x                             1.7x                              2.3x

 Price / Earnings4                                                       14x                                  9x                             19x                               17x

 Core Deposit Premium                                                  6.2%                               2.6%                           18.1%                            16.5%
Note: See Appendix for additional detail
¹ Adjusts consideration for midpoint of increase in present value of CIT’s NOL and for OneWest’s capital above 9.0% TCE/TA; adjusts tangible book value for capital above 9.0% TCE/TA
² Bank sector mergers and acquisitions greater than $1 billion deal value since January 1, 2012 (Umpqua/Sterling, PacWest/CapitalSource, M&T/Hudson City and UnionBanCal/Pacific
  Capital)
³ California banks consist of CVB, City National, First Republic, Silicon Valley Bank, PacWest and Westamerica
4 Multiple of 2013 Net Income before Extraordinary Items & Adjustments in 2013 Call Report (for OneWest), NTM earnings (for recent transactions and California banks)

                                                                                          15
Key Transaction Assumptions

 Synergies
 Cost                                    • $20 million pre-tax per annum
                                         • Fully phased-in by 2016
 Funding                                 • $20 million pre-tax per annum
                                         • Fully phased-in by 2016
                                         • Reflects improved balance sheet liquidity and credit profile
 Revenue                                 • None included in merger economics
                                         • Opportunities to provide commercial banking services to CIT’s core commercial clients (cash
                                             management, commercial deposits, etc.)
 Restructuring Charge                    • $75 million pre-tax
 Cash Consideration
                                         • $1.5–2.0 billion of senior unsecured notes at ~4.5% pre-tax coupon
 Funding
 Capital Distribution                    • CIT's Board has authorized an additional $500 million share repurchase to be executed prior to closing
                                         • Going forward, CIT is targeting a dividend and total payout ratio in line with bank peers
 Tax                                     • Transaction may favorably impact the amount and timing of reversals of the Valuation Allowances
                                             against CIT’s Net Deferred Tax Asset
                                         •   Estimated blended GAAP effective tax rate will be ~30% in 2016
 Fair Value Marks                        • Fair value marks in aggregate are not expected to have a material impact on capital at close or net
                                             income
                                             – OneWest carries a substantial portion of its Legacy Portfolio at fair value
                                             – Estimated gross credit mark of ($160) million, predominantly conforming reserve methodology
                                             – Estimated rate and spread marks of ($60) million on securities, deposits and borrowings
 Core Deposit Intangible                 • 1% of OneWest's non-time deposits

Note: Based on expectations and assumptions as of announcement date; subject to change at transaction closing

                                                                                         16
Highly Accretive Transaction

           2016E (synergies 100% phased in)

           Standalone EPS¹                                                                                                      $3.73

           Pro forma EPS                                                                                                          4.49

           $ / share accretion                                                                                                  $0.76

           % accretion                                                                                                          ~20%

           IRR                                                                                                                  ~15%
          Note: See Appendix for additional detail
          ¹ Represents mean of published 2016 analyst pre-tax income estimates adjusted to reflect a blended 30% GAAP effective tax rate

                                                                         17
Achieving Our Return on Equity Objective

                                2014 Investor Day

                                                Assumed no valuation allowance reversal

Today

                                                                                            ~300 bps

                                                  ~100 bps                  ~50 bps
                            100+ bps
                                                                          $500 million    Acquisition of
                                                  Growth                   Additional       OneWest
                               ROA                                                                            12–13%
                                                                          2014 Share
                          Improvement
         7.5%                                                             Repurchase
                           (ex. Growth)

  1H ‘14 Pre-Tax ROATCE                                                                                    Pre-tax ROATCE
                                          Assumes the valuation allowance is reversed

                                                                  18
Delivering On Our
      Strategic Agenda

19
Acquisition of OneWest: Delivering On Our Strategic Agenda

                           Advances Our Bank Strategy

                  Complements Our Commercial Finance Franchise

                    Accelerates Realization of Embedded Value

                             Financially Compelling

                                       20
Appendix

21
Earnings Per Share Accretion/(Dilution)

    Detailed Build

                                                                                                     $ Millions             Millions of Shares       $ per Share

CIT Standalone
Mean of 2016E Analyst Pre-Tax Income Estimates                                                           $919
Expected Tax Rate                                                                                         30%
                                                                                                                                                 1
CIT 2016E After-Tax Earnings                                                                             $643                              172            $3.73

Pro Forma

CIT 2016E After-Tax Earnings                                                                             $643                              172            $3.73
                                                               2
$500 Million Incremental Share Repurchase Prior to Close                                                    (2)                            (10)
                                      3
OneWest Net Income Contribution                                                                           243                               31
    Combined Net Income                                                                                  $885                              194

After-Tax Adjustments
             4
Synergies                                                                                                 $24
                                          5
Cost of Cash Consideration Funding                                                                         (54)
                      6
Other Adjustments                                                                                           15
    Pro Form a CIT Net Incom e                                                                           $870                              194            $4.49
    $ Accretion to CIT                                                                                                                                    $0.76
    % Accretion to CIT                                                                                                                                     20%
1   Implied CIT 2016E standalone CIT share count based on tax-effected mean of 2016E Analyst Pre-Tax Income Estimates and associated EPS estimates
2   Assumes 10 million shares are repurchased at $50.00 per share; cash funding assumed to cost 0.50% pre-tax; 40% marginal tax rate
3   Net Income before Extraordinary Items & Adjustments in 2013 Call Report
4   $40 million pre-tax Cost and Funding synergies; 40% marginal tax rate
5   Funded at high end of $1.5–2.0 billion senior debt issuance range at 4.50% pre-tax coupon; 40% marginal tax rate
6   Includes amortization of Core Deposit Intangible and accretion of credit, rate and spread marks; 40% marginal tax rate

                                                                                       22
Tangible Book Value Per Share Accretion/(Dilution) Detail

    Detailed Build

                                                                                                         $ Millions              Millions of Shares           $ per Share

CIT Standalone
CIT Tangible Book Value as of June 30, 2014                                                                 $8,198                               186              $44.16
Three Quarters of IBES Mean Net Income Prior to Close                                                          477
Three Quarters of $0.15 Per Share Common Dividend                                                               (84)
                                                             1
Previously Planned Share Repurchase Prior to Close                                                             (55)                               (1)
    Standalone CIT Tangible Book Value at Close                                                             $8,536                               185              $46.26

Pro Forma
CIT Standalone Tangible Book Value at Close                                                                 $8,536                               185              $46.26
                                          2
Equity Consideration to OneWest                                                                              1,388                                31
$500 Million Incremental Share Repurchase Prior to Close 3                                                    (500)                              (10)
                                          4
Goodw ill and Intangibles Created                                                                             (625)
                                      5
After-Tax Restructuring Charge                                                                                 (45)
    Pro Form a CIT Tangible Book Value Share                                                                $8,754                               206              $42.53
$ Dilution to CIT                                                                                                                                                  ($3.73)
% Dilution to CIT                                                                                                                                                  (8.1%)
Tangible Book Value Per Share Earnback                                                                                                                          ~4 years
1   $55 million remaining as of June 30, 2014, under outstanding $600 million share repurchase authorization; assumed to be repurchased at $50.00 per share
2   Based on fixed number of shares at $44.33; final amount is subject to CIT’s stock price at transaction closing
3   Assumes 10 million shares are repurchased at $50.00 per share
4   Based on expectations and assumptions as of announcement date; subject to change at transaction closing
5   $75 million pre-tax; 40% marginal tax rate

                                                                                           23
Transaction Multiples Detail

    Detailed Build
                                                                             Stated                                            Adjusted for NOL Benefit and 9.0% TCE/TA
                                                                         Metric                        Multiple                              Metric                   Multiple

Deal Value                                                                                               $3,411                                                        $2,277 1

Price / Tangible Book Value                                             $2,805                              1.2x                           $2,021 2                       1.1x

Price / Earnings                                                           243                               14x                              241 3                        9x

Core Deposit Prem ium                                                    9,853   4
                                                                                                           6.2%                             9,853 4                      2.6%

Memo:
NOL Benefit (Present Value of Accelerating NOL Utilization)                                                                                                              $350
OneWest Capital Above 9.0% TCE/TA                                                                                                                                         783
1   Deal Value of $3,411 million less midpoint of $300–400 million NOL Benefit and $783 million of capital in excess of 9.0% TCE/TA
2   Core tangible book value assumes 9.0% TCE/TA target on Q2 2014 tangible assets of $22,456 million
3   Adjusted to reflect assumed 0.50% pre-tax yield on $783 million of Excess Cash; 40% marginal tax rate
4   Q2 2014 non-jumbo time deposits

                                                                                             24
OneWest Historical Income Statement

 $ Millions
                                                                Year ended 12/31/13
                                                                         Call report

Interest income
Loans                                                                         $834
Mortgage-backed and other securities                                             77
Other                                                                           (38)
  Total interest incom e                                                      $873

Interest expense
Deposits                                                                      $121
Other borrow ings                                                                80
  Total interest expense                                                      $201

  Net interest incom e                                                        $672

Provision for loan losses                                                       (11)
  Net interest income after provision for loan losses                         $660

  Total noninterest income                                                     $59

Noninterest expense
Salary and benefits                                                           $200
Premises and equipment                                                           44
Other expenses                                                                 130
  Total noninterest expense                                                   $373

Net income before income taxes                                                $346
Income tax expense                                                             103
  Net Incom e before Extraordinary Item s & Adjustm ents                      $243

                                                           25
OneWest Historical Balance Sheet

 $ Millions
                                                    Year ended 12/31/13    Six months ended 6/30/14
                                                             Call Report                 Preliminary

Cash and cash equivalents                                        $6,308                      $4,586
Securities                                                        1,271                       1,222
  Total cash and securities                                      $7,579                      $5,808

Loans and leases held for sale                                      $23                         $26

Loans and leases held for investment                           $12,934                     $14,113
Allow ance for loan losses                                          (91)                        (84)
  Net loans and leases                                         $12,843                     $14,029

Goodw ill and other intangible assets                             $114                        $110
Other assets                                                      2,937                       2,594
  Total assets                                                 $23,496                     $22,567

Deposits                                                       $14,099                     $14,522
Federal Home Loan Bank advances                                   4,606                       4,032
Other liabilities                                                 1,318                       1,098
  Total liabilities                                            $20,023                     $19,652

  Total shareholders' equity                                     $3,473                      $2,914

  Total liabilities and shareholders' equity                   $23,496                     $22,567

Memo: TCE/TA                                                     14.4%                       12.5%

                                               26
27
You can also read