Coca-Cola Amatil 2014 Full Year Result
←
→
Page content transcription
If your browser does not render page correctly, please read the page content below
Coca-Cola Amatil
2014 Full Year Result
Alison Watkins Group Managing Director
Nessa O’Sullivan Group Chief Financial Officer
Barry O’Connell MD Australia – Non-Alcoholic Beverages
17 February 2015
2014 Full Year Result Overview
Australian beverage business earnings declined 21.3% with the business commencing
restructuring activities targeted at strengthening our competitive position against the
backdrop of difficult trading conditions
Both the Indonesian and PNG businesses delivered strong volume growth and market
share gains across key categories. Rapid cost inflation, currency depreciation and
increased competition however impacted segment earnings
New Zealand & Fiji earnings increased by 6.7% in Australian dollars with New Zealand
earnings flat in local currency terms
Alcohol, Food & Services earnings declined by 7.4% with improved SPC earnings
offset by declines in Alcoholic beverages and Services
Cash flow generation was strong, supporting the payment of a final dividend of 22.0
cents per share representing a total dividend payout of 85.4% of net profit, before
significant items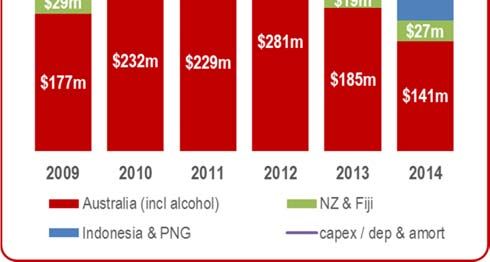
Australia – 2014
Australian beverage business earnings declined 21.3% with the business commencing
restructuring activities targeted at strengthening our competitive position against the
backdrop of difficult trading conditions
$Am FY14 FY13 Change
Trading revenue 2,832.3 2,947.2 (3.9%)
Revenue per unit case $8.45 $8.71 (3.0%)
Volume (million unit cases) 335.1 338.2 (0.9%)
EBIT1 445.3 566.0 (21.3%)
EBIT margin1 15.7% 19.2% (3.5) pts
1. before significant items
Engaging and expanding our consumer and customer
franchise, supported by cost efficiency
Single serve decline showing signs of improvement
Transaction & Mix-led revenue and will build in 2015, with particular focus on contour
1 packs
growth
We continue to increase consumer relevance by focus on
Increased product and brand
2 portion size, functionality, reduced calories, new and
relevance to key consumers
redefined categories
Up-weighted, focused marketing We’re investing significantly behind Coke Life, Sprite
3
investment and Mount Franklin
People and technology-led route We’ve made a good start at regaining our key route
4 customer base, complemented by major focus on driving
to market and RGM discipline
field execution discipline back into the organisation
Balanced revenue growth / cost We’re driving efficiency throughout – including plant
5
optimisation
closures, headcount reduction, sku rationalisation, third
party spend, and technology investment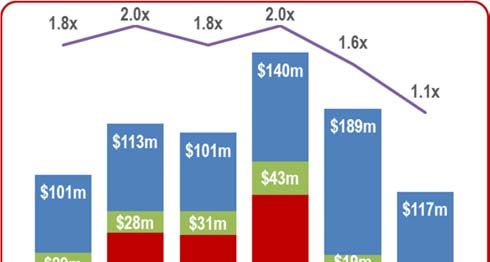
Stabilising transaction decline and re-engaging
consumers
CSD single serve transactions Teens P4W
Units (indexed to Sep-Jan 12/13) consumption The 1st phase of an “always on”
campaign for teens and young adults
+10 ppt
Sep-Jan 14/15
100
Total Pop.
Ground-breaking campaign
P4W consumption integrating portion size, pricing,
92 +2 ppt pack innovation, social media,
90
Sep-Jan 14/15 “gamification” and field execution
Video ad
impressions
21 M
Instagram
impressions
Sep-Jan 12/13 Sep-Jan 13/14 Sep-Jan 14/15 3.5x
Sources: CCA ex-factory sales Sources: TCCC AU B3 consumer tracker Sept-Dec 3MMT;
TCCC social listening tracker Nov-Feb;
Universal McCann digital campaign tracker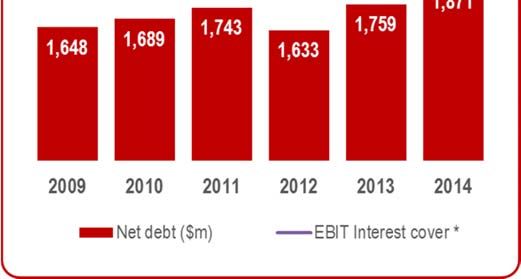
2015 will see continued focus on transactions and mix
through pack price optimisation in our core
“Only Coke can do” packaging A celebration of Coca-Cola with
‘Always on’ with teens and
and activation to access more particular focus in single serve
young adults
households contour
Accelerated availability across Accelerating pack premiumisaton 100 years of contour to under-
all outlets in 250ml multipacks and 1L glass pin major Coca-Cola campaign
Next phases of perfectly small contour packs later this year
can campaign to appear in Activated in “Premium Bays”
Currently in-
2015 Best in Class execution market testing
Continue to connect with teens for Xmas, single serve
on their terms (digital content, Footy Finals pack size and
social media) and Easter pricing
Increasing consumer relevance supported by up-
weighted marketing investment
No compromise Coca-Cola taste - with 35% less kJ
Naturally sweetened with unique stevia blend
Supported with $ multi-million marketing
campaign
Focused on premium and smaller pack
formats
International experience shows significant
halo effect on total trademark
Sources: Great Britain actual sales volume YoY since September 2014
Source: Argentina post launch consumer tracker 2013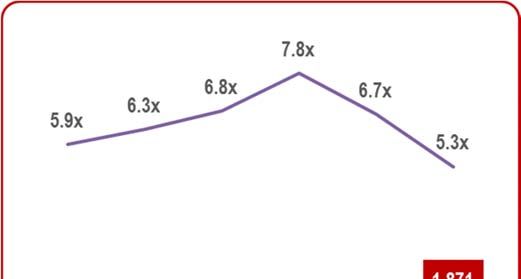
Increased product and brand relevance, with an up-
weighted investment
Improved functionality and zero kJ Redefining existing categories
10% YoY growth Aseptically filled, shelf-stable
+4pts share gain Achieved +3% volume share
Another product innovation Further expansions to the
later in 2015 range during 2015
Mainstreaming category appeal Entry to new wellness categories
Achieved +15% volume share
11% YoY growth
Launching in route this month
+5.5pts share gain
Sources: CCA ex-factory sales FY2014 Sources: Aztec Combined Grocery and Convenience data Qtr to Jan15
Aztec Grocery data FY 2014 Aztec Grocery data Qtr to Jan15
Increased investment behind flavours and water to
leverage permissibility and health trends
Sprite – significant upside Holding value in a commoditising category
Significant and sustained brand and Continue to selectively utilise Pure
marketing investment complemented by a Springs as branded value water offering
swing to lower calorie offerings
New ‘Mount Franklin’ bottle and look
Increased focus on Sprite Zero later in 2015
Testing shift to Mount Franklin
naturally brand relaunch with
sweetened lower 30% increase in
calorie Sprite media
Optimised pricing
strategiesEngaging and expanding our consumer and customer
franchise, supported by cost efficiency
Single serve decline showing signs of improvement
Transaction & Mix-led revenue and will build in 2015, with particular focus on contour
1 packs
growth
We continue to increase consumer relevance by focus on
Increased product and brand
2 portion size, functionality, reduced calories, new and
relevance to key consumers
redefined categories
Up-weighted, focused marketing We’re investing significantly behind Coke Life, Sprite
3
investment and Mount Franklin
People and technology-led route We’ve made a good start at regaining our key route
4 customer base, complemented by major focus on driving
to market and RGM discipline
field execution discipline back into the organisation
Balanced revenue growth / cost We’re driving efficiency throughout – including plant
5
optimisation
closures, headcount reduction, sku rationalisation, third
party spend, and technology investment
Route to Market: Signs of positive turnaround
2014: Significant progress re-engaging
2015: Focus on execution
customers and building trust
Slowing volume decline in route across 2014 Re-Routes and Sales Org
Re-Design
+1.5 ppt growth in shelf share
Customer Leads &
+1,300 customers vs Jan 14 Sales Force Effectiveness
Opportunity System
Route outlet count Targeting +1,000 net new
000’s customers in 2015
+1,300
Technology Enabled
Sales Tools Leverage new product
launches to drive result
Focus on field execution
and revenue growth
Picture of Success
management
Sources: ex-factory sales data (reporting on active outlet base) to Dec 14Productivity: Efficiency initiatives remain on-track to
deliver over $100m in savings over 3 years
Single serve decline showing signs of improvement
Transaction & Mix-led revenue and will build in 2015, with particular focus on contour
1 packs
growth
We continue to increase consumer relevance by focus on
Increased product and brand
2 portion size, functionality, reduced calories, new and
relevance to key consumers
redefined categories
Up-weighted, focused marketing We’re investing significantly behind Coke Life, Sprite
3
investment and Mount Franklin
People and technology-led route We’ve made a good start at regaining our key route
4 customer base, complemented by major focus on driving
to market and RGM discipline
field execution discipline back into the organisation
Balanced revenue growth / cost We’re driving efficiency throughout – including plant
5
optimisation
closures, headcount reduction, sku rationalisation, third
party spend, and technology investment
Productivity: Efficiency initiatives remain on-track to
deliver over $100m in savings over 3 years
Manufacturing review completed - Bayswater closure announced
Optimise
Supply Chain support staff restructure completed
supply chain
SKU rationalisation underway; ~ 250 deleted over last 12 months
Maximise value Simplified buying framework completed
from third party Ongoing active management and rationalisation of supplier base
spend Strategic alignment with key supply partners is in progress
Structural changes to implement a low-touch, high-value support
Optimise model are currently being finalised
support model Leveraging technology to deliver standardised and enhanced
operational and business performance reportingEngaging and expanding our consumer and customer
franchise, supported by cost efficiency
Single serve decline showing signs of improvement
Transaction & Mix-led revenue and will build in 2015, with particular focus on contour
1 packs
growth
We continue to increase consumer relevance by focus on
Increased product and brand
2 portion size, functionality, reduced calories, new and
relevance to key consumers
redefined categories
Up-weighted, focused marketing We’re investing significantly behind Coke Life, Sprite
3
investment and Mount Franklin
People and technology-led route We’ve made a good start at regaining our key route
4 customer base, complemented by major focus on driving
to market and RGM discipline
field execution discipline back into the organisation
Balanced revenue growth / cost We’re driving efficiency throughout – including plant
5
optimisation
closures, headcount reduction, sku rationalisation, third
party spend, and technology investment
New Zealand & Fiji
In Australian dollars, New Zealand & Fiji delivered 6.7% earnings growth driven primarily by
the currency benefit on translation from the appreciation of the New Zealand dollar. Local
currency New Zealand earnings were flat while Fiji reported double-digit earnings growth.
$Am FY14 FY13 Change
Trading revenue 488.0 452.5 7.8%
Revenue per unit case $7.96 $7.36 8.2%
Volume (million unit cases) 61.3 61.5 (0.3%)
EBIT1 88.2 82.7 6.7%
EBIT margin1 18.1% 18.3% (0.2) pts
1. before significant itemsNew Zealand & Fiji
New Zealand
Despite strong consumer sentiment in New Zealand, the overall grocery market remains
sluggish with non-alcoholic ready to drink beverages declining by 0.6%. CCA’s New
Zealand business grew overall market share with gains across all categories except
CSDs.
Highlights for the year included share gains in Juice (up 2 pts), Energy (up 1.5 pts) and
water (up ~4 pts) while CSD share is down (0.5 pts). The CSD category remains under
pressure (down 3.3%) driven by permissibility concerns and a shift to non-CSD
categories
Immediate consumption volumes increased as a result of a 3% increase in customer
numbers, over 400 new cooler doors in place and customer service improvements
Indonesia & PNG
Both the Indonesian and PNG businesses delivered strong volume growth and market share
gains across key categories. Rapid cost inflation, currency depreciation and increased
competition however impacted segment earnings
$Am FY14 FY13 Change
Trading revenue 927.5 919.2 0.9%
Revenue per unit case $4.41 $5.14 (14.2%)
Volume (million unit cases) 210.1 178.7 17.6%
EBIT1 31.9 91.6 (65.2%)
EBIT margin1 3.4% 10.0% (6.6) pts
1. before significant itemsIndonesia & PNG
Indonesia
Focus has been on expanding our market presence by improving product availability and
affordability
Delivered over 17% volume growth with market share gains across key categories,
driven by improved market execution and a focus on multi-serve and recruitment packs
Re-established market leadership position in CSDs, increasing share to 58%, with share
gains also made in Tea and Juice, driven by new products, packs and higher levels of
marketing and promotional funding
Intensification of the competitive landscape has limited the ability of the business to fully
recover cost increases through pricing. The increased mix of lower priced affordability
packs also impacted margins as the business expanded its offerings in water, cups and
multi-serve carbonated beverages
Decline in Rupiah increased input costs by ~$35 million, with significant cost increases in
wages and fuel costs
Alcohol, Food & Services
Alcohol, Food & Services earnings declined by 7.4% with improved SPC earnings offset by
declines in Alcoholic beverages and Services
$Am FY14 FY13 Change
Trading revenue 695.0 717.5 (3.1%)
EBIT 1 86.1 93.0 (7.4%)
1. before significant itemsAlcohol, Food & Services
Alcoholic beverages
Earnings impacted by declines in the dark spirits category. Jim Beam volume recorded
significant improvements in market share in the second half following the re-introduction
of the six pack ready-to-drink offering
Canadian Club continued to perform well with double-digit volume increases and
ongoing strong momentum of the category.
Although the business experienced a slower than expected return to beer and cider, by
the close of our first year back, draught beer and cider distribution was on par with pre-
2011 levels
Q4 momentum improved as Coors and Blue Moon gained traction and distribution, new
beer brands launched (Yenda, Samuel Adams, Fiji Bitter, Vonu) and smaller cider packs
performing well
SPC
Significant improvement in earnings driven by improved ranging, successful new product
launches and productivity improvements
Profit & Loss
EBIT decline of 21.8%, before significant items, in line with guidance provided in Aug14
A$m FY14 FY13 % chg
EBIT (before significant items) 651.5 833.3 (21.8%)
Net finance costs (121.9) (124.8) 2.3%
Taxation expense1 (153.4) (205.0) (25.2%)
Non-controlling interests (0.7) (0.7) -
NPAT (before significant items) 375.5 502.8 (25.3%)
Significant items – after tax (103.4) (422.9)
NPAT (reported) 272.1 79.9 240.6%Significant Items
Significant item expense of net $103.4 million after tax
» $85.9 million relates to the restructuring of the Australian beverage business
» $17.5 million related to restructuring activities across the other businesses
Comprises $58.5 million of cash costs, primarily redundancy costs, with a related
payback of under 18 months
» $29.2 million incurred in 2014
» Most of the balance to be paid in 2015
The non-cash charges largely relate to the asset write-offs associated with site
consolidation and changes in strategic direction of the business
Capital Expenditure
Overall reduction in capex driven by the completion of investment in PET bottle self-
manufacture lines in Australia
Australia: the Project Zero blowfill investment
was completed and a new state of the art
aseptic production line was installed
Indonesia: installation of 3 production lines
and upgrading of 3 others, and the placement
of 40,000 cold drink coolers. Indonesian
capex was below guided to levels as plans
have been reviewed and re-scoped in light of
the new strategic plans with TCCC which will
see capex accelerated to around A$170
million pa for the next 3 years
Group capex is expected to be ~$330m pa
for the next 3 yearsCash Flow
Free cash flow of $311.6 million, a $30.0 million decrease on last year, due to a significant
fall in earnings largely offset by reduced capital expenditure
A$m FY14 FY13 $ chg
EBIT (post significant items) 507.1 367.9 139.2
Depreciation & amortisation 266.6 251.5 15.1
Impairments – non-cash 57.2 361.0 (303.8)
Change in working capital & other 67.6 43.1 24.5
Net interest paid (129.3) (121.9) (7.4)
Taxation paid (179.0) (168.5) (10.5)
Operating cash flow 590.2 733.1 (142.9)
Capital expenditure (285.3) (392.5) 107.2
Proceeds from sale of trademarks, PPE & other 6.7 1.0 5.7
Free cash flow 311.6 341.6 (30.0)
Capital Employed
Capital employed increased 1.7% with return on capital employed of 18.5%, before
significant items, remaining well above CCA’s cost of capital
A$m FY14 FY13 $ chg
Working capital 461.1 382.3 78.8
Property, plant & equipment 2,031.2 2,062.2 (31.0)
IBAs & intangible assets 1,277.0 1,264.8 12.2
Current & deferred tax
(167.4) (222.2) 54.8
balances
Derivatives – non-debt 15.0 (32.2) 47.2
Other net assets / (liabilities) (58.9) 44.2 (103.1)
Capital employed 3,558.0 3,499.1 58.9Net Debt & Interest Cover
EBIT interest cover * remains strong at 5.3x
Net debt increased by $112.0 million to
$1.87 billion
The high level of cash holdings are a
result of favourable borrowing terms
which have enabled the pre-funding of
all future debt maturities to March 2016.
The funds raised that have been placed
on deposit to match debt maturities are
earning interest income equal to their
related borrowing costs.
* before significant items
Priorities & Outlook for 2015-2017
Australia – Stabilise earnings and return to growth
» Strengthen our brand portfolio to increase our appeal to a wider range of consumers
» Optimise our revenue management by optimising price, pack architecture and
strengthening our promotional management
» Redesign the route to market model to improve cost to serve and better leverage our
scale
» Restructure our cost base to deliver ongoing productivity gains
» While the trading landscape continues to be challenging, we are targeting to stabilise
earnings in 2015. Cost initiatives are being implemented progressively throughout the
year and accordingly, benefits will be weighted to the second halfPriorities & Outlook for 2015-2017 Indonesia – Expand our market presence in Indonesia to realise the market’s potential » Improve product availability and affordability across different channels » Build brand strength and channel relevance through multi-category portfolio » Drive cost competitiveness from operating leverage, transformed route-to-market and reduced complexity » Agreement for a US$500m equity investment by TCCC into CCA Indonesia to accelerate growth plan with aligned volume and return targets » The operating landscape continues to be challenging with recent increases in inflation impacting consumption, however we are confident that we will continue to deliver strong volume growth and improved earnings for 2015 Priorities & Outlook for 2015-2017 Alcohol – Continue to build our alcoholic beverage portfolio in Australia and New Zealand » Strengthen our product offering and customer servicing capability to the licensed channel by leveraging CCA’s large-scale sales, manufacturing and distribution infrastructure assets SPC – Invest to restore SPC to a profitable, modern food business » Strong transformation plan to revitalise the brand portfolio and return the business to growth
2015-2017 Financial targets
Group EPS     » No further decline in EPS after 2014
              » Targeting to return to mid single-digit EPS growth levels
              » The pace of recovery will depend on the success of revenue initiatives in Australia
                and Indonesian economic factors

  Capital     Group capex – ~$330m pa for next 3 years
expenditure   » Australia & NZ – at or below depreciation
              » Indonesia – KO US$500m capital injection supports capex of ~$170m pa for 3 yrs
              » SPC – $100m over next 3 years comprising $78m CCA investment and $22m
                funding from Vic govt

 Dividend     » Well placed to target dividend payout ratio of over 80% given strength of cash flow
 outlook        generation

 Balance      » Maintain conservative debt levels to provide flexibility to fund future growth
  sheet         opportunities
              » Potential to pursue capital management initiatives
              » Bolt-on acquisitions only

                  Coca-Cola Amatil
              2014 Full Year Result
                                         Q&A
                                     17 February 2015
Disclaimer CCA advises that these presentation slides contain forward looking statements which may be subject to significant uncertainties outside of CCA’s control. No representation is made as to the accuracy or reliability of forward looking statements or the assumptions on which they are based. Actual future events may vary from these forward looking statements and you are cautioned not to place undue reliance on any forward looking statement.
You can also read