Q2 2021 Catastrophe Bond & ILS Market Report - On track to break multiple records in 2021 - Artemis.bm
←
→
Page content transcription
If your browser does not render page correctly, please read the page content below

Q2 2021 Catastrophe
 Bond & ILS Market Report
On track to break multiple records in 2021

Focused on insurance-linked securities (ILS), catastrophe bonds,
alternative reinsurance capital and related risk transfer markets.

www.artemis.bm


INTRO
This report reviews the catastrophe bond and insurance-linked
securities (ILS) market at the end of the second-quarter of 2021,
looking at new risk capital issued and the composition of transactions
completed during the quarter.

For the first time in the market’s history, catastrophe bond and related ILS issuance
surpassed $8 billion in a single quarter during Q2 2021, setting a new quarterly
record at $8.5 billion. This staggering level of new risk capital came from 30
transactions consisting of 66 tranches of notes.

Of the record breaking Q2 issuance total, a significant $6 billion or over 70% covered
catastrophe risks. As shown by the Artemis Deal Directory, this is behind only Q2
2017, a period in which a huge $6.4 billion covered catastrophe risks. However, as
at the end of H1 2021, cat risk issuance has reached a new high of more than $8.5
billion, which is slightly higher than the record for property cat bonds issued in the
first-half.

Year-on-year, cat bond and ILS issuance increased by approximately $4.87billion,
ensuring that for the first time ever, H1 issuance has surpassed the $10 billion
mark. In fact, combined with robust investor demand and sponsor appetite in Q1,
the $8.5 billion of issuance witnessed in Q2 takes H1 2021 total issuance to a
massive $13.12 billion.

To put this into context, more than $13 billion of issuance at the halfway stage
makes 2021 already the third most active year on record, behind only the $16.4
billion and $13.9 billion recorded in 2020 and 2018, respectively.

Artemis is the leading, freely accessible source of timely, relevant and authoritative
news, analysis, insight and data on the insurance-linked securities, catastrophe
bond, alternative reinsurance capital and related risk transfer markets. The Artemis
Deal Directory is the leading source of information, data and analysis on issued
catastrophe bond and insurance-linked securitization transactions.
Transaction Recap
A mix of traditional 144A cat bonds, private cat bond lite transactions, and
mortgage ILS issuance featured in the second-quarter of 2021. The ILS
investor base took advantage of a wide range of perils and geographies of risk
ceded from an expanding sponsor base.

Q2 2O21 issuance was dominated by traditional 144A structured deals with a focus on
pure catastrophe risk. In total, these transactions amounted to $6 billion, of which the
large majority came from repeat sponsors.

Alongside the 22 traditional 144A deals, three private transactions from unknown
sponsors brought a combined $283.7 million of unknown property cat risk to market.
Notably, one of these deals is perhaps the largest cat bond lite transaction ever, at $250
million in size.

Impressively, five new sponsors entered the market in the period. In May, Vantage
Risk sponsored its first deal, a $225 million single tranche issuance covering multiple
international perils. At the end of the month, St. Johns Insurance Company entered the
space with a $120 million Florida and South Carolina named storms deal.

June kicked off with the $150 million, international multi-peril Titania Re transaction,
the first cat bond ever to benefit an entity of Ariel Re. Later in the month, Gryphon
Mutual Insurance Company, Blackstone’s real estate captive, issued its debut cat bond, a
$50 million California earthquake deal. Also in June, Vermont Mutual Insurance looked to
the cat bond space for the first time, sponsoring a $150 million U.S. multi-peril deal.

As well as repeat and new sponsors of cat risk deals, Q2 2021 cat bond and related ILS
issuance featured almost $2.3 billion of mortgage risk. This slice of issuance came from
repeat sponsors Genworth Mortgage Insurance, Radian Guaranty, National Mortgage
Insurance Corp, Arch Capital, and Essent Guaranty.

Together with the 27 transactions sponsored in Q1, the 30 issued in Q2 takes the
number of deals brought to market in H1 2021 to 57. As shown by the Artemis Deal
Directory, this is above the full-year total for all years prior to 2017. Furthermore, if the
strong issuance trend persists, it seems likely that 2021 will see more deals than the
record 80 seen last year.

Deals issued in Q2 2021

ISSUER / TRANCHE                        SPONSOR                            PERILS                        $M      DATE

Baldwin Re Series 2021-1                Vermont Mutual Insurance           U.S. multi-peril              150      Jun

Mona Lisa Re Series 2021-1              RenRe and DaVinci Re               International multi-peril     250      Jun

Lion III Re DAC                         Generali                           International multi-peril    238.8     Jun

Umigame Re Pte Series 2021-1            Tokio Marine                       Japan multi-peril             200      Jun

Merna Re II Series 2021-2               State Farm                         U.S. earthquake               300      Jun

Wrigley Re Series 2021-1                Gryphon Mutual Insurance           U.S. earthquake               50       Jun

Radnor Re 2021-1                        Essent Guaranty                    Mortgage insurance risks     557.9     Jun

Bellemeade Re 2021-2                    Arch Capital Group                 Mortgage insurance risks     522.5     Jun

Mystic Re IV Series 2021-2              Liberty Mutual                     International multi-peril     300      Jun

Titania Re Series 2021-1                Ariel Re                           International multi-peril     150      Jun

Putnam Re Pte Series 2021-1             St. Johns Insurance Company        U.S. named storm              120     May

Sanders Re II Series 2021-1             Allstate                           U.S. multi-peril              250     May

Alamo Re Series 2021-1                  TWIA                               Texas multi-peril             500     May

Riverfront Re Series 2021-1             Great American Insurance           International multi-peril     305     May

Herbie Re Series 2021-1                 Fidelis Insurance                  International multi-peril     150     May

Residential Reinsurance Series 2021-1   USAA                               International multi-peril     400     May

Everglades Re II Series 2021-1/2        Citizens Property Insurance        U.S. named storm              950     May

Artex – Aquarelle Notes                 Unknown                            Unknown property cat risks    250     May

Pelican IV Re Series 2021-1             Louisiana Citizens                 Louisiana multi-peril         125     May

Vista Re Series 2021-1                  Vantage Risk                       International multi-peril     225     May

Oaktown Re VI                           National Mortgage Insurance Corp   Mortgage insurance risks     367.3     Apr

Kendall Re Series 2021-1                Aspen                              International multi-peril     300      Apr

Eagle Re 2021-1                         Radian Guaranty                    Mortgage insurance risks     497.82    Apr

Triangle Re 2021-2                      Genworth Mortgage Insurance        Mortgage insurance risks     302.65    Apr

Isosceles Insurance Series 2021-B1      Unknown                            Unknown property cat risks    25       Apr

Kilimanjaro III Re Series 2021-1/2      Everest Re                         International multi-peril     650      Apr

Eclipse Re Series 2021-02A              Unknown                            Unknown property cat risks    8.7      Apr

Merna Re II Series 2021-1               State Farm                         U.S. earthquake               350      Apr

Q2 ILS issuance by year ($M)
    When compared with the second-quarter of last year, cat bond and ILS issuance increased by 126%
    to $8.5 billion, which is $4.2 billion higher than the 10-year average for the period. The Artemis Deal
    Directory shows that this is now the third time in the past five years that Q2 issuance has surpassed
    $5 billion, and just the second time it’s finished the quarter above $7 billion.

10000   Q2

8000

6000

4000

 2000

    0
             2012    2013    2014     2015     2016     2017      2018     2019      2020      2021

    ILS average transaction size & number of transactions by year ($M)
    A significant 30 transactions came to market in the second-quarter of the year, which is some
    way above the average of 19 over the past decade, and above the previous record set in 2017.
    Combined, the average deal size of Q2 2021 issuance hit an impressive $303 million, which is
    approximately $82 million higher than the 10-year average for the period.

  350   Q2          Avg. Size         Transactions                                                            30

  300                                                                                                         25
  250
                                                                                                              20
  200
                                                                                                              15
  150
                                                                                                              10
  100

   50                                                                                                         5

    0                                                                                                         0
             2012    2013     2014     2015    2016      2017     2018      2019      2020     2021
Number of transactions and volume issued by month ($M)
For the very first time, cat bond and ILS issuance exceeded $2 billion in each month of the
second-quarter in 2021. Typical of any Q2, May issuance was the strongest this year at $3.3
billion. Issuance in both April and June, at $2.5 billion and $2.7 billion, respectively, set a new
record for the months as investor appetite remained strong throughout the quarter.
3500 $ millions Transactions 14
3000 12
2500 10
2000 8
1500 6
1000 4
500 2
0 0
Apr - 21 May - 21 Jun - 21
Q2 issuance by month & year ($M)
In terms of the number of deals, May was the most active month this year with 11 transactions. In
April, nine new transactions came to market, while the quarter finished strong with 10 deals in June.
4000 Apr May Jun
3000
2000
1000
0
2012 2013 2014 2015 2016 2017 2018 2019 2020 2021Q2 ILS issuance by type
The large majority of Q2 2021 issuance came in the form of a traditional 144A
catastrophe bond, with sponsors securing $6 billion of reinsurance and retrocession
protection against a wide range of perils spanning numerous territories. Year-on-year,
the volume of cat risk brought to market in Q2 increased by 112%, but remains below
the record $6.4 billion of cat risk issued in Q2 2017.
Mortgage ILS issuance was also robust in Q2 2021, reaching almost $2.3 billion from
five transactions. Private deals also made a greater contribution to overall issuance
this year when compared with Q2 2020, driven by a particularly large $250 million deal
from an unknown sponsor.
6000 Q2 2020 Q2 2021
5000
4000
3000
2000
1000
0
Cat risk Other ILS Private ILS Mortgage ILS
2020 set the record for property cat risk issuance at more than $11 billion, the only time since
2017 this figure has surpassed $10 billion in a single year. At the end of H1 2020, cat risk deals
amounted to approximately $6.6 billion, which is actually $1.9 billion less than the more than
$8.5 billion of cat risk deals secured so far in 2021, suggesting the market is well on-track to
achieve full year records as well.Intelligent and insightful offshore
legal advice and services.
Delivered with perspective.
INSURANCE &
REINSURANCE
Our Insurance & Reinsurance practice involves advising on the
establishment, regulatory compliance and business operations of
re/insurance companies (life and non-life), as well as re/insurance
managers and brokers in international jurisdictions.
Our market-leading practice in Bermuda is renowned for its expertise
in all aspects of re/insurance, including catastrophe bonds, SPIs,
sidecars and other insurance-linked securities, in addition to capital
raising, M&A and insurtech.
Visit applebyglobal.com to learn more.Q2 2021 ILS issuance by trigger type
Despite sponsors utilising a variety of trigger structures during the second-quarter,
once again, indemnity coverage dominated issuance. 76%, or more than $6.4 billion of
new risk capital issued in the period featured an indemnity trigger.
Unknown
Parametric
Industry loss index
Indemnity
Over $1.7 billion of deals placed in the quarter were structured using an industry loss
index trigger, which accounts for more than 20% of total issuance. Just one deal,
sized at $50 million, leveraged a parametric trigger in Q2 2021, making up less than
1% of issuance. We do not have trigger information for the three private deals that
featured in Q2, accounting for 3.3% of issuance.Q2 2021 ILS issuance by peril
Deals covering a range of perils in various territories (international multi-peril) provided the
largest single slice of Q2 2021 issuance, at roughly $3 billion, accounting for 35% of issuance.
Through these transactions, investors were treated to broad peril and region diversification.
The huge level of property cat bond issuance witnessed in the period also featured $200
million of Japan multi-peril protection, and $500 million and $125 million of Texas multi-peril and
Louisiana multi-peril protection, respectively. The largest slice of state specific issuance in Q2
came from two Florida named storm deals, amounting to $950 million. $120 million of additional
U.S. named storm risk, $700 million of U.S. quake risk, and $400 million of protection against
multiple U.S. perils completed the quarter’s 144A issuance.
U.S. multi-peril
U.S. named storm
Louisiana
multi-peril
Texas multi-peril
International multi-peril
Mortgage
insurance risks
Japan multi-peril
Unknown property catastrophe risks U.S. earthquake
Mortgage ILS issuance was also strong in Q2, and with five transactions bringing a combined
$2.3 billion of mortgage risk to market, this accounted for 27% of total cat bond and related
ILS issuance in Q2 2021.
Helped by an especially large cat bond lite transaction, the $283.7 million of unknown
property cat risk issued on behalf of unknown sponsors contributed 3.3% to total issuance
for the period.Seeing the Whole Iceberg
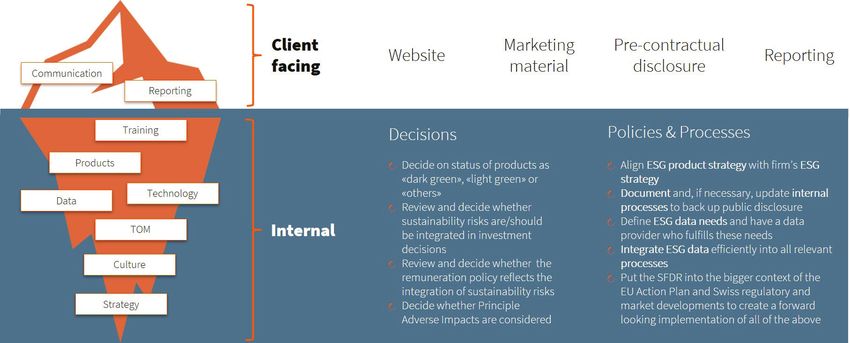
The European Union Sustainable Finance Disclosure Regulation (SFDR)
came into effect on 10 March 2021 to promote transparency in the fast
growing area of environment, social, and governance (ESG) financial
products. The SFDR is an opportunity for financial product providers,
including ILS fund managers, to clearly signal to investors which of their
products promote sustainable investment.
In the three months since the regulation Though these public disclosures for
came into effect, at least three ILS fund Article 8 and 9 classifications present
managers have seized the opportunity an opportunity to attract ESG-oriented
and declared funds as either Article 8 investment, they raise important question
(light green) or even Article 9 (dark green). under the surface.
Several additional fund managers are
working on corresponding classifications. They necessitate that ILS fund managers
re-assess key aspects of their operating
The common theme behind those Article 8 model to answer new questions such
or 9 classifications for ILS fund managers as: “What additional data do I need to
revolves around insurance creating assess the ESG nature of an incoming
social value. But while insurance indeed transaction? What ESG impact does the
has inherent ESG qualities, this is not a incoming transaction have on my overall
sufficient condition alone to classify as fund or portfolio? And, how does my
Article 8 or 9 as per the SFDR’s explicit SFDR classification change my process for
and implicit guidelines and definitions for assessing that transaction?”
ESG qualities. As part of the classification,
the ILS fund manager needs to define and Further to the process question and as
disclose the sustainable objective for the an additional complication, the SFDR is
fund (Article 9), sustainability indicators, not written specifically with ILS in mind
binding selection criteria, and other and therefore requires interpretation and
components depending on circumstances. also flexibility to accommodate futurechanges in regulation. A prime example Addressing this question can present
of where SFDR requirements need to a significant challenge for ILS fund
be put in context of the peculiarities of managers, but it can also be an
an ILS transaction is when it comes to opportunity to be a first mover and market
look-through requirements (i.e. assessing maker for the shaping of norms and
the ESG qualities of not just the sponsor standards for how the SFDR applies to ILS.
but also the underlying policies). This
raises the question of data availability, or Whether an ILS fund manager aims to be a
rather the lack thereof, and how to deal market maker, a box ticker, who addresses
with it. A fund manager’s answer to this the most immediate stakeholder
question depends on its interpretation of expectations, or a barrel scraper, who only
the SFDR but also its ESG philosophy and does what the law requires them to do, a
needs to take into consideration aspects solid operating mode needs to be in place.
of feasibility. Such an operating model needs to able to
support the promises made to investors,
regulators, and other stakeholders.
Joel Smith, Manager
Synpulse Management Consulting
www.synpulse.comQ2 2021 ILS issuance by expected loss
We have expected loss data for roughly $5.7 billion of second-quarter issuance, of which
more than 65% offered an expected loss of below 2%. In fact, more than half of quarterly
issuance, or $3.1 billion had an expected loss of between 1% and 2%. Over $1.3 billion of Q2
issuance had an expected loss of between 2.01% and 4%. The highest expected loss in the
quarter, at 7.32%, came from the tranche of Herbie Re notes. While the Class B tranche of
Pelican IV Re notes had the lowest expected loss, of 0.44%.
v v
12% 54% 11% 12% 11%
0.01% - 1% 1.01% - 2% 2.01% - 3% 3.01% - 4% 4.01%+
Q2 2021 ILS issuance by coupon pricing
We have pricing data for approximately $6 billion of second-quarter issuance. Of this, just
over a third paid investors a coupon of between 2% and 4%, with slightly more, or $2.3
billion of risk capital issued offering investors a coupon of between 4.01% and 6%. More
than $1 billion of Q2 2021 issuance paid a coupon of between 6.01% and 10%. While notes
amounting to $525 million paid a coupon of more than 10%. The tranche of Herbie Re
notes, which offered the highest expected loss, paid the highest coupon in Q2, at 17.25%.
While three tranches of notes paid a coupon of just 2.25%, the lowest on offer in the period.
v v v
35% 38% 16% 9%
2.01% - 4% 4.01% - 6% 6.01% -8% 8.01% - 10% 10.01%+Q2 2021 expected loss & multiple year-on-year
The below chart, which plots the expected loss against the multiple (price coupon
divided by expected loss) of second-quarter issuance, shows that once again,
investors demanded the highest multiple for the lowest risk/return deals.
The light blue line represents Q2 2020 and the dark blue line Q2 2021, and reveals that
during both periods, the lower the expected loss the higher the multiple on offer.
12 Q2 2020 Q2 2021
11
10
9
8
7
6
5
4
3
2
1
0
0% 1% 2% 3% 4% 5% 6% 7% 8%ILS AND ESG: DUE DILIGENCE NEEDED
THROUGHOUT THE VALUE CHAIN
Ocorian Executive Director, Sherman Taylor explains how
insurance-linked securities (ILS) managers active in Europe will
need to be conscious of their dealings with service providers
and take steps to show their ESG processes at work.
You’ll do well not to see at least one reference Geared towards promoting sustainable
to environmental, social and governance investing practices and combatting
(ESG) somewhere in your working day: “greenwashing” by introducing transparency
it’s everywhere. Investors are increasingly obligations, it is still uncertain what the
applying non-financial ESG factors as part of full impact of the SFDR will be on the ILS
their analysis process to identify material risks market. The immediate impact will largely
and growth opportunities. It has now become depend on the extent to which new ILS
a key facet of many investors’ due diligence; capital is sourced from the EU, with EU-
Lloyd’s of London have even formed an ESG based ILS funds likely to have to incorporate
Advisory Group to guide the organisation and ESG processes within their investment
ensure accountability. activities. ILS fund managers from outside
the EU who market their funds to investors
This is particularly true in Europe, where
within the EU will also need to be mindful of
the European Supervisory Authority (ESA)
the SFDR’s disclosure requirements.
developed the EU’s Sustainable Finance
Disclosure Regulations (SFDR) which SFDR is the first significant attempt by
became effective on 10 March, 2021 (the a regulator to codify ESG disclosure
more detailed requirements relating to requirements and it’s reasonable to assume
disclosures in the periodic reports of ESG- that regulators in other regions will follow
focused products will apply from 1 January suit. Responsible investing considerations
2022). The SFDR imposes requirements on already form a significant part of the
European fund managers, financial advisors decision-making process within global
and certain other EU firms to disclose capital markets, and ILS funds are aligning
information to potential investors related to their activities accordingly.
their ESG frameworks.The ILS sector is well placed to However, the ILS sector brings together the
accommodate this shift. It has long insurance and capital markets and creates a
recognised the necessity of incorporating complex securitised product with numerous
ESG into its activities in order to continue to variables and service providers involved
access fresh capital. Other sectors have not across the value chain, which means it’s
been as proactive, and we have already seen difficult to ensure uniform ESG standards
the capital markets divest from companies are being met. A cautionary note is that
that fail to meet investors’ ESG standards. companies in other sectors have suffered
ESG rating downgrades not because of
This presents an opportunity for the ILS
their own direct action, but because of the
sector, as capital divested from companies
actions of their outsourced service providers.
with poor ESG frameworks can be
The lesson that Ocorian, as a provider of
redeployed into ILS funds exhibiting
administrative and fiduciary services to the
positive ESG ratings. A significant recent
ILS sector, can postulate is that in this new
development is the announcement by
investment era, ILS funds must consider their
Lloyds that, for the first time, it is setting
ESG frameworks to be equally weighted
targets for responsible underwriting and
with their balance sheet performance.
investment to help accelerate society’s
transition away from fossil fuel dependency
and towards renewable energy sources.
Ocorian provides a full suite of
From 1 January 2022, Lloyd’s agents will no
administration and fiduciary services to the
longer provide new insurance coverages or
ILS and captive market from its Bermuda,
investments in these activities. The capital
Cayman and British Virgin Islands’ offices,
freed up by this could potentially find its way
providing certainty and confidence to
to the ILS market.
its clients when entering into complex
transactions. For more information visit
ocorian.com.
SHERMAN TAYLOR
EXECUTIVE DIRECTOR ocorian.comQ2 2021 average multiple by coupon pricing
Year-on-year, the average multiple of Q2 issuance, where we have both expected loss
and pricing data, declined from 2.89 in 2020 to 2.28 in 2021, which is also below the
2.54 average multiple recorded in Q1 2021.
As the chart shows, investors generally achieved a higher multiple the lower the
coupon on offer, with some of the lowest priced deals being an exception to this rule.
Although down on the prior quarter and comparative period last year, the average
multiple of quarterly issuance has remained above 2 for some time now.
4
3.75
3.5
3.25
2.95
3
2.75
2.5
2.27
2.23
2.25
1.94
2 1.83
1.75
1.5
1.25
1
0.75
0.5
0.25
0
%
%
%
1%
+
1%
-4
-6
-8
-1
.0
%
%
%
11
%
01
01
01
01
2.
4.
6.
9.For qualified investors only. Chasing Storms for Uncorrelated Returns Insurance Linked Strategies (ILS) For further information please visit www.credit-suisse.com This poster was produced by Credit Suisse Insurance Linked Strategies Ltd. (together with its affiliates “CS”) with the greatest of care. It is not investment advice, nor does it constitute an offer or invitation to enter into any type of financial transaction. It may not be distributed in the U.S. or to a U.S. person or in any other jurisdiction where distribution would contravene local laws or regulations. This material may not be reproduced, neither in part nor in full, without the written permission of CS. Copyright © 2017 Credit Suisse Group AG and/or its affiliates. All rights reserved.
Issuance size and price changes
     The chart below, which shows the average upsize of property cat bonds issued over the past six
     quarters, shows that as in Q2 2020, deals have upsized while marketing by roughly a third. This
     represents a dip from the average upsize of 63% seen in Q1 2021. For the first half of the year, the
     Artemis Deal Directory shows that on average, deals increased in size by 41%, compared with 36%
     in the prior year period.

Q2 2021

Q1 2021

Q4 2020

Q3 2020

Q2 2020

Q1 2020

          0%          10%           20%           30%           40%            50%           60%            70%

    Where we have full pricing data, the average price change of property cat bond issuance during Q2
    2021 was -12.5%, which signals even stronger pricing execution for sponsors than seen in Q1. Year-
    on-year, the shift in pricing dynamics is even more stark, with the -12.5% average price change in Q2
    2021 comparing to a +9% average price change in Q2 2020. This quarter, strong investor demand
    saw 32 out of 34 tranches of notes price below the mid-point of initial guidance.

  10%

   5%

     0

   -5%

 -10%

 -15%
               Q1 2020       Q2 2020          Q3 2020          Q4 2020          Q1 2021          Q2 2021
Issued / Outstanding
Overall, catastrophe bond and related ILS issuance has been fairly remarkable in both the second-quarter
and opening half of the year. Quarterly issuance surpassed $8 billion for the very first time, ensuring that at
the halfway stage, a new issuance high of $13.12 billion has been achieved. Impressively, this huge amount
of new risk capital has come on the back of record annual issuance in 2020.
Undoubtedly, mortgage ILS deals, as has been the case for the past few years, has been a strong contributor
to Q2 and H1 2021 issuance. However, property cat risk deals continue to account for the large majority of
deals, and as shown by the Artemis Deal Directory, the $6 billion of property cat bonds issued in Q2 2021
helped H1 cat risk issuance reach a new high.
Full-year cat bond and ILS issuance has only ever exceeded $13 billion on two occasions, so the fact it’s
already passed this milestone in 2021 is really quite impressive. Furthermore, the strong start to the year has
taken the outstanding market to a new high of more than $51.5 billion.
The Artemis Deal Directory shows that more than $4 billion of deals are scheduled to mature in the
remainder of 2021. However, if current market trends persist and investor demand remains high, it seems
likely that despite maturities the market will achieve outright growth once again.
52000 Issued $m Outstanding $m
50000
48000
46000
44000
42000
40000
included in the data in this report please visit www.artemis.bm/deal_directory/
If you want to see full details of every catastrophe bond and ILS transaction
38000
36000
34000
32000
30000
28000
26000
24000
22000
20000
18000
16000
14000
12000
10000
8000
6000
4000
2000
0
2002
2003
2004
2005
2006
2007
2008
2009
2010
2011
2012
2013
2014
2015
2016
2017
2018
2019
2020
2021All catastrophe bond and ILS issuance data sourced from the Artemis Deal Directory. Opportunities exist to work with Artemis to increase your profile to this segment of the global reinsurance and risk transfer market. Advertising opportunities, sponsorship, content development and partnership opportunities are available. Contact us to discuss. CONTACT ARTEMIS: Steve Evans, Owner/Editor steve@artemis.bm +44 (0) 7711 244697 To download a media pack visit: www.artemis.bm/advertise/ Copyright 2014 Artemis.bm, owned by Steve Evans Ltd.
You can also read