STATE OF THE ECONOMY MID-TERM ASSESSMENT - AS AT FEBRUARY 2020 - Durban Edge
←
→
Page content transcription
If your browser does not render page correctly, please read the page content below
STATE OF THE ECONOMY
      MID-TERM ASSESSMENT
                                 “Make better informed decisions with cutting-edge economic insight”

                      AS AT FEBRUARY 2020
  Spotlight on Construction, Investment and Infrastructure Development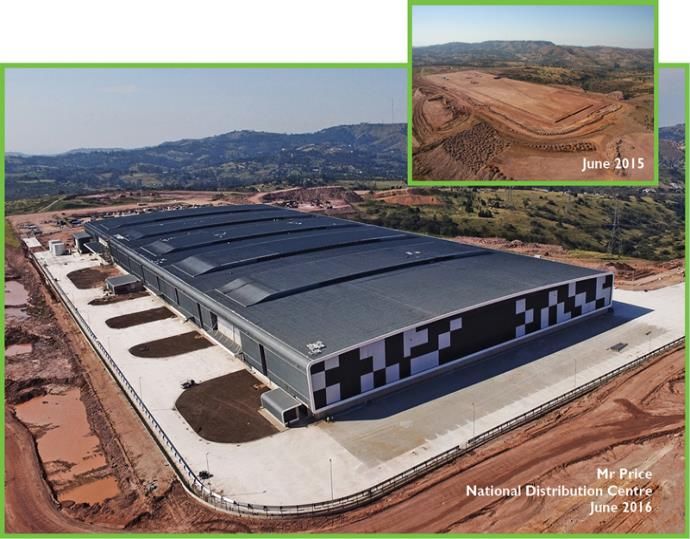
GDP PROJECTIONS
                           WORLD, SA & DURBAN (2020-2022)
GDP growth forecast has                          5,5%
been revised down due
                                                               4,2%
to multiple global waves                        3,3%
(World Bank 4,2% to                                           2,2%
                                                 2,7%
4,0%),                                                        1,4%

and revised up due to                                               Sources: IHS, 2021
                                                            RSA National Treasury, 2021
vaccinations (IMF 5,2%                                                       IMF, 2021
to 5,5%). This is
                           -5,2%
testament to general
uncertainty in global
markets.                           -7,8%

                                    2020        2021        2022
          World                    -5,2%        5,5%        4,2%
          South Africa             -7,8%        3,3%        2,2%
          Durban                   -7,8%        2,7%        1,4%
GDP PROJECTIONS OF DURBAN’S BROAD SECTORS
                         2020-2022 (CONSTANT, 2010 PRICES, R1000)
         70 000 000       Major manufacturing sectors are petroleum, food, metals. Food and metals will recover
                          fastest. Manufacturing sectors which will struggle are clothing and textiles, furniture and
         60 000 000       other sectors.

         50 000 000

         40 000 000
                                                               requires investment
         30 000 000                                            support

         20 000 000

         10 000 000

                  0
                       Agriculture     Mining     Manufacturing     Electricity    Construction    Trade       Transport   Finance   Community
                                                                                                                                      services
                                                                  2019      2020       2021       2022
  Source: IHS, 2021

Manufacturing, trade and business/ finance are the fastest recovering sectors. Construction, energy and agriculture will struggle to
recover and require more assistance.
SECOND WAVE GDP LOSSES AND GAINS PER SECTOR
                              EXTENDED LEVEL 3 FROM DEC 2020 TO JAN 2021
R150
                                      R68,3   R72,8
 R50
                                                                                               R1,4

 -R50     -R33,2    -R18,5                            -R22,0   -R30,1
                             -R93,8
-R150

-R250                                                                   -R229,0

-R350

-R450                                                                                                    -R421,6

-R550

                                                                                  -R598,1
-R650
                                                                                      Source: The Durban EDGE, 2021

        Durban’s economy is expected to lose approximately R3,59 billion in GDP during the second
                                          wave/ extended level 3.
UNEMPLOYMENT
                         Durbanites more determined to look for work, but there are still not enough jobs

                                        115 000 MORE UNEMPLOYED, BUT ONLY 49 000 MORE JOBS

                      25,0%
                                                                        22,1%                                      The Durban unemployment rate has
                                                             20,9%                                      20,5%      risen sharply from 14% in 2020 Q3 to
                      20,0%
                                                                                                                   20,5% in 2020 Q4, which translates to
                                                                                                                   115 000 more people looking for work.
Unemployment Rate %

                      15,0%                                                                  14,0%
                                                                                                                   This is drastic and suggests that Durban-
                                                                                                                   ites are now more determined to find
                      10,0%                                                        8,2%                            work.

                      5,0%                                                                                         Nonetheless, the chances of finding a
                                                                                                                   job have risen slightly as the
                      0,0%                                                                                         employment absorption rate has
                                                                                                                   increased from 42,6% to 44,6%.
                                                                                   2020 Q2
                                                              2019 Q4
                              2019 Q1

                                         2019 Q2

                                                   2019 Q3

                                                                         2020 Q1

                                                                                              2020 Q3

                                                                                                         2020 Q4
                                                                                                                                        Source: StatsSA QLFS, 2021
SONA 2021 UPDATE
KEY POINTS OF INTEREST FOR DURBAN (4 MAIN PRIORITY AREAS)

 1. a massive rollout of infrastructure throughout the country:                          3. an employment stimulus to create jobs and support
                                                                                         livelihoods,
      • Need to tap into infrastructure investment project pipeline worth R340 billion
        in network industries such as energy, water, transport and                               •   Presidential Employment Stimulus- the City’s proposals were
                                                                                                     deprioritised but new applications will be made this year.
        telecommunications.
                                                                                                 •   The City must advocate for Durban to be equally represented in
      • This includes the uMkhomazi Water Project, rehabilitation of the N3,                         national efforts to support 15,000 start-ups by 2024.
      • and other projects which will contribute to the revival of the infrastructure
        sector.
                                                                                         4. the rapid expansion of our energy               generation capacity.
                                                                                                 •   Eskom estimates shortfall of 4000-6000MGW over next 5 years, so
 2. a massive increase in local production:                                                          new (wind and solar) energy sources are being sought through a bid
                                                                                                     process. This is significant for the negative impact of loadshedding
      • Agreement to reduce reliance on imports by 20% places renewed impetus                        on the City’s economy.
        to the City’s Buy Local Invest Local Campaign.                                           •   Implementation of the City’s Energy Policy is underway (public
      • SMME Focused Localisation Policy Framework: 1000 locally produced                            participation/ finalisation still underway). First IPP contract in Durban
        products have been identified which must be procured form SMMEs.                             likely in March 2022.
        Includes incentives for import replacement.
      • Masterplans: Poultry (1million more chicken pa), sugar (85000 more               5. Other:
        workers employed), clothing, textile, footwear and leather and automotive        • Tourism: eVisas from China, Nigeria, India, Kenya and 10 other countries
        completed.                                                                           should boost tourism in Durban, albeit slightly
      • Toyota investment flagged as first production line of hybrid vehicles in SA.     •   R350 grants will continue for 3 more months, which will provide relief for poor
      • AFCTA Johannesburg Declaration                                                       households in the City

      • R773 billion in investment commitments have been made towards 5-year             •   Durban is being repositioned as a hub      port for the southern hemisphere
        target of R1.2 trillion
2021 NATIONAL BUDGET
DIRECTING THE BUDGET TO GROW THE ECONOMY
While the 2021 budget speech largely pins its hopes of SA recovery on the efficacy of the vaccine, the it places much
expenditure priority on job creation, infrastructure and economic development.
THE GOOD THE BAD THE GREEN SHOOTS:
More money being put in the pockets of Debt out of control
consumers ECONOMIC DEVELOPMENT
• Budget deficit from -6.3% of GDP to -
• No additional taxes 14% of GDP. Economic development and
• 5% shift in tax brackets- benefits mostly felt by infrastructure are critical
• Gross debt from 65.6 per cent to 80.3
low/ middle income per cent of GDP. • The fastest budget growth is
• Corporate taxes reduced by 1% to 27% general public services and
• Gross borrowing from R432.7 billion to economic development
• Support for small business and black business R670.3 billion, or from 8 to 13.6 per cent of
GDP. • And reductions on economic
• Increased expenditure on employment development are kept to a minimum
stimulus • Tax revenues R213.2 bn than projected in
the 2020 Budget.
• However the fuel levy coupled with fuel (However, even they haven’t escaped
increases will effectively increase cost • Rising debt-service costs consume R269.7
billion, or 13.4 per cent of the budget. downward revisions compared to the
burdens on ALL consumers (66c increase in 2020/21 forecasted budget.)
fuel price, incl. increases in food prices)BUDGET 2021 GREEN SHOOTS CONTD..
Industrialisation and Exports
Job creation and labour affairs Infrastructure
Road, water and env. programmes 9,3%
40,6% R36.2 billion
R33,4 billion
7,7% **AFCTA JHB declaration signed
+ (including) R11 Billion Presidential Youth
R93,1 billion
Sector Support
Employment Initiative. + R4 billion Infrastructure Fund DTI Business Incentives, SEZ, sector development
(but non fiscal support STILL necessary!)
8,2%- R17.1 billion
Investment Neighbourhood Partnership
No budget allocation but budget makes Development Grant Small Business
reference to increasing competitiveness,
EThekwini is allocated the highest NPD grant The Small Enterprise Finance Agency
cost and ease of doing business
of all metros at R61.7m
R885.3 million
loans and grants for SMMEs
Innovation Tourism Climate Resilience Township and Rural Entrepreneurship Fund
Department of Science and Innovation
The Tourism Equity Fund DEFF R1.2 billion over the R2.9 billion
R5.3 billion
R540 million MTEF period (3 years)
SMMEs in rural areas and townships.
black business in tourism businesses to support climate resilience
initiativesTOP 100 CUSTOMER DATA INSIGHTS GDP GROWTH IS A MAJOR DETERMINENT IN
CONSUMPTION, RETAINING LARGE SCALE MAUFACTURING AND RETAIL IS CRITICAL FOR CITY FINANCES
TOP CLIENTS
TOP SECTORS FOR CLIENTS
• Manufacturing
• Retail (shopping centres)
• National and Provincial gvt
• Water top clients: Engen Petroleum Ltd, Shell and
B.P., SAB, RCL Foods, Prince Mshiyeni Hospital,
Transnet, Westville Prison, Wilbat Projects AVERAGE MONTHLY CONSUMPTION*
• Electricity top clients: Shell & BP, Engen, Mondi, • Water top 100 clients: R33,9 million +/-
Toyota, A E C I Chlor-alkali & Plastics, Gateway, • Electricity top 100 clients: R340 million +/-
Pavilion, Metro Rail
• Rates top 100 clients: R1,5 billion +/-
• Rates top clients: Transnet, Gateway, ACSA, Pavilion,
JT Ross, Growth Point Properties, Tsogo Sun, KZN * Based on selected months in 2020
Housing.WHAT HAPPENS WHEN ONE OF OUR TOP CLIENTS FAIL?
THE CASE FOR INTERVENTION
Averages accrued from top manufacturing firms in a selected sector in the City
• Electricity charges: R35 million pm
• Rates charges: R550 000 pm
• Water charges: R260 000 pm
(R429,7 million on average per annum)
Average top firm’s payments in one year is approx. = the City’s capital expenditure in 2 months
(R420 million for July and August 2020).
Source: EThekwini Revenue Management System Customer Data (June 2020), 2021A RESPONSE TO THE CURRENT STATE OF
THE ECONOMY:
FOCUS ON INVESTMENT, CONSTRUCTION AND INFRASTRUCTURE
DEVELOPMENT
“Breaking ground on key infrastructure projects would be
‘immune booster’ for ailing economy”
F
Engineering News, 03/02/20211. INCENTIVISED CONSTRUCTION AND
INVESTMENT
INCREASED INVESTMENTS DUE TO WAIVED CONSTRUCTION FEES
(As recommended by eThekwini’s Economic Recovery Plan)TRENDS IN NEW CONSTRUCTION APPLICATIONS
R3,4 BILLION IN INVESTMENT PLANNED
Largest number of applications
250 recorded in Oct since 2016
Level 5 and 4 lockdown. No
200 applications received/ processed 193
Fees on applications
157 waived to stimulate
150 136 construction demand 141 142
109
100
66
48 41
50
12
0 0
0
January February March April May June July August September October November December
MAJOR/STRATEGIC DEVELOPMENTS APPROVED
RESIDENTIAL 17 008m2 R150 mn 1251
WAREHOUSING 76 884m2 R384 mn
FACTORY EXPANSIONS 7 408m 2 R107 mn completion certificates issued
TOTAL 101 300m2 R642 mnIMPACTS OF WAIVED APPLICATION FEES FOR CONSTRUCTION SECTOR
R3,4 BILLION IN INVESTMENT PLANNED
250 235
200 193
168
157 157
148 142
150 136 141 141 141
130 134 134
125
116
109
100
78
66
48
50 41
12
0 0
0
January February March April May June July August September October November December
2019 20202. PUBLIC PRIVATE PARTNERSHIPS CONTINUED FACILITATION OF CATALYTIC PROJECTS
HIGH IMPACT CATALYTIC PROJECTS FOR IMPLEMENTATION DURING
ECONOMIC RECOVERY (2020 to 2026)
Aerotropolis North Corridor                                                   Inner City Central Corridor
(iNyaninga, DTP, Whetstone)                                                   (Point Precinct, Centrum, Dbn Film City)
Investment Value = R54.1 billion                                              Investment Value = R22.5 billion
Jobs Created to date = 12 000        TOTAL ESTIMATED                          Jobs Created to date = 1 647
Total Jobs = 214 100
                                    INVESTMENT VALUE:                         Total Jobs = 97 700

                                       R217 BILLION
M4 & Umhlanga North Corridor
                                                                              N3 West Corridor
(Cornubia, Sibaya, Oceans,           TOTAL INVESTMENT                         (Keystone, Cato Ridge, Ntshongweni)
Beachwood, Virginia Airport)
Investment Value = R94 billion          R217 billion                          Investment Value = R32.5 billion
Jobs Created to date = 15 819                                                 Jobs Created to date = 3 000
                                                                              Total Jobs = 25 000
Total Jobs = 209 500               TOTAL ESTIMATED JOBS:
                                          625 400
Central/North Corridor                                                        N2 South Corridor
(Midway Crossing, Brickworks)
                                                                              (Automotive Supply Park)
Investment Value = R10.8 billion
                                                                              Investment Value = R3 billion
Jobs Created to date = 637            **Over 60 year multi project duration   Total Jobs = 7 800
Total Jobs = 71 300
‘QUICK WIN’** CATALYTIC PROJECTS AWAITING INTERVENTION
1. NTSHONGWENI PHASE 1
Investor Investment Value City Contribution Developer Contribution Start & Finish Date
Fundamentum/THD R8bn R328m R0 to bulk infra 2021-2030
ESTIMATED PROJECT IMPACT ONCE IMPLEMENTED
(over total project duration)
• Annual Rates: R500m
• GDP contribution: R8,9bn
• Jobs: 8,500
**A selection of projects which can be reasonably implemented within the
remainder of the 2020/21 financial year.‘QUICK WIN’ CATALYTIC PROJECTS REQUIRING INTERVENTION
2. OCEANS UMHLANGA
Investor Investment Value City Contribution Developer Contribution Start & Finish Date
Oceans uMhlanga Still being finalised Upgrades to transport
R4,2bn 2008 - 2068
Pty (Ltd) through Sec 116 of MFMA infrastructure
ESTIMATED PROJECT IMPACT ONCE IMPLEMENTED
(over total project duration)
• Annual Rates: R34,4m
• GDP contribution: R4,7bn
• Jobs: 21,000 construction
: 10,300 permanent‘QUICK WIN’ CATALYTIC PROJECTS REQUIRING INTERVENTION
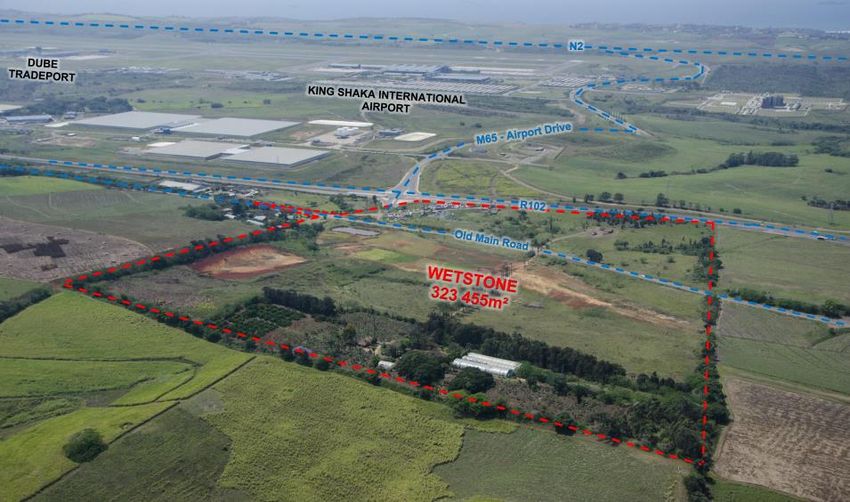
3. WHETSTONE
Investor Investment Value City Contribution Developer Contribution Start & Finish Date
Electricity link
Cedar Point Trading R2,1bn R5,5m 2020 - 2030
infrastructure
ESTIMATED PROJECT IMPACT ONCE IMPLEMENTED
(over total project duration)
• Annual Rates: R45m
• GDP contribution: R779 mn
• Jobs: 1,650 construction
: 1,000 permanent‘QUICK WIN’ CATALYTIC PROJECTS REQUIRING INTERVENTION
4. KEYSTONE
Investor Investment Value City Contribution Developer Contribution Start & Finish
Date
Rokwil R6,5 billion R0m Est. R480m 2015 - 2023
ESTIMATED PROJECT IMPACT ONCE
IMPLEMENTED
(over total project duration)
• Annual Rates: R179m
• GDP contribution: R7,2 bn
• Jobs: 6,5003. OTHER MAJOR INVESTMENTS
ATTRACTING FOREIGN DIRECT INVESTMENTS
“R3,5 billion in FDI attracted in 2020/2021”
FFOREIGN DIRECT Despite COVID, ▪ Toyota is Durban’s main
investment attracted in 2020
INVESTMENT(FDI) GAINS IN R3,5 bn in (R2,43 bn).
DURBAN’S ECONOMY
FDI attracted ▪ Number of announced projects:
In 2020, Durban experienced a
in 2020/2021 financial year significant decline of 71%
compared to the previous year
Sector Company Value Project Type
Automotive Toyota South Africa Motors R2.43b Expansion underway; COVID linked FDI Aftercare
Agri-processing Kerry Foods R800m Expansion underway; COVID linked FDI Aftercare
Chemicals H&R Africa R200m Expansion underway; COVID linked FDI Aftercare
Property Development JK Props UK R100m New - still a WIP
Agri-processing SAPPI R7bn Expansion underway; COVID linked FDI Aftercare
ICT ONDO Smart Farming Solutions TBA New - still a WIP
Property Development Anchor Properties R150m Expansion underway; COVID linked FDI Aftercare
Ignition, Capability BPO, Outworx,
Global Business Services Blake, Synergy, CCI, Miracle R800m Expansion - Still a WIP
Communications
ICT/Electronics Conlog R250m Expansion completed; COVID linked FDI Aftercare
Property Development Gap Prop Inner City JV/PPP TBA Expansion - Still a WIP
Agri-Tech Crop Data India TBA Expansion - Still a WIP
Sub Total R12.43bn4. MUNICIPAL CAPITAL EXPENDITURE
SPENDING ADJUSTED CAPITAL BUDGET FOR ETHEKWINI MUNICIPALITY
IN 2020/2021 FINANCIAL YEAR (R5,42bn)
F
ESTIMATED IMPACT OF MID-TERM CAPITAL EXPENDITURE:
R1,9billion contribution to GDP I 2,100 operational jobs I 1,800 construction jobsTHE ECONOMIC IMPORTANCE OF THE CITY’S CAPITAL EXPENDITURE
ECONOMIC IMPACT AT MID –TERM [July to December 2020]
EThekwini Municipality's mid term capital expenditure of R1.6 billion was mainly spent through
infrastructure projects, and contributed:
• R1.9 billion to the Durban’s GDP (this is an additional increase of 0.5% to the City’s annual GDP, although this was offset by production
losses encountered during lockdown levels) and 3 900 jobs (2100 operational and 1800 construction).
Operational Impact Construction Impact
2 071 operational jobs. 1 835 temporary jobs.
This would have expanded the This would have expanded the
annual labour market by 0.2% 2020 GDP losses offset by annual labour market by 0.17%
2020 GDP losses offset by
however expansions were R941mn however expansions were offset
R997mn offset by job losses due to
o Counts 0,31% of annual GDP by job losses due to lockdown
o Counts 0,33% of annual GDP lockdown levels
o Almost 60% is derived from levels
o 92% is derived from financial &
business services, trade, Distribution of skill levels: construction and Distribution of skill levels:
transport & manufacturing o High - 20% manufacturing o High - 20%
sectors o Middle – 49% o Middle– 44%
o Low - 31% o Low - 36%CONTD… DETAILED ECONOMIC IMPACT
Construction phase impact Operational phase impact
High impact - Moderate impact- Low impact
GDP Jobs GDP Jobs
Impact per sector Impact per sector
Impact created Impact created
Agriculture 1% 2% Agriculture 2% 3%
Mining 0% 0% Mining 0% 0%
Manufacturing 21% 16% Manufacturing 11% 8%
Electricity & water 0% 0% Electricity & water 2% 1%
Construction 36% 51% Construction 3% 8%
Trade & accommodation 7% 9% Trade & accommodation 21% 22%
Transport & communication 10% 3% Transport & communication 19% 4%
Financial & business services 18% 6% Financial & business services 41% 53%
Community services 6% 12% Community services 0% 0%
Household income in R’ millions NOTE: All impacts are captured in gross values and must be
• Construction phase = R383 increase
• Income levels: H=R242 M=R80 L=R61 increase interpreted as one contributor to final GDP/ jobs/ household income.
• Operational phase = R367 increase E.g. GDP would have declined by an estimated 8,3% in 2020.
• Income levels: H=R226 M=R82 L=R59 increase However, this was offset by the City’s capital expenditure contribution
0,5% to GDP, resulting in an estimated GDP growth of -7,8%.CONCLUSIONS
• eThekwini economy is expected to have • The municipality’s main revenue generators are:
declined by 7.8% in 2020 – Manufacturing,
– Retail and
• Durban’s economy is expected to lose – National Govt/SOEs
approximately R3,59 billion in GDP during the
second wave/ extended level3. • Fast tracking the implementation of Catalytic Projects
is biggest programme in the Municipality’s control to
• Biggest losses have been in manufacturing, grow its revenue and create jobs
trade, construction and travel and tourism
• FDI and Investment is an important contributor to
respectively development
• 115 000 more people were unemployed in the
• Despite COVID, R3,5 bn in FDI attracted in 2020/2021
final quarter of 2020; while only 49 000 were financial year
able to find work.
Support required by top political and executive leadership
• eThekwini economy is expected to grow by • Engagement with key stakeholders like Transnet, DOL, SARS, DTIC to accelerate practical
economic recovery measures
2.7% in 2021 and 1.4% in 2022 • More frequent engagement with a greater number of "Anchor Investors" in key sectors
• Public support on "Business" Forums, & swift responses to SOS calls where necessary
• A more strategic & impactful budget allocation to "Economic Profit Centre Units" who
secure investmentAREAS OF SUPPORT FROM OTHER SPHERES OF GOVERNMENT
WHICH WILL ASSIST IN DURBAN’S ECONOMIC RECOVERY
1. Second access to the port is required urgently
2. Provide simpler framework for private sector partnerships in bulk infrastructure provision
3. Assistance in developing a best practice model to move to electricity security for the City
4. Housing subsidy model - realigned and directed towards higher density settlement (higher densities
create thresholds for economic activity)
5. Simpler compliance and government interaction environment for small business
6. Disjuncture between port operations and head office creates breakdown in communication
7. Assistance from NT and DTIC to develop and implement a plan to grow alternate industries amid a
declining petrochemical sector.
8. Unlocking red tape related to regulatory processes (e.g. EIA, TIA, WULA, Act 70 of 70, etc) and budget
commitment to accelerate implementation of Catalytic Projects. N3 West Corridor (Keystone, Cato
Ridge and Ntshongweni), N2 South Corridor (ASP), and M4 North (Sibaya, Whetstone, Dube Trade Port)
9. Review mandates and functions of metro cities to factor in global good practice“Make better informed decisions with cutting-edge economic insight”
You can also read