Sapporo Group Business Results Presentation for the Three Months Ended March 31, 2019 - May 9, 2019
←
→
Page content transcription
If your browser does not render page correctly, please read the page content below

Sapporo Group Business Results Presentation
 for the Three Months Ended March 31, 2019

                                                               May 9, 2019
                                  URL ttps://www.sapporoholdings.jp/english

                                         Copyright, 2019 SAPPORO HOLDINGS LTD. All rights reserved.   1/36
First-Quarter 2019 Highlight
Although revenue from Japanese alcoholic beverages and soft drinks declined, profits increased
thanks to cost control and sale of investment property
(billions of yen)
YoY change YoY change
YoY change Profit attributable to owners of
Revenue Operating Profit parent
0 0
2017 1Q 2018 1Q 2019 1Q 2017 1Q 2018 1Q 2019 1Q 2017 1Q 2018 1Q 2019 1Q
Sales of the alcoholic beverage business declined Profit of the alcoholic beverage business in Japan
year on year due to absence of year-earlier and Asia improved ¥0.5 billion thanks to cost
Loss reduced by ¥0.7 billion, as operating profit
temporary demand ahead of commercial-use control and improvement in product mix
improved.
alcoholic beverage price increase Profit of food & soft drinks business in Japan and
Asia declined ¥1.3 billion reflecting sales decline.
Soft drink sales declined, primarily in Japan Sale of Yebisu Square resulted in a ¥1.9 billion
gain
*All figures are based on IFRS
Copyright, 2019 SAPPORO HOLDINGS LTD. All rights reserved. 2/36
First-Quarter 2019 Highlight
(billions of yen)
Balance of Net debt Equity Cash basis investment
End of 2018 End of 2018
2019 plan
2019 1Q 2019 1Q
YoY change
D/E ratio (Net) times -0.1 times
Transformation of the Group
Group Topics
management platform
Demonstrated improvement of sleep quality with “SBL88 lactic acid bacteria” (see
p.15)
Certified as “2019 Excellent Enterprise of Health and Productivity Management- Creating a foundation for development of personnel specialized in logistics with
White 500” “Sapporo Logistics University”
Started “Can Stars,” an in-house community for employees who have or have had
cancer
Held “SPIRAL UP!” a diversity forum co-sponsored by six food companies
Copyright, 2019 SAPPORO HOLDINGS LTD. All rights reserved. 3/36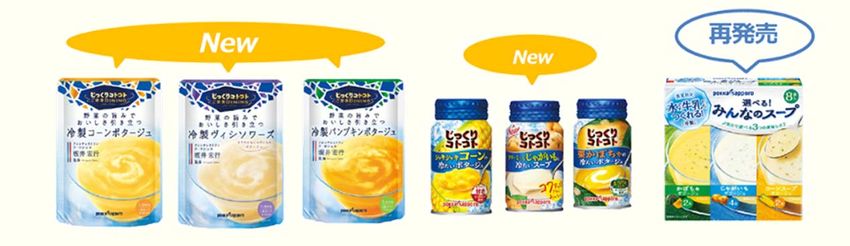
Revenue by Segment                                                                                   2019
                                                                                                  (billions of yen)

                          2018          2019         YoY changes                     YoY changes
                          1Q            1Q            (amount)                           (%)

   Revenue by Segment      111.3                                                          (2.3)%
    Alcoholic Beverages      67.7                                                       (3.9)%
       Japan & Asia              51.1                           (2.4)                            (4.7)%
       North America             10.5                           (0.2)                            (1.7)%
       Restaurants                6.1                           (0.0)                            (0.8)%

    Food & Soft Drinks       36.3                                                                0.1%
        Japan & Asia             29.3                           (0.8)                            (2.6)%
       North America              7.1                             0.8                             11.2%

    Real Estate                  6.0                                                             1.1%
    Other                        1.3                             0.0                             1.8%
                                               Factors are explained
                                                 in the next slide Copyright, 2019   SAPPORO HOLDINGS LTD. All rights reserved.   4/36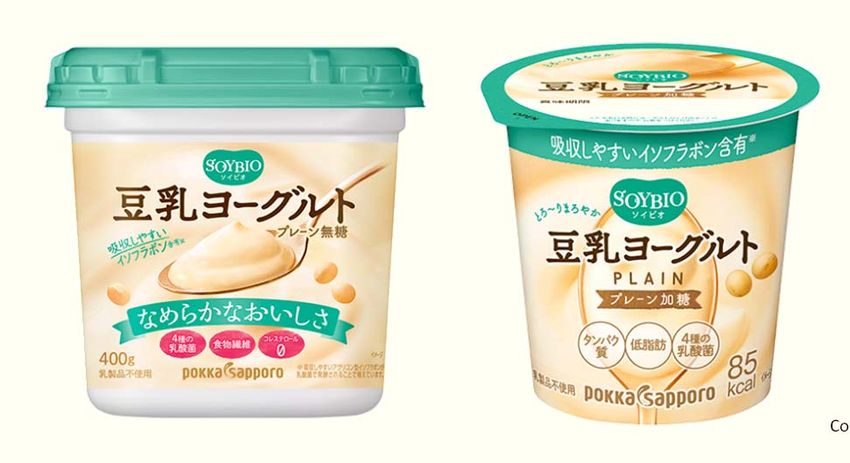
Main Factors Contributing to Changes in Revenue

   Revenue declined due to decreased sales volumes in food and soft drinks in Japan and happoshu/new genre
                                                                                                                                                             = Increase

  (billions of yen)                                                                                                                                          = Decrease

                           Alcoholic Beverages                           Food & Soft Drinks                         Real Estate
  2018
   1Q

                                                                                                                                                                     2019
                                                                                Including                                                                             1Q
                                                                                foreign exchange +0.1

                                                 Including
                                                 foreign exchange -0.2

                                                                                                        Copyright, 2019 SAPPORO HOLDINGS LTD. All rights reserved.   5/36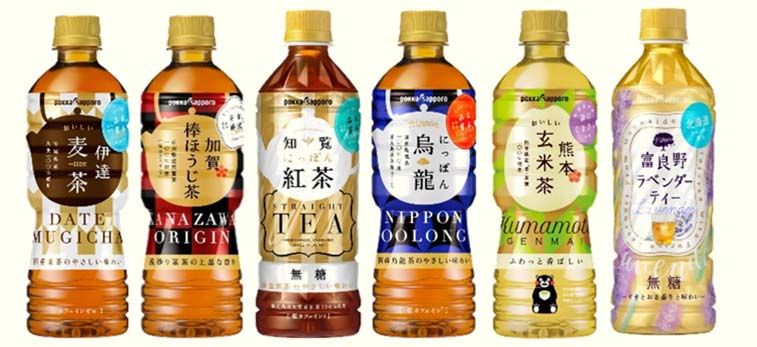
Operating Profit byOperating
                    Segment Profit by Segment                                                      2019
                                                                                                (billions of yen)

                                  2018      2019   YoY changes                YoY changes
                                   1Q        1Q     (amount)                      (%)
 Operating Profit by
 Segment                           (5.5)                                                           -
      Alcoholic Beverages          (3.9)                                                            -
         Japan & Asia               (3.0)                   0.7                                     -
         North America              (0.2)                 (0.2)                                     -
         Restaurants                (0.5)                   0.2                                     -
      Food & Soft Drinks           (1.2)                                                            -
          Japan & Asia              (1.0)                 (1.3)                                     -
          North America             (0.2)                   0.1                                     -
      Real Estate                    1.1                                            173.5%
      Other                        (0.1)                                                 -
        General corporate and
      intercompany eliminations    (1.5)                                                           -
                                                                  Copyright, 2019 SAPPORO HOLDINGS LTD. All rights reserved.   6/36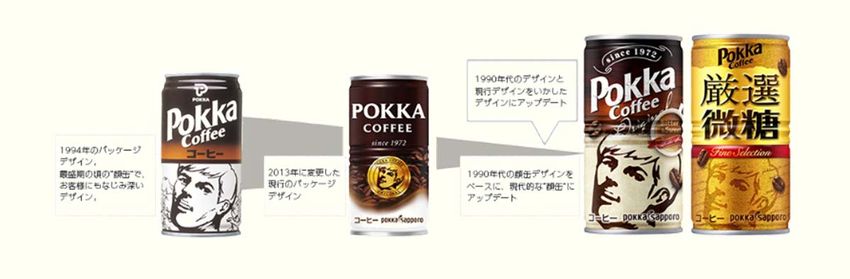
Main Factors Contributing to Changes in Operating Profit
              Profit increased, as improvement in product mix of alcoholic beverages, control of sales
              promotion costs, and gain on sale from real estate securitization offset the profit decline at the
              Food & Soft Drinks Business.
                    (billions of yen)                                Alcoholic Beverages                                    Food & Soft Drinks                   Real Estate
       2018                                                                                                                                                                                                   2019
        1Q                                                                                                                                                                                                     1Q

                                                         Sales promotion costs                                                                                  Proceeds from
                                                         +0.3                                                       Sales volume -0.7                           sale of Yebisu
                                                                                                                    Production cost -0.3                        Square +1.9
                          Product mix +1.1
                          Non-alcoholic beer & RTD +0.6
                          Other -0.1

                                                                                                                                                                                                       = Increase

                                                                                                                                                                                                      = Decrease

*Reclassification under IFRS: Other non-operating revenues and expenses as well as extraordinary income and loss.
                                                                                                                                                 Copyright, 2019 SAPPORO HOLDINGS LTD. All rights reserved.    7/36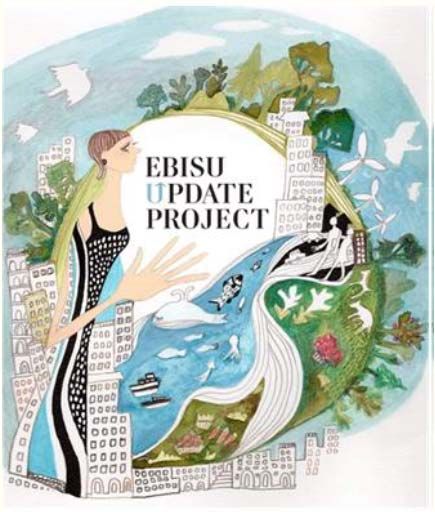
Alcoholic Beverages

                                  Situation in 1Q                                                          Future initiatives, etc.

 Positive                                                                             (1) Shift to more proactive sales promotion of Black Label from April 1,
                                                                                          following relaunch. Introduced the limited version of
                                                                                          Yebisu beer (Fukkoku Tokusei Yesbisu) to capture demand from
            (1) Continued to strengthen beer in Japan                                     celebrations associated with the Japanese imperial era name change.
            Sales of both Black Label and Yebisu canned products increased
                                                                                      (2) We aim to expand the scale of RTD with 99.99 at the core and
            (2) Expanded presence of RTD (up 104% year on year)                       introduction of Lemon the Rich.

                                                                                      (3) While there is a trend towards narrowing of SKU in the U.S. retail
            (3) Sapporo Premium grew in North America                                 market, the high level of presence in the Asian market has served as a
                                                                                      favorable tailwind.
                                                                                      We will strengthen the brand and further expand sales.

                                                                                      (4) The impact of temporary demand will gradually fade away.
            (4) Sales of keg and bottled products fell year on year due to absence
            of year-earlier temporary demand ahead of price increase for              (5) New genre has been performing in line with the initial plan.
            commercial-use products                                                      The limited version of Mugi to Hop (Mugi to Hop Honjuku)
                                                                                        has been performing strongly and has exceeded projections.
            (5) Sales of new genre products fell short of the previous year’s level      We aim to reach the projected level by building up sales of Honkaku
                                                                                         Karakuchi.
            (6) Stagnation in the beer market in San Francisco continued.
            Anchor had a difficult time                                               (6) Sapporo USA and Anchor integrated management on April 1.
                                                                                      While market conditions are expected to continue to be difficult, we are
                                                                                      steadily working on structural enhancement.
 Negative
                                                                                                                Copyright, 2019 SAPPORO HOLDINGS LTD. All rights reserved.   8/36
Food & Soft Drinks

                               Situation in 1Q                                                     Future initiatives, etc.

 Positive
                                                                                (1) We will continue with aggressive sales of products including
                                                                                commercial-use products and strive to expand the market.
            (1) Lemon-based food products continue to be strong (up 19%)
                                                                                (2) Plan to introduce new soymilk yogurt products
            (2) The soymilk yogurt plant construction in Gunma completed        We will embark on full-fledged sales expansion in conjunction
                                                                                with the start of in-house production.
            (3) Promoted the restructuring of the overseas soft drinks (Asia)
            business                                                            (3) In Indonesia, we are shifting to a scheme where DIMA sells
                                                                                Pokka brand products and receives royalty income
            (4) Signs of improvement in North American soft drinks.
                                                                                (4) Food Service (FS) grew and production efficiency is
            Profitability in sight
                                                                                gradually improving. We are aiming to become profitable with
                                                                                FS as the core.

            (5) Sales of soft drinks and soup products in Japan                 (5) We will promote new products etc. in the lead-up to the peak
            declined                                                            season.

 Negative
                                                                                                       Copyright, 2019 SAPPORO HOLDINGS LTD. All rights reserved.   9/36
Real Estate

                               Situation in 1Q                                                Future initiatives, etc.

 Positive
                                                                          (1) Aim for stable growth through measures to increase value and
                                                                          regular maintenance and repair
            (1) The mainstay properties maintained high occupancy rates
                                                                          (2) Continue to promote urban development through strategic
                                                                          reshuffling of property portfolio
            (2) We booked 1.9 billion yen gain on sale of Yebisu Square
                                                                          (3) We will promote the charms of the Ebisu area online as part of
            (3) New business EBISU UPDATE PROJECT launched
                                                                          a “digital urban development” initiative and aim for monetization.
                                                                          (see p.35)

            -Nothing of note

 Negative
                                                                                                   Copyright, 2019 SAPPORO HOLDINGS LTD. All rights reserved.   10/36
Special factors in the business results
Impact of exchange rates on operating profit is minimal
Impact on Impact on -: negligible impact
Business segment Details
revenue operating profit
Income
Food & Soft Yasuma Co., Ltd. statement to be
〃
Drinks Consolidated from 1Q of 2019 *Balance sheet only consolidated
from 2Q
*Average rates for the quarter
2018 2019 Impact on Impact on
1Q 1Q revenue operating profit
$US ¥108.23 ¥110.23 Alcoholic Beverages
Approx.
-
-¥0.2 billion
EUR ¥133.15 ¥125.16 Approx.
Food & Soft Drinks -
+¥0.1 billion
$CAN ¥85.62 ¥82.96
$SG ¥82.10 ¥81.37
Copyright, 2019 SAPPORO HOLDINGS LTD. All rights reserved. 11/36Changes in Balance sheets
Total assets decreased ¥14.2 billion from year end
Total assets (billions of yen)
Total assets
Cash and cash equivalents
10.0
Trade receivables 12.3
Current assets
→Seasonal factor 93.3 72.2 YoY change
-12.2
Inventories 37.1 42.5
13.1 14.4
Other current assets 164.7 165.4
Fixed assets
Non-current assets
YoY change
215.5 209.5 -2.0
Investment property
→Sale of Yebisu Square
Goodwill 21.2 21.2
84.7 88.1
Other non-current asssets End of 2018 End of 2019 1Q
Copyright, 2019 SAPPORO HOLDINGS LTD. All rights reserved. 12/36Changes in Balance sheets
Total liabilities declined ¥15.7 billion from year end, total equity increased ¥1.6 billion
Trade payables Total liabilities and (billions of yen)
equity Total liabilities and
equity
Short-term financial liabilities
35.3 34.5
73.9 Current liabilities
Other current liabilities 83.8
YoY change
→Decline in liquor taxes payable -1.5
105.4
94.8
Long-term financial liabilities
→Transfer to short-term financial liabilities
154.5 146.0
Net defined benefit liabilities Non-current liabilities
YoY change
11.7 6.2 -14.2
Other non-current liabilities 94.2 94.0
Equity
Equity attributable to owners of 161.5 163.5 YoY change
parent
+1.6
3.2 2.8
Non-controlling interests End of 2018 End of 2019 1Q
Copyright, 2019 SAPPORO HOLDINGS LTD. All rights reserved. 13/36Financial Status
Investment on a cash basis was ¥7.8 billion
①
about ¥ billion in consolidated total
(billions of yen) (Property, plant and equipment/intangible assets)
60 ・“Alcoholic Beverages,” “Food,” and “Soft Drinks”-related:
about ¥2.6 billion
Domestic beer plant system updating work: About ¥0.9 billion
50 Capital investment at Sleeman: About ¥0.1 billion
Pokka plant facilities-related: About ¥0.5 billion and so on
・Group-wide infrastructure optimization, etc.:
¥0.7 billion
40 ②
42.9
about ¥ billion in consolidated total
Cash flow from ③ about ¥ billion in
30 investment activities:
consolidated total
*Excluding lease fees for renting restaurant outlets
¥ billion
20 40.2 planned over four-year period ④ about ¥ billion in
36.5 (¥50.7 billion planned in 2019) consolidated total
31.0 32.7
(including long-term prepaid expenses, investment
securities, etc.)
10
①+②+③+④
7.8 (cash basis; including recurring capital expenditure and
0 lease fees)
2015 2016 2017 2018 2019 2020
about ¥ billion
(full year) (full year) (full year) (full year) (1Q) (full year)
Copyright, 2019 SAPPORO HOLDINGS LTD. All rights reserved. 14/36Transformation of the Group management platform
R&D Demonstration of improvement in sleep quality with SBL88 lactic acid bacteria
In clinical trials, we were able to confirm improved sleep quality as an additional health function of our proprietary functional food
ingredient SBL88 lactic acid bacteria. The trials showed reduced sleepiness at the time of rising and improved recovery from fatigue
felt when getting up in subjects who took the test food containing SBL88 lactic acid bacteria for four weeks.
We carried out a randomized double-blind*3 placebo-controlled parallel group comparison study involving 220 healthy adult males
and females, who were dissatisfied with the quality of their sleep. The test food product was given to half of the subjects with the
rest consuming a placebo*4 food product for four consecutive weeks, and we assessed their OSA-MA*5 scores, sleep evaluation,
and subjective symptoms (AIS, JESS, BDI-II, and VAS method) before and after taking the food products.
[Main outcomes]
The trial confirmed that after four weeks the group given the test food product had reduced sleepiness and improved recovery from
temporary fatigue when getting up compared with the group given the placebo food products (202 cases were analyzed). The
findings appeared in the Japanese Pharmacology & Therapeutics magazine (vol.46 no.10., 2018).
*3 A double-blind experiment is one in which neither experiment subjects nor those
Score for recovery from
implementing the experiment know which items the subjects are being assigned.
the time of rising (points)
Score for drowsiness at
*4 The placebo was a food product with the same appearance and taste as the test
food product but that did not include the functional component being tested.
fatigue (points)
*5 A psychological scale for introspective evaluation of sleep at the time of rising.
Placebo Placebo
Copyright, 2019 SAPPORO HOLDINGS LTD. All rights reserved. 15/36Appendix
Copyright, 2019 SAPPORO HOLDINGS LTD. All rights reserved. 16/36Appendix: 2018 1Q ( Previous yearʼs result ) Conversion Table of Revenue, Operating Profit by Segment
Former segments New segments
*( ) denotes new segment (5 business domain (3 business domain Difference Remarks
structure) structure)
Revenue (billions of yen) 111.3 -
Japanese Alcoholic Beverage
(Alcoholic Beverages) 50.8 16.9
・North American alcoholic beverages and Vietnam
moves to Alcoholic Beverages \10.7 billion
International (-) 17.8 (17.8) ・North American soft drinks moves to Food & Soft
Drinks \7.1 billion
Food & Soft Drinks
(Food & Soft Drinks) 27.8 8.5
Restaurants 6.1 (6.1) ・To Alcoholic Beverages \6.1 billion
Real Estate (Real Estate) 6.0 0.0
・Shinshu-ichi Miso moves to Food & Soft Drinks
Other 2.8 (1.5) \1.5 billion
Former segments New segments
(5 business domain (3 business domain Difference Remarks
structure) structure)
Operating profit (5.5) -
Japanese Alcoholic Beverage
(Alcoholic Beverages) (3.1) (0.8)
・North American alcoholic beverages and Vietnam
moves to Alcoholic Beverages \-0.2 billion
International (-) (0.4) (0.4) ・North American soft drinks moves to Food & Soft
Drinks \-0.2 billion
Food & Soft Drinks
(Food & Soft Drinks) (1.0) (0.2)
・To Alcoholic Beverages \-0.5 billion
Restaurants (0.5) 0.5
Real Estate (Real Estate) 1.1 -
・Shinshu-ichi Miso moves to Food & Soft Drinks
[Corporate] Other (1.6) - \-0.0 billion
Copyright, 2019 SAPPORO HOLDINGS LTD. All rights reserved. 17/36Appendix:Major sales & sale volume
Copyright, 2019 SAPPORO HOLDINGS LTD. All rights reserved. 18/36Appendix:Alcoholic Beverages (Japan)
<Y-o-y change in sales volume of
【Beer】(Sales volume) 3 core brands>
%
Jan-Mar down % y-o-y 110
100
Black Label brand total down % y-o-y
(Sales of the canned version: up % y-o-y )
90
80
Yebisu brand total down % y-o-y
70
Jan Feb Mar
【Happoshu and new genre】(Sales volume) Total beer demand Sapporo total
Black label Yebisu
Jan- Mar down % y-o-y
Mugi to Hop brand total down % y-o-y
%
120
【Wine, Spirits and other】
(Sales revenue)
100
Wine:down % y-o-y
80
RTD:up % y-o-y
60
Spirits :up % y-o-y Jan Feb Mar
Japanese liquor:down % y-o-y Total new genre demand Mugi to Hop
Copyright, 2019 SAPPORO HOLDINGS LTD. All rights reserved. 19/36Appendix:Alcoholic Beverages (Japan)
<3 core brand Jan- Mar Sales volume change> <Beer lineup ( Jan- Mar break down)>
400
350
13%
300
25%
250
200
150
100 62%
50
0
Black label Yebisu Other
2013 2014 2015 2016 2017 2018 2019
Black label brand total Yebisu brand total
Mugi to Hop brand total
Copyright, 2019 SAPPORO HOLDINGS LTD. All rights reserved. 20/36Appendix:Alcoholic Beverages (Japan)
<Jan- Mar Sales revenue> ※incl. liquor tax <Jan- Mar sales breakdown by category>
60.0
(Billions of yen)
9%
50.0
4%
40.0 19.3 8% Beer
13.9 12.7 11.7
13.8 14.4 9.7
Happoshu & New genre
30.0
Wine & Spirits
20.0
Japanese liquor
28.2 29.9 27.8 29.3 31.1 30.9 30.3 19% 60%
RTD & Non-alcoholic
10.0
beer
0.0
2013 2014 2015 2016 2017 2018 2019
*before subsidiary companies sales, elimination of
inter- company transactions and rebate deduction
Beer Happoshu & New genre
Copyright, 2019 SAPPORO HOLDINGS LTD. All rights reserved. 21/36Appendix:Alcoholic Beverages (Japan)
<Jan- Mar Sales revenue> (Billions of yen)
3.5 4.5
4.0
3
3.5
2.5 3.0
1.7
2 1.6 1.7 2.5
1.5 1.6 1.6
1.5
1.6 2.0 4.0
1.5
1 1.0
1.4 1.5 1.9
0.5 1.1 1.2 1.1 1.1 1.1 0.9 0.5 0.5 0.9 0.9 1.0
0 0.0
2013 2014 2015 2016 2017 2018 2019
2013 2014 2015 2016 2017 2018 2019
Japanese wine Imported wine RTD
2
4
1.8
1.6 3.5
1.4 3
1.2 2.5
1 1.9 2
0.8 1.7 3.5 3.6 3.8 3.8
1.4 1.5 2.9 3.3
0.6 1.2 1.3 2.7
1 1.1 1
0.4
0.2 0.5
0 0
2013 2014 2015 2016 2017 2018 2019 2013 2014 2015 2016 2017 2018 2019
Spirits Japanese liquor
Copyright, 2019 SAPPORO HOLDINGS LTD. All rights reserved. 22/36Appendix:Major New Alcoholic Beverages (Japan) Product Launches in Jan, Feb, and Mar
*incl. improved products (*1)
YEBISU Premium Ale
RTD
Sapporo Chu-Hi 99.99⟨Four nine⟩
Left:Lime
Sapporo Draft Beer Black Label(*1) Mugi to Hop Honjuku Right:Citrus RTD
Rirakusu(*1)
Sapporo Magnum
Import wine
Beringer tunnel of elms
RTD RTD
Ai no Skal Plum wine cocktail
Goldenpine sour Umekaku (*1)
Domestic wine
Domestic wine
Copyright, 2019 SAPPORO HOLDINGS LTD. All rights reserved. 23/36Appendix:Alcoholic Beverages (Japan)
A Black Label campaign involving gifting consumers with beer glasses that they could select from a
range of 41 different designs won an award at the Japan Promotion Planning Contest*
The award was given in recognition of the fact that the project was befitting of Sapporo Breweries, which
emphasizes the creation of “spaces in which people can experience the brand.”
The award is given to outstanding sales promotion initiatives judged based on the following three points:
① The quality of the idea behind the initiative and quality of its execution
② The quality of tools used (attractiveness, design, technology, thoroughness, and safety)
③ Newsworthiness and freshness
The project succeeded in promoting sales by encouraging consumers to try the brand,
and contributed to sales of Black Label canned products, which have increased for four straight years
despite sluggish total demand.
*A contest sponsored by Business Guide-Sha, Inc.
Copyright, 2019 SAPPORO HOLDINGS LTD. All rights reserved. 24/36Appendix:Alcoholic Beverages (Japan)
Sapporo Chu-hi 99.99 won the Superior Hit Product Award in the alcoholic beverage division
of the Hit Food Product Awards
-Rated highly by retail chain operators and wholesalers. Won the award for the second year
running-
The product received the excellence award in the alcoholic beverage division of the 37th Hit Food Product Awards
sponsored by the Japan Food Journal. This is the second consecutive year the Company has won the award
after winning with Ai no Skal White Sour last year.
Prominent supermarkets, wholesalers, co-ops, etc. around the nation serve as monitors for selecting the candidate products and
also serve as selection committee members. The 99.99 is rated highly by distribution chain operators and wholesalers.
Copyright, 2019 SAPPORO HOLDINGS LTD. All rights reserved. 25/36Appendix:Alcoholic Beverages (Overseas)
【Overseas brand】 (Products of Sleeman and Anchor) <Trend of overseas sales volume ( Jan- Mar)>
(10,000 cases)
Jan-Mar down % y-o-y *sales volume
350
【Sapporo brand】
300
Jan- Mar down % y-o-y *sales volume
250
【Vietnam】
200
Jan- Mar up %(including export)
150 289
<Y-o-y change in domestic sales volume in Vietnam 268 279
256 250 257 259
120% 100
134 146 149 141
100% 131
50 111 103
80%
0
60%
2013 2014 2015 2016 2017 2018 2019
40%
Sapporo brand Sleeman brand Sleeman +Anchor
20%
0%
17.1Q 17.2Q 17.3Q 17.4Q 18.1Q 18.2Q 18.3Q 18.4Q 19.1Q Copyright, 2019 SAPPORO HOLDINGS LTD. All rights reserved. 26/36Appendix:Alcoholic Beverages (Overseas)
<Sleeman:Sales revenue in local currency (Jan- Mar)> <Sapporo U.S.A.& Anchor:Sales revenue in local currency (Jan- Mar)>
*before elimination of inter- company transactions *before elimination of inter- company transactions
120 25
J GAAP IFRS
(Excluded liquor (Included liquor
tax) tax) Acquired Anchor
100
20
80
15
60
103 106 107
10 20 20
40
69 71 15 15 15 15
63 65 64
12 13 14 13
52 54 11
43 48 5 10
20
0 0
2008 2009 2010 2011 2012 2013 2014 2015 2016 2017 2018 2019 2008 2009 2010 2011 2012 2013 2014 2015 2016 2017 2018 2019
SLEEMAN(Can$ million) USA(US$ million)
Copyright, 2019 SAPPORO HOLDINGS LTD. All rights reserved. 27/36Appendix:Alcoholic Beverages (Restaurants)
<Trend of Sales revenue and number of Sapporo Lion outlets>
(Billions of yen)
<Sapporo Lion outlets > As of Mar 31, 2019
※before rebate deduction
8.0 220
7.0 200
6.0
5.0
186 188
179 180 7 10 Tokyo
174
4.0
170 170
162 160 14 Metroporitan
3.0
4 Kanto (excl. Tokyo)
5.5 5.4 5.4 5.4 5.5 5.2 5.3 140
2.0
1.0 120 162 Outlets Hokkaido
0.0 100
2013 2014 2015 2016 2017 2018 2019
Tohoku
24 78
Sales revenue Number of outlets Nagoya
25
<Total number of outlets>
<Brands>
162 Sapporo Lion
8 New Sanko
189 outlets
Marushinkawamura
18 Singapore
1 Copyright, 2019 SAPPORO HOLDINGS LTD. All rights reserved. 28/36Appendix:Food & Soft Drinks
<Japanese soft drinks
POKKA SAPPORO Food & Beverage
Sales composition by sales channel (Jan- Mar)>
【Lemon based-drinks】 【Lemon-based food products】
Jan-Mar down % y-o-y Jan-Mar up % y-o-y 46%
(Sales volume)
(Sales volume)
8.19million Vending machines
Retailer
cases
【Unsweetend tea drinks】 【Soups】 54%
Jan-Mar down % y-o-y Jan-Mar down % y-o-y ※Vending machines (end of Mar.)
(Sales volume) own brand machines : about 80,000
(Sales volume)
+ Multi-brand machines
< Japanese soft drinks
Sales composition by genre (Jan- Mar)>
【Coffee drinks】 【Soy milk, chilled products】
Jan-Mar down % y-o-y Jan-Mar down % y-o-y
18% Coffee drinks
(Sales volume) (Sales volume)
20%
Lemon-based
4%
8.19million drinks
Tea drinks
Carbonated
15% cases
【U.S. Soft drinks 】 Water
Jan-Mar up % y-o-y 28% 15% Other
(Sales revenue after elimination of inter-company transactions)
Copyright, 2019 SAPPORO HOLDINGS LTD. All rights reserved. 29/36Appendix:Food & Soft Drinks
< Food & Soft Drinks segment 【Pokka Create Co., Ltd.】
Revenue break down by geographic area>
Jan- Mar Sales revenue billion
unchanged y-o-y
82%
<Number of outlets as of Mar. 31, 2019:197>
18%
110
53 197 East Japan
Central Japan
Japan Overseas
outlets West Japan
< Japanese soft drinks <Overseas soft drinks Decreased 5 outlets compared with
2018 4Q
POKKA SAPPORO Food & Beverage POKKA Corporation (Singapore) 34
Sales composition (Jan- Mar)> (East -3, Central -3, West+1)
Sales composition (Jan- Mar)>
3% )
28% 109
¥16.0 28% 50 197 Directory operated
billion SG$ million
88 outlets FC
69% 72% Decreased 5 outlets compared with
2018 4Q
(Directory operated +1, FC -6)
Soft drinks Food Soy and Chilled product Singapore Export Copyright, 2019 SAPPORO HOLDINGS LTD. All rights reserved. 30/36Appendix: Major New Food & Soft Drinks (Japan) Product Launches in Jan, Feb, and Mar *incl. improved products (*1)
Ingredients and tea leaves Process
from various parts of Japan Strong emphasis on manufacturing
The products use rare ingredients processes and craftsmanship
and local specialty products Yasashiku, Shimikomu Mizu to Lemon Hokkaido Yubari Melon Soda Hita no Nashi
Producers Local cultural traditions
Collaboration with local communities
The faces and passion of producers
and public bodies
Old design New design
JELEETS (*1)
To be updated to a
design that leverages
both the design from the
1990s and the current
one.
Can design from 1994.
The “face can” from
Relaunched unsweetened tea series with Japan-produced ingredients under the peak days of the
product, which is a
The current can
design. In use
Updated to a modern
“face can” based on the
the new concept of TOCHI & CRAFT design familiar to
customers.
since 2013. “face can” design of the
1990s.
Pokka Coffee (*1)
Copyright, 2019 SAPPORO HOLDINGS LTD. All rights reserved. 31/36Appendix:Major New Food & Soft Drinks (Japan) Product Launches in Jan, Feb, and Mar
Soups
Jikkurikotokoto series
Lemon-based food products
Risorante
Soups
Copyright, 2019 SAPPORO HOLDINGS LTD. All rights reserved. 32/36Appendix: Food & Soft Drinks (Japan)
Completion of soymilk yogurt production line and launch of operations
-Moving on to the next stage by creating new demand and engaging in aggressive business expansion-
Until now, we have been producing soymilk yogurt at an outsourced plant, but we will be beginning in-house production and
embarking on sales expansion based on integrated production and distribution to generate new domestic demand and pursue
further business expansion in the soymilk yogurt category, which will become the core of the soy beans and chilled products
business.
The innovative new production line that is commencing operations covers everything from the process of extracting soymilk from
soy beans to fermentation of the soymilk and packing of soymilk yogurt in an integrated manner. Further, this enables us to
manufacture products in large containers in addition to the small container products the Company has been selling so far, and also
enables us to launch new soymilk yoghurt products that respond to customer needs even better. With this production line becoming
operational, we are now able to produce a wide range of products at the Gunma Plant, from room-temperature products to chilled
products, including soft drinks, soups, and soymilk yoghurts.
Copyright, 2019 SAPPORO HOLDINGS LTD. All rights reserved. 33/36Appendix:Real Estate
< Information about
< Major rental properties & occupancy rates:(Averages for 2019 1Q )>>
Investment property >
(billions of yen)
Site area Floor area
Occupancy 500.0
(㎡) (㎡)
rate No. of floors 400.0
(%) 300.0
40 floors above
200.0 397.6 386.0
Yebisu Garden Place(1) 56,943 298,007 99 ground, 5 below 100.0 200.0 215.5
0.0
12 floors above
Ebisu First Square 2,596 16,012 100 As of As of
ground, 1 below
11 floors above December 31, December 31,
Ginza Place 645 7,350 98 ground, 2 below 2017 2018
13 floors above
Strata Ginza(2) 1,117 11,411 100 ground, 1 below Carrying value on the consolidated
*1: The number of floors is for the office block only. Occupancy rates are for office areas only.
statement of financial position
*2: Figures are for entire property. Sapporo owns 922m2 of the site (sectional ownership) and 89.72% of the building Fair value
(joint management)
(billions of yen) (billions of yen)
<Operating profit> 2018 1Q 2019 1Q Change <EBITDA> 2018 1Q 2019 1Q Change
Yebisu Garden Place, etc. 0.9 0.9 0.0 Yebisu Garden Place, etc. 1.7 1.7 (0.0)
Hokkaido 0.1 0.1 0.0 Hokkaido 0.1 0.2 0.0
Other area & other Other area & other
operations
0.3 2.3 2.0 operations 0.7 0.7 0.0
General corporate (0.2) (0.3) (0.0) General corporate (0.2) (0.3) (0.0)
Total 1.1 3.0 1.9 Total 2.5 2.4 (0.1)
Copyright, 2019 SAPPORO HOLDINGS LTD. All rights reserved. 34/36Appendix: Real Estate
Digital Urban Development “EBISU UPDATE PROJECT” launched
-Creating the “Ebisu of the Future” online-
With the “EBISU UPDATE PROJECT” we will design an “Ebisu of the Future” in digital space based on the image of the present-
day Ebisu area with its worldview and lifestyles associated with high quality and refinement, incorporating future trends such as
SDGs so as to respond to the needs of the society of the future.
With “Ebisu of the Future” we aim to create a place where people can gather and meet up and encounter things that enable them
to experience the richness of the future enhanced not only by things such as physical objects and status, but also by social
wellness and social contribution, based on the concept of “Social Wellness – Creating a urban area where “Feeling good benefits
society and the planet.”
Website
Reference:
Press release by Kodansha Ltd.
Copyright, 2019 SAPPORO HOLDINGS LTD. All rights reserved. 35/36As an intrinsic part of people's lives, Sapporo will contribute to
the evolution of creative, enriching and rewarding lifestyles.
Copyright, 2019 SAPPORO HOLDINGS LTD. All rights reserved. 36/36You can also read