FOURTH QUARTER 2020 January 28, 2021 - 2021 Live Oak Banking Company. All rights reserved. Member FDIC. Equal Housing Lender.
←
→
Page content transcription
If your browser does not render page correctly, please read the page content below

FOURTH QUARTER
 2020
 January 28, 2021

©2021 Live Oak Banking Company. All rights reserved. Member FDIC. Equal Housing Lender.   Confidential & Proprietary
FORWARD LOOKING STATEMENTS
Information in this presentation may contain “forward-looking statements” within the Private Securities Litigation Reform Act of 1995. These statements generally relate to our financial
condition, results of operations, plans, objectives, future performance or business and usually can be identified by the use of forward-looking terminology such as “may,” “will,” “would,”
“should,” “could,” “expect,” “anticipate,” “estimate,” “believe,” “plan,” “intend,” “project,” “goals,” “outlook,” or “continue,” or the negative thereof or other variations thereof or comparable
terminology. These statements represent our judgment concerning the future and are subject to business, economic and other risks and uncertainties, both known and unknown. These
statements are based on current expectations, estimates and projections about our business, management’s beliefs and assumptions made by management. These statements are not
guarantees of our future performance and involve certain risks and uncertainties, which are difficult to predict. Therefore, actual outcomes and results may differ materially from what is
expressed or forecasted in the forward-looking statements. These risks, uncertainties and assumptions include, without limitation:
•   deterioration in the financial condition of borrowers resulting in significant increases in our loan and lease losses and provisions for those losses and other adverse impacts to results of
    operations and financial condition;
•   changes in SBA rules, regulations and loan products, including specifically the Section 7(a) program, changes in SBA standard operating procedures or changes to Live Oak Banking
    Company’s status as an SBA Preferred Lender;
•   changes in rules, regulations or procedures for other government loan programs, including those of the United States Department of Agriculture;
•   changes in interest rates that affect the level and composition of deposits, loan demand and the values of loan collateral, securities, and interest sensitive assets and liabilities;
•   the failure of assumptions underlying the establishment of reserves for possible loan and lease losses;
•   changes in loan underwriting, credit review or loss reserve policies associated with economic conditions, examination conclusions, or regulatory developments;
•   the potential impacts of the Coronavirus Disease 2019 (COVID-19) pandemic on trade (including supply chains and export levels), travel, employee productivity and other economic
    activities that may have a destabilizing and negative effect on financial markets, economic activity and customer behavior;
•   a reduction in or the termination of our ability to use the technology-based platform that is critical to the success of our business model or to develop a next-generation banking platform,
    including a failure in or a breach of our operational or security systems or those of its third party service providers;
•   changes in financial market conditions, either internationally, nationally or locally in areas in which we conduct operations, including reductions in rates of business formation and growth,
    demand for our products and services, commercial and residential real estate development and prices, premiums paid in the secondary market for the sale of loans, and valuation of
    servicing rights;
•   changes in accounting principles, policies, and guidelines applicable to bank holding companies and banking;
•   fluctuations in markets for equity, fixed-income, commercial paper and other securities, which could affect availability, market liquidity levels, and pricing;
•   the effects of competition from other commercial banks, non-bank lenders, consumer finance companies, credit unions, securities brokerage firms, insurance companies, money market
    and mutual funds, and other financial institutions operating in our market area and elsewhere, including institutions operating regionally, nationally and internationally, together with such
    competitors offering banking products and services by mail, telephone and the Internet;
•   our ability to attract and retain key personnel;
•   changes in governmental monetary and fiscal policies as well as other legislative and regulatory changes, including with respect to SBA or USDA lending programs and investment tax
    credits;
•   changes in political and economic conditions;
•   the impact of heightened regulatory scrutiny of financial products and services, primarily led by the Consumer Financial Protection Bureau and various state agencies;
•   our ability to comply with any requirements imposed on us by our regulators, and the potential negative consequences that may result;
•   operational, compliance and other factors, including conditions in local areas in which we conduct business such as inclement weather or a reduction in the availability of services or
    products for which loan proceeds will be used, that could prevent or delay closing and funding loans before they can be sold in the secondary market;
•   the effect of any mergers, acquisitions or other transactions, to which we may from time to time be a party, including management’s ability to successfully integrate any businesses that
    we acquire;
•   other risk factors listed from time to time in reports that we file with the SEC, including in our Annual Report on Form 10-K; and
•   our success at managing the risks involved in the foregoing.
Given these risks, uncertainties and other factors, you should not place undue reliance on these forward-looking statements. Moreover, these forward-looking statements speak only as of the
date they are made and based only on information actually known to us at the time. We undertake no obligation to update publicly any forward-looking statements, whether as a result of new
information, future events or otherwise. Except as otherwise disclosed, forward-looking statements do not reflect: (i) the effect of any acquisitions, divestitures or similar transactions that have
not been previously disclosed; (ii) any changes in laws, regulations or regulatory interpretations; or (iii) any change in current dividend or repurchase strategies, in each case after the date as
of which such statements are made.

©2021 Live Oak Banking Company. All rights reserved. Member FDIC. Equal Housing Lender.    Confidential & Proprietary
3

AGENDA

          1. It Starts and Ends with Safety and Soundness
                   Government assistance is working and more help is on the way.

          2. A discussion of real core earnings growth

          3. Technology Wins Continue

          4. Bank performance

©2021 Live Oak Banking Company. All rights reserved. Member FDIC. Equal Housing Lender.   Confidential & Proprietary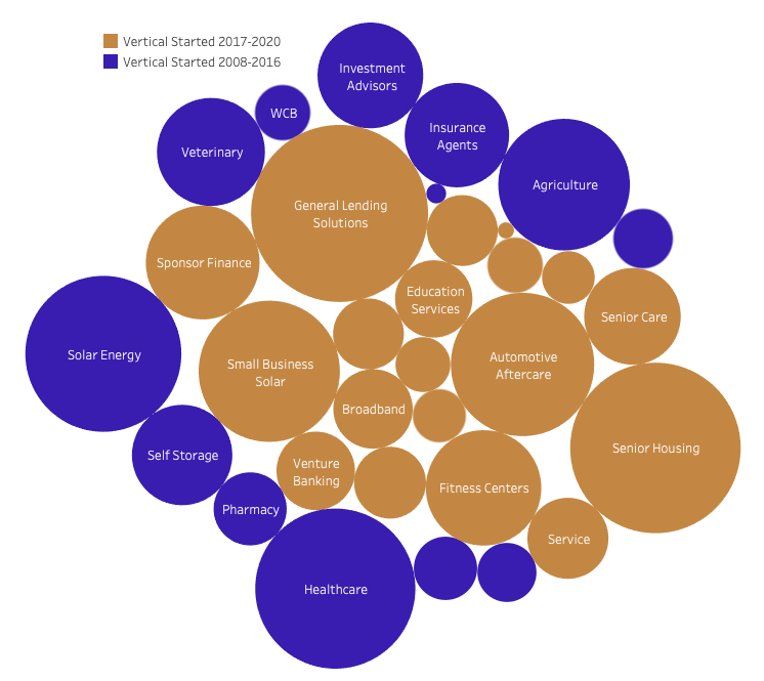
4

CREDIT & FAIR VALUE METRICS
 Ratios1                                                                             12/31/2019             3/31/2020             06/30/2020                 09/30/2020               12/31/2020
 Past Due > 30 Days2                                                                   0.44%                 0.54%                 0.00%                       0.00%                    0.05%
 Watchlist Loans and Leases3                                                           6.28%                 6.45%                 6.46%                       7.97%                    9.61%
 Classified Assets4                                                                    1.85%                 1.88%                 1.66%                       2.32%                    2.18%
 Non-Accruals5                                                                         0.86%                 1.06%                 1.00%                       1.30%                    1.07%
 Net Charge Off (Annualized)                                                           0.13%                 0.58%                 0.21%                       1.03%                    0.05%
 ACL6 & FV Mark7 on HFI Unguaranteed                                                   $44.4                 $61.3                 $67.2                       $61.8                    $74.8
     Loans and Leases
                As of December 31, 2020 ($ in millions)
                Tier 1 Capital (a)                                                                                                                                       $521.6
                ACL and FV Mark on HFI Loans and Leases (b)                                                                                                               $74.8
                Total HFI Unguaranteed Loans and Leases8 (c)                                                                                                           $2,511.4
                Ratio (a+b)/c                                                                                                                                              23.7%
                Ratio b/c                                                                                                                                                   3.0%
                Classified HFI Unguaranteed Loans & Leases to
                      Tier 1 Capital plus ACL & FV Mark on HFI Unguaranteed HFI Loans and Leases                                                                             9.2%

1.) All ratios use Total HFI Unguaranteed Loan and Leases (see footnote 8) as the denominator, except for net charge-offs 2.) Past due loans and leases include only loans and leases on accrual status at
amortized cost 3.) Watchlist loans and leases include HFI unguaranteed loans and leases at amortized cost (inclusive of loans and leases at fair value and historical cost) categorized as Risk Grade 5 and 6 4.)
Classified assets include Risk Grade 6 and higher HFI unguaranteed loans and leases at amortized cost (inclusive of loans and leases at fair value and historical cost) 5.) Non-accrual loans include HFI
unguaranteed balance of non-accrual loans and leases at amortized cost ((inclusive of loans and leases at fair value and historical cost) 6.) Allowance for credit losses on HFI unguaranteed loans and leases
carried at historical cost 7.) Fair value mark on HFI unguaranteed loans measured at fair value 8.) Represents total HFI unguaranteed loans and leases at amortized cost (inclusive of loans and leases at fair
value and historical cost)
©2021 Live Oak Banking Company. All rights reserved. Member FDIC. Equal Housing Lender.        Confidential & Proprietary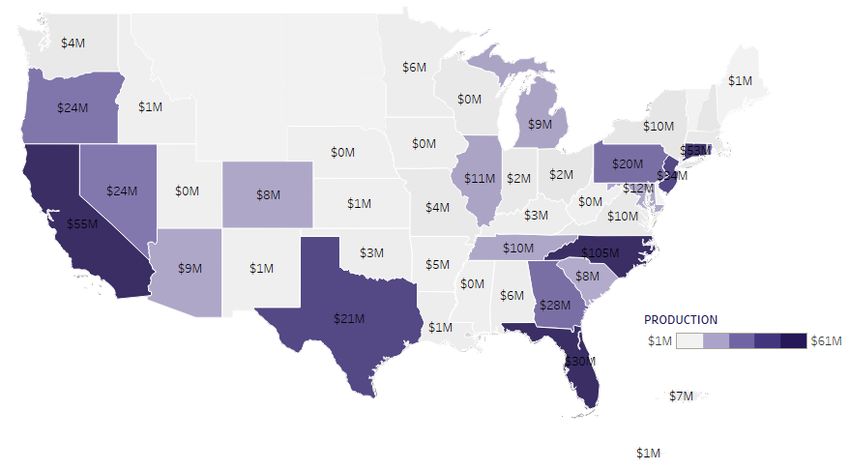
5

LOAN & LEASE PORTFOLIO CHARACTERISTICS

                                                                                      % of Total HFS
                            $ in millions                                 HFS & HFI      and HFI     30-89 Past Due Criticized and
                                            Vertical                    Unguaranteed1 Unguaranteed and Accruing % Classified2 % Non-Accrual %
                               Healthcare                                  $268.7         10.4%           0.0%          10.3%       1.8%
      Exposures
      5 Largest

                               Agriculture                                  265.0         10.3%           0.2%           3.7%       0.4%
                               Veterinary                                   170.3          6.6%           0.0%           7.9%       0.4%
                               Self Storage                                 162.8          6.3%           0.0%           5.7%       0.9%
                               General Lending Solutions                    147.0          5.7%           0.0%           5.9%       0.2%

                               Hotels                                          $134.8             5.2%                 0.0%   36.1%    8.7%
        At Risk Verticals

                               Wine & Craft Beverage                            104.1             4.0%                 0.3%   21.1%    1.8%
                               Educational Services                              94.2             3.7%                 0.0%   24.1%    0.0%
                               Entertainment Centers                             55.3             2.1%                 0.0%   73.2%   17.3%
                               Fitness Centers                                   30.0             1.2%                 0.0%   42.1%    0.0%
                               Quick Service Restaurants                         20.9             0.8%                 0.0%    6.6%    0.0%

                               Other Loans and Leases                         $1,126.6           43.7%                 0.1%   3.2%    0.1%
                               Total Loans and Leases                         $2,579.8          100.0%                 0.1%   9.8%    1.3%
1.) At amortized cost (inclusive of loans and leases at fair value and historical cost)
2.) Criticized and Classified loans and leases are risk grade 5 and higher
©2021 Live Oak Banking Company. All rights reserved. Member FDIC. Equal Housing Lender.   Confidential & Proprietary
6
CREDIT RESERVES & FAIR VALUE MARK
Total ACL & FV % on $ on
$ in millions
HFI Total ACL3 & Mark/Total HFI Payment Payment % Receiving
Vertical Unguaranteed1 FV Mark4 Unguaranteed1 Deferral1,5,6 Deferral1,5,6 Subsidy2,5
Top 5 Largest
Healthcare $268.7 $6.0 2.2% 19.3% $129.7 23.4%
Verticals by
Exposure
Agriculture 265.0 5.9 2.2% 0.0% 0.0 1.3%
Veterinary 170.3 3.0 1.8% 12.9% 43.5 17.9%
Self Storage 162.8 1.4 0.9% 4.3% 15.8 27.0%
General Lending Solutions 147.0 8.2 5.6% 9.3% 31.5 39.6%
Hotels $110.6 $11.4 10.3% 15.7% $32.8 4.7%
High Impacted
Wine & Craft Beverage 104.1 5.2 5.0% 30.2% 56.1 17.2%
Vertical
Educational Services 94.2 3.7 3.9% 32.7% 85.9 44.5%
Entertainment Centers 55.3 4.9 8.9% 54.6% 46.7 13.0%
Fitness Centers 30.0 2.9 9.8% 32.2% 20.3 24.6%
Quick Service Restaurants 20.9 1.0 4.9% 14.1% 6.2 49.6%
Other Loans & Leases $1,082.3 $21.2 2.0% 3.9% $69.6 17.0%
Total Loans and Leases $2,511.4 $74.8 3.0% 11.1% $538.1 20.0%
1.) At amortized cost (inclusive of loans and leases at fair value and historical cost) 2.) Loans for which SBA provided 6 months of payment relief under the CARES Act 3.) Allowance for credit losses on HFI
unguaranteed loans and leases carried at historical cost 4.) Fair value mark on HFI unguaranteed loans measured at fair value 5.) Percent of total guaranteed and unguaranteed HFS & HFI loans at amortized
cost within each vertical listed, excluding PPP loans 6.) Deferral amounts are specific to loans and leases considered to be impacted by the COVID-19 pandemic
©2021 Live Oak Banking Company. All rights reserved. Member FDIC. Equal Housing Lender. Confidential & Proprietary7
KEEPING OUR CUSTOMERS CLOSE
Customer Site Visits Q4 2020
HFS & HFI % of HFS & HFI
Vertical Unguaranteed1 Unguaranteed Visited
Hotels $134.8 46.0%
Wine & Craft Beverage 104.1 25.5%
Educational Services 94.2 1.6%
Entertainment Centers 55.3 54.0%
Fitness Centers 30.0 6.9%
Quick Service Restaurants 20.9 3.4%
Covid 6 Total 439.3 27.9%
1.) At amortized cost (inclusive of loans and leases at fair value and historical cost)
©2021 Live Oak Banking Company. All rights reserved. Member FDIC. Equal Housing Lender. Confidential & Proprietary8
FY 2020 LOAN & LEASE ORIGINATIONS
Growth & Diversification
Loan & Lease Originations, excluding PPP
($ in millions)
Average Quarterly
Average Quarterly Originations
Originations $879 million
$489 million
FY 2020
FY 2019
2.6%
34% Growth
8.8%
15.1%
FY 2019 vs. FY 2020 34.6%
8.0% $2.00 billion to $2.69 billion 52.9%
64.2% Originations excluding PPP
1.3%
2.6%
5.7%
3.0% 1.2%
©2021 Live Oak Banking Company. All rights reserved. Member FDIC. Equal Housing Lender. Confidential & Proprietary9
Q4 DIVERSIFIED LOAN & LEASE ORIGINATIONS
Growth & Diversification
Q4 Originations
$808.0
million
$553.9 45 $1.4 Q4 2020 Originations by Year Vertical Started
($ in millions)
million States & million
2008 – 2016 $331.8
Total Unguaranteed Territories Average Unguaranteed
2017 – 2020 $476.2
Balance Balance per Loan
©2021 Live Oak Banking Company. All rights reserved. Member FDIC. Equal Housing Lender. Confidential & Proprietary10
GROWTH IN EARNINGS & ASSETS
Non-GAAP pre-tax pre-provision income, as adjusted for PPP activities1
($ in thousands) ($ in millions)
Total loan and lease portfolio, excluding PPP1 $27,786
25,000 $26,598
5,000
$4,822
$4,514
20,000 4,000
$3,939
$3,814
$3,594
$17,230 $17,497
15,000 3,000
$13,407
10,000 2,000
5,000 1,000
- -
Q4 2019 Q1 2020 Q2 2020 Q3 2020 Q4 2020
34% 61%
Growth Growth
Loan & Lease Portfolio, Non-GAAP Pre-Tax Pre-
excluding PPP Provision Income, excluding
Q4 2020 vs. Q4 2019 PPP activities
Q4 2020 vs. Q4 2019
1.) See Appendix for Reconciliation of non-GAAP items to reported balances
©2021 Live Oak Banking Company. All rights reserved. Member FDIC. Equal Housing Lender. Confidential & Proprietary11
TECHNOLOGY INVESTMENTS
Live Oak Cash $7.8 $2.1 $2.2 $1.5 $5.0 $0.0
Investment1 million million million million million million
Live Oak Carrying $1.4 $0.0 $2.9 $1.5 $22.4 $53.3
Value million million million million million million
Estimated Implied $28.9 $13.9 $4.4 $1.4 $38.2 $68.3
Value of Shares million million million million million million
Owned by Live Oak
$18.6 $81.5 $155.1 $73.6
million million million million
Investment Total Carrying Estimated Difference
Value Implied Value1
1.) Implied value based on most recent transaction data and not necessarily indicative of current or future value
©2021 Live Oak Banking Company. All rights reserved. Member FDIC. Equal Housing Lender. Confidential & ProprietaryPERFORMANCE ©2021 Live Oak Banking Company. All rights reserved. Member FDIC. Equal Housing Lender. Confidential & Proprietary
13

OUR FOCUS

     KEEPING OUR                                          SAFETY & WELL-BEING                               SUPPORTING SMALL              DELIVERING
     CUSTOMERS CLOSE                                      OF OUR EMPLOYEES &                                BUSINESSES                    TECHNOLOGY &
                                                                                                                                          PRODUCTS
                                                              COMMUNITIES

                                                         Hybrid remote work model                           Continue to provide capital   Business Savings and
     Continued Outreach &                                                                                                                 CDs Launch
                                                                                                            to small business owners
     Engagement
                                                         Healthcare and support for                         across the country
                                                         600+ employees                                                                   Full Conversion to Finxact
     Ongoing Credit Assessments                                                                             Newest round of PPP
                                                                                                                                          & Checking on the
                                                                                                            Lending in 2021
                                                         Continue to invest in our                                                        Horizon
                                                         communities                                        SBA 7(a) Program
                                                                                                            Enhancements
                                                                                                            PPP Forgiveness Continues

©2021 Live Oak Banking Company. All rights reserved. Member FDIC. Equal Housing Lender.   Confidential & Proprietary
14
Q4 BALANCE SHEET HIGHLIGHTS
Q4 Q3 Q4 Change from
Q4 2020 Notes
$ in billions unless otherwise indicated 2019 2020 2020 Prior Quarter
Total Loans and Leases Loan growth driven by strong and
$3.59 $4.51 $4.82 7%
Excluding PPP1 diverse origination and slower
prepayment speeds
Managed Portfolio $6.56 $7.66 $8.03 5%
Excluding PPP2,1 Total assets, as reported were flat
as excess liquidity funded loan
Eligible for Sale growth
$0.92 $1.71 $1.68 1%
Guaranteed Loans
Strong capital position. Total
Total Assets, Risk-Based Capital Ratio
As Adjusted to exclude $4.81 $5.87 $6.36 8% decreased to 13.5% from 14.2%
PPP3 and Tier 1 Leverage remained
approximately the same as
Total Equity $532.4 $584.2 $567.9 3% September 30, 2020, at 8.4%
million million million
1.) See Appendix for Reconciliation of non-GAAP items to reported balances 2.) Outstanding balance of sold and serviced loans plus loans and leases held for investment and held for sale less adjustments for
PPP activities (See Appendix) 3.) Total Assets as reported less adjustments for PPP activities (See Appendix)
©2021 Live Oak Banking Company. All rights reserved. Member FDIC. Equal Housing Lender. Confidential & Proprietary15
Q4 INCOME STATEMENT HIGHLIGHTS
Q4 Q3 Q4 Change from
Q4 2020 Notes
$ in millions 2019 2020 2020 Prior Quarter
Loan & Lease Originations, $524 $949 $808 15% Loan growth and deposit repricing
excluding PPP drove NII growth and margin
expansion
Net Interest Income , as
adjusted for PPP Activities1 $44.7 $47.4 $53.8 13%
+ Servicing Revenue Strengthening secondary market
generated increased gain on sale
Net Gain on Sales of $11.4 $12.7 $15.0 18% despite lower amount of loans sold
Loans
Non-GAAP Noninterest Expenses increased for a broad
Expense, as adjusted for PPP $44.4 $41.7 $48.0 15% range of operating activities as
Activities1 certain pandemic restrictions
eased.
Non-GAAP Pre-Tax Pre-
Provision Income $17.2 $26.6 $27.8 4%
as adjusted for PPP Activities1
1.) See Appendix for Reconciliation of non-GAAP items to reported balances
©2021 Live Oak Banking Company. All rights reserved. Member FDIC. Equal Housing Lender. Confidential & Proprietary16
NOTABLE EVENTS – Q4
Event Comments Financial Impact
2.5 million RSUs with price conditions between $34 - $40 vested in Q4
Market Priced RSU Non-interest expense: $4.1 million
2020
Tax benefit: $22.1 million
Vesting Additional 201 thousand with $45 price condition vested in Q1 2021
Equity Impact: $(26.9) million
Remaining RSUs outstanding of 383 thousand with price conditions
1.4 million shares issued in Q4 2020 (net settled)
between $48-$55 per share
In the second half of the year, Apiture converted from an LLC to a C-
Apiture LLC to C-Corp Corp and raised $30 million of primary capital
Conversion Noninterest income: $(7.8) million
Resulted in a one-time tax charge to Apiture which flows through equity
method accounting
$1.76 billion PPP loan originations in 2020 PPP Loans: $1.50 billion at December 31, 2020
Ongoing PPP Impact
Second Draw began in Q1 2021 PPP Net Interest Income: $15.2 million during Q4
2020
©2021 Live Oak Banking Company. All rights reserved. Member FDIC. Equal Housing Lender. Confidential & Proprietary17
MARKET PRICE RSUS IMPACT
Vested in Q4 2020 Vested Since Dec. 31, 2020 Remaining (Unvested)
2.5 million 201 thousand 383 thousand
Restricted Stock Unit Awards $34 to $40 per share $45 per share $48 to $55 per share
Market Price Condition Market Price Condition Market Price Condition
~200 - 225 thousand
Net Settlement 1.4 million shares 114 thousand shares
shares
Noninterest Expense (NIE) Incurred $4.1 million ~$1.8 million ~$5.0 million1
Income Tax Benefit upon Vesting $22.1 million ~$1.9 million TBD
Net Tax Benefit for Related NIE $1.2 million ~$450 thousand TBD
Book Value Impact* $(26.9) million TBD TBD
*Q4 2020 Impact to Book Value
Net settlement of shares vesting $(48.5) million
Employer payroll tax obligation (1.7) million
Net tax benefit for related noninterest expense 1.2 million
Tax benefit upon vesting 22.1 million
Net impact on book value from awards vesting during Q4 2020 $(26.9) million
Net impact on tangible book value per share $(1.12) per share
1. Estimated assuming all shares vest at $55/share market price
©2021 Live Oak Banking Company. All rights reserved. Member FDIC. Equal Housing Lender. Confidential & Proprietary18
PPP IMPACT
($ in millions) Q2 2020 Q3 2020 Q4 2020
Total Assets, as reported $8,209.2 $8,093.4 $7,872.3
Total Adjustments for PPP Activities1 2,625.5 2,218.8 1,510.2
Total Assets, as adjusted to exclude PPP Activities 5,583.6 5,874.6 6,362.1
$29.6 million net deferred fees on balance sheet at December 31, 2020
($ in millions) Q2 2020 Q3 2020 Q4 2020
Interest Income and Fees on Loans, as reported $62.0 $70.6 $79.2
Less Amortization of Net Deferred Fees on PPP Loans1 5.4 9.2 13.3
Less Interest Income on PPP Loans1 3.3 4.4 4.3
Interest Income & Amortization of Net Deferred Fees
on Loans (excluding PPP) 53.3 57.0 61.6
Estimated interest expense on funding activity
to support PPP activities1 1.8 2.8 2.4
Impact of PPP Activities on Net Interest Income 6.9 10.8 15.2
1.) See Appendix for adjustments for PPP Activities
©2021 Live Oak Banking Company. All rights reserved. Member FDIC. Equal Housing Lender. Confidential & Proprietary19
PIVOTING TO SBA PROGRAM ENHANCEMENTS
• Economic Aid Act enacted December 27, 2020
• Specific guidance began January 19, 2021, and continues for the implementation of all enhancements
• Additional clarification regarding PPP lending is still being issued
SBA Flagship Program PPP Program
• SBA 7a program – 75% guarantee increased to 90% • Program runs through 3/31/21 funded with $284bn
• 7a and 504 fees waived for borrower $35bn authorized as of 1/24
• Section 1112 – Subsidy Payments apply to 7a and 504 loans, • Second Draw for customers with initial PPP and
based on origination date1 revenue decline of 25%, max employees 300, max
Loan Origination Date Initial Round 2 Subsidy Underserved / size $2mm
subsidy (full (max $9k / mo.) Impacted • First Draw reopens for first time applicants
P&I) (max $9k / mo.)
• Modifications to existing loans also available
Pre 3/27/20 6 months 3 months 5 months
3/27/20 – 9/27/20 6 months TBD2 • LOB primary focus on Second Draw
9/28/20 – 1/31/21 - - • Approximately 3000 applications currently
2/1/20 – 9/30/21 - 6 months being processed
Programs subject to adjustment by the SBA based on availability of funds
1.) Payments begin with the first payment due in February for existing loans. New loans begin their subsidy the first payment due after full disbursement.
2.) Round 2 payment subsidy may apply after all of Round 1 subsidy payments have been made for the Round 1 cohort subject to availability of funds.
©2021 Live Oak Banking Company. All rights reserved. Member FDIC. Equal Housing Lender. Confidential & Proprietary20 NON-GAAP PRE-TAX PRE-PROVISION INCOME ($ in thousands) Q4 2019 Q3 2020 Q4 2020 FY 2019 FY 2020 Net interest income, as reported 38,011 51,363 62,301 140,082 194,723 Less PPP loan interest income - 4,403 4,269 - 11,989 Less loan deferred fees & costs amortized into interest income, net - 9,183 13,310 - 27,873 Add estimated interest expense on funding activity to support PPP activities - 2,815 2,354 - 6,977 Net interest income, as adjusted for PPP activities 38,011 40,592 47,076 140,082 161,838 Total noninterest income, as reported 20,125 47,044 10,803 63,519 86,000 Total fair value adjustments 1,743 (5,742) 10,309 12,202 25,544 Less gain on sale of aircraft - - - 357 - Add losses (gains) from FinTech Activities(3) 1,761 (13,586) 7,856 9,484 (1,057) Non-GAAP noninterest income1 23,629 27,716 28,968 84,848 110,487 Less sales revenue from co-developed processing technology - - 217 - 2,674 Non-GAAP noninterest income, as adjusted for PPP activities 23,629 27,716 28,751 84,848 107,813 Total noninterest expense, as reported 44,410 42,650 52,435 164,924 192,676 Non-GAAP noninterest expense1 44,410 41,631 48,041 164,322 187,263 Less performance bonus related to PPP activities - - - - 7,150 Add deferred salary expense related to PPP activities - (79) - - (4,250) Non-GAAP noninterest expense, as adjusted for PPP activities 44,410 41,710 48,041 164,322 184,363 Non-GAAP pre-tax pre-provision income 17,230 37,448 43,228 60,608 117,947 Non-GAAP pre-tax pre-provision income, as adjusted for PPP activities 17,230 26,598 27,786 60,608 85,288 1.) See Appendix for Reconciliation of non-GAAP items to reported balances ©2021 Live Oak Banking Company. All rights reserved. Member FDIC. Equal Housing Lender. Confidential & Proprietary
21

FRANCHISE FUNDAMENTALS

                                                                                     1

                                                                                                                             34%
                                                                                                                         Q4 2020 vs Q4 2019
                                                                                                                        Total Loan and Lease
                                                                                                                       Portfolio, excluding PPP

                                                                                                                               7%
                                                                                                                         Q4 2020 vs Q3 2020
                                                                                                                        Total Loan and Lease
                                                                                                                       Portfolio, excluding PPP

                                                                                                                            $1.7
                                                                                                                             billion
                                                                                                                        Guaranteed Loans
                                                                                                                         Eligible for Sale

1.) See Appendix for Reconciliation of non-GAAP items to reported balances
©2021 Live Oak Banking Company. All rights reserved. Member FDIC. Equal Housing Lender.   Confidential & Proprietary
22
GUARANTEED LOAN SALES
For the year ended December 31, 2020
SBA Guaranteed Loans
$431.4 million sold
$1.40 billion became eligible for sale
69.2% Retention
USDA Guaranteed Loans
$111.2 million sold
$136.9 million became eligible for sale
18.8% Retention
©2021 Live Oak Banking Company. All rights reserved. Member FDIC. Equal Housing Lender. Confidential & Proprietary23
EXPENSE DISCIPLINE
1
$48.0
million
Non-GAAP noninterest
expense, as adjusted for PPP
activities1
0.76%
Non-GAAP noninterest
expense, as adjusted for PPP
activities to Total assets, as
adjusted to exclude PPP
activities1
1.) See Appendix for reconciliation of non-GAAP items to reported balances
©2021 Live Oak Banking Company. All rights reserved. Member FDIC. Equal Housing Lender. Confidential & Proprietary24
FUNDING MODEL EXCELS IN CURRENT ENVIRONMENT
$4.34 62.1
billion thousand
Retail Deposits Open Accounts
As of December 31, 2020 As of December 31, 2020
7 95.0%
Basis points Savings Account
Noninterest Cost of Retention
Funds1 YTD 2020
Q4 2020
89% 57%
Retail Deposits Maturing CD
Growth Balance Retention
Since Q4 2018 YTD 2020
Retail Savings 2.11% 2.12% 2.01% 1.76% 1.66% 1.12% 0.71% 0.61%
Cost of Funds 0.60% 0.65%
Retail CDs 2.36% 1.80%
Consumer and 1-Year CD
2.57% 2.67% 2.67% 2.60% 2.13% 2.00%
Business Savings Offered Rate
Offered Rate January 28, 2021
January 28, 2021
1.) See Appendix for Deposit Noninterest Cost of Funds
©2021 Live Oak Banking Company. All rights reserved. Member FDIC. Equal Housing Lender. Confidential & Proprietary25
DEPOSIT REPRICING CONTINUES
Last 12 months: Deposit Repricing
• Consumer Savings rate reduced by 125bps to 0.60%1
2
• 12-month CD (comprising 59% of the Retail CD portfolio
balance) rate offering reduced by 150bps to 0.65%1
Through Q4 2021: Deposit Maturities ($ in millions)
• Retail CD Portfolio: $1,889 average maturing rate of 1.75%
• Brokered Portfolio: $606 average maturing rate of 1.30%2
3
4
1.) As of January 15, 2021
2.) Includes $250 million of Promontory ICS One-Way Buy maturing in April 2021
3.) Renewal rates as of January 15, 2021. Assumes maturing CDs renew into same term or are replaced by new accounts within same term. No change to overall term mix. Assumes weighted average renewal
rate of 0.64%
4.) Replacement rates on brokered CDs based on average of 1yr to 10yr funding, based on market rates as of January 11, 2021. Assumes weighted average renewal rate of 0.55%
©2021 Live Oak Banking Company. All rights reserved. Member FDIC. Equal Housing Lender. Confidential & Proprietary26
NIM EXPANSION & LIQUIDITY DEPLOYMENT
• NIM expansion driven by: • Liquidity, as reported, returned to pre-PPP levels
• Continued excess liquidity deployment driven by strong H2 2020 loan production
• PPP forgiveness and fee recognition
• Deposit rate reductions
1
1
2
1.) Estimated Core NIM and Adjusted Average Quarterly Liquidity Ratio removes $1.7 billion PPP/PPPLF impacts and related excess average liquidity. Adjusted Average Quarterly Liquidity is assumed to hold
constant to Q1 2020
2.) Net Spread is calculated as average yield on interest-earning loans less average cost of funds on interest-bearing deposits. Net spread for Q2 2020 through Q4 2020 excludes $1.7 billion PPP loans earning
1.00%
©2021 Live Oak Banking Company. All rights reserved. Member FDIC. Equal Housing Lender. Confidential & Proprietary27
CAPITAL & LIQUIDITY
$1.07 $2.27 $1.68
Government Guaranteed2 vs. Non-Government Guaranteed
Assets (as adjusted to exclude PPP activities) billion billion billion
Cash & Investments Government Eligible for Sale
Guaranteed Loans Government
(excl. PPP)1 Guaranteed Loans
2
52.6% 12.2% 18.8%
Cash, Investments, CET1 Capital Ratio Liquidity Ratio3
Government Guaranteed
Loans (excl. PPP)4
to Total Assets (excl. PPP)4
1.) At amortized costs, excludes $1.50 billion PPP loans at December 31, 2020. Government guaranteed loans including PPP loans totaled $3.77 billion at December 31, 2020
2.) Government Guaranteed Assets includes securities backed by government sponsored entities and the guaranteed portion of net loans, excluding PPP loans on the balance sheet as of December 31, 2020
3.) Liquidity ratio is calculated as Net Cash and Short-Term Marketable Assets Divided by Net Deposits and Short-Term Liabilities
4.) Excludes $1.50 billion PPP impact at December 31, 2020. The ratio of cash, investments, and government guaranteed loans including PPP loans to total assets including PPP loans is 61.5%
©2021 Live Oak Banking Company. All rights reserved. Member FDIC. Equal Housing Lender. Confidential & Proprietary28
TIER 1 LEVERAGE IMPACTS
1 2 1 2 1 2
1.) Average PPP loan balance exclusion from capital ratios dependent on average balance pledged to Federal Reserve’s Payroll Protection Program Liquidity Facility. The Bank’s average PPPLF balance in Q2 2020 was $644
million, in Q3 2020 was $1.73 billion, and in Q4 2020 was $1.69 billion.
2.) Estimated excess average liquidity as compared to Q1 2020.
©2021 Live Oak Banking Company. All rights reserved. Member FDIC. Equal Housing Lender. Confidential & Proprietary29
HIGH PERFORMING BANK METRICS
Q3 2020 Trend
Asset Size
-
$ 8.0
$ 7.0
$7.87 $8.09B
($ in billion)
+
3.75%
3.50%
NIM 3.33% 2.77%
Noninterest Income
+
25%
30%
14.8% 47.8%
to Total Income
1
-
60%
Efficiency Ratio1 71.7% 63.4% 43.9%
-
1.75%
1.25%
ROA 1.49% 1.67%
-
15%
20%
ROE 19.9% 23.6%
-
8.5%
10%
Tier 1 Leverage 8.40% 8.44%
1.) See Appendix for reconciliation of non-GAAP items to reported balances
©2021 Live Oak Banking Company. All rights reserved. Member FDIC. Equal Housing Lender. Confidential & Proprietary30
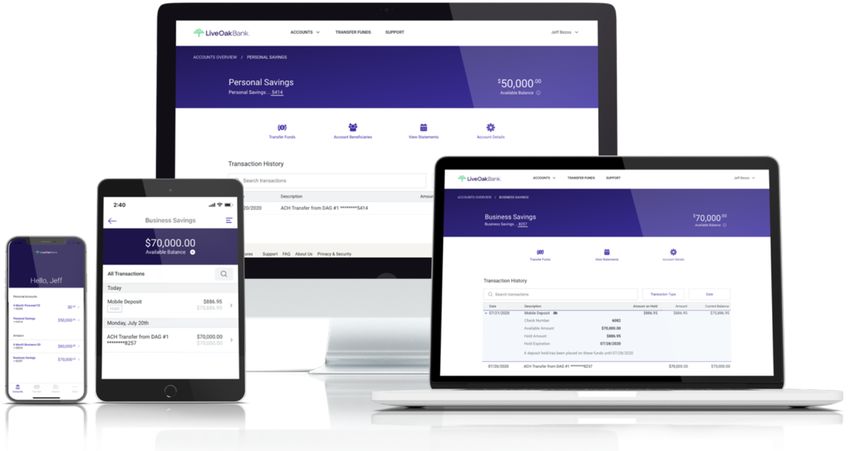
NEW DEPOSIT PLATFORM UPDATE
For the quarter ended
Sep 30, 2020 Dec 31, 2020
Small Business Savings
& CDs Customers
182 740
Account Balance $12.1 $61.6
million million
©2021 Live Oak Banking Company. All rights reserved. Member FDIC. Equal Housing Lender. Confidential & Proprietary31
PLATFORM FOR GROWTH IN SMALL BUSINESS BANKING
TODAY Better Ways
to Move
Easier
Access
TOMORROW
• Extensive small business Money to Capital • Small dollar lending
expertise • Channel partnerships
• Vertical knowledge • Payments
• Experience with most Information for • Data / Actionable Insights
the Business
complex loan product Owner, not the
Consolidated
Management
• Modern bank platform Accountant
A Modern
Digital
Experience
©2021 Live Oak Banking Company. All rights reserved. Member FDIC. Equal Housing Lender. Confidential & Proprietary32 ©2021 Live Oak Banking Company. All rights reserved. Member FDIC. Equal Housing Lender. Confidential & Proprietary
33

APPENDIX

©2021 Live Oak Banking Company. All rights reserved. Member FDIC. Equal Housing Lender.   Confidential & Proprietary
34

APPENDIX
Total Assets, as adjusted to exclude PPP activities

        Reconciliation of reported balances to exclude PPP activities
            ($ in thousands)                                                                                Q4 2019        Q1 2020      Q2 2020       Q3 2020       Q4 2020
        Loans held for sale, as reported                                                                       966,447        996,050      976,594     1,190,200     1,175,470
        Loans and leases held for investment, as reported                                                    2,627,286      2,817,491    4,650,056     5,037,199     5,145,082
           Less PPP loans                                                                                          -              -      1,688,104     1,713,695     1,498,617
        Total loan and lease portfolio, excluding PPP                                                        3,593,733      3,813,541    3,938,546     4,513,704     4,821,935
        Outstanding balance of loans sold & serviced                                                         2,970,607      2,984,602    3,072,031     3,143,493     3,205,623
        Managed portfolio, excluding PPP                                                                      6,564,340     6,798,143    7,010,577     7,657,197     8,027,558

      a Total assets, as reported                                                                             4,812,828     5,273,569    8,209,154     8,093,381     7,872,303
        PPP-related activities:
           Cash and cash receivable                                                                                    -          -         61,492           -           3,343
           Loans, net of unearned                                                                                      -          -      1,688,104     1,713,695     1,498,617
           Allowance for credit losses                                                                                 -          -         (1,565)       (2,636)       (2,297)
           Accrued interest receivable                                                                                 -          -          3,289         7,696        10,558
           Estimated excess balance sheet liquidity arising from PPP                                                   -          -        874,195       500,000           -
           Total adjustments for PPP activities                                                                     -             -      2,625,514     2,218,756     1,510,221
      b Total Assets, as adjusted to exclude PPP                                                              4,812,828     5,273,569    5,583,640     5,874,625     6,362,082

©2021 Live Oak Banking Company. All rights reserved. Member FDIC. Equal Housing Lender.   Confidential & Proprietary
Reconciliation of reported balances to non-GAAP items
35
APPENDIX
($ in thousands) Q4 2019 Q1 2020 Q2 2020 Q3 2020 Q4 2020 FY 2019 FY 2020
Net interest income, as reported 38,011 40,161 40,898 51,363 62,301 140,082 194,723
Less PPP loan interest income - - 3,317 4,403 4,269 - 11,989
Less loan deferred fees & costs amortized into interest income, net - - 5,380 9,183 13,310 - 27,873
Add estimated interest expense on funding activity to support PPP activities - - 1,808 2,815 2,354 - 6,977
Net interest income, as adjusted for PPP activities 38,011 40,161 34,009 40,592 47,076 140,082 161,838
Total noninterest income, as reported 20,125 5,742 22,411 47,044 10,803 63,519 86,000
Fair value adjustments:
Add loan servicing asset revaluation loss (gain) 4,135 4,692 1,571 (2,061) 5,756 16,581 9,958
Add exchange-traded interest rate futures contracts loss (gain)(1) (1,187) 3,209 (127) (252) (207) 2,994 2,623
Add net loss (gain) on loans accounted for under the fair value option (1,432) 10,638 1,089 (3,403) 4,759 (7,408) 13,083
Add other losses (gains) on valuation adjustments
(2) 227 176 (271) (26) 1 35 (120)
Total fair value adjustments 1,743 18,715 2,262 (5,742) 10,309 12,202 25,544
Less gain on sale of aircraft - - - - - 357 -
Add losses (gains) from FinTech Activities(3) 1,761 2,370 2,303 (13,586) 7,856 9,484 (1,057)
Non-GAAP noninterest income 23,629 26,827 26,976 27,716 28,968 84,848 110,487
Less sales revenue from co-developed processing technology - - 2,457 - 217 - 2,674
Non-GAAP noninterest income, as adjusted for PPP activities 23,629 26,827 24,519 27,716 28,751 84,848 107,813
c Total noninterest expense, as reported 44,410 49,491 48,100 42,650 52,435 164,924 192,676
Less loss on sale of aircraft - - - - 6 - 6
Less impairment on aircraft held for sale - - - 1,019 244 - 1,263
Less renewable energy tax credit investment - - - - - 602 -
Less compensation and payroll taxes related to restricted stock awards with market
price conditions(4) - - - - 4,144 - 4,144
Non-GAAP noninterest expense 44,410 49,491 48,100 41,631 48,041 164,322 187,263
Less performance bonus related to PPP activities - - 7,150 - - - 7,150
Add deferred salary expense related to PPP activities - - (4,171) (79) - - (4,250)
d Non-GAAP noninterest expense, as adjusted for PPP activities 44,410 49,491 45,121 41,710 48,041 164,322 184,363
Net interest income, as reported 38,011 40,161 40,898 51,363 62,301 140,082 194,723
Non-GAAP noninterest income 23,629 26,827 26,976 27,716 28,968 84,848 110,487
Non-GAAP noninterest expense 44,410 49,491 48,100 41,631 48,041 164,322 187,263
Non-GAAP pre-tax pre-provision income 17,230 17,497 19,774 37,448 43,228 60,608 117,947
Net interest income, as adjusted for PPP activities 38,011 40,161 34,009 40,592 47,076 140,082 161,838
Non-GAAP noninterest income, as adjusted for PPP activities 23,629 26,827 24,519 27,716 28,751 84,848 107,813
Non-GAAP noninterest expense, as adjusted for PPP activities 44,410 49,491 45,121 41,710 48,041 164,322 184,363
Non-GAAP pre-tax pre-provision income, as adjusted for PPP activities 17,230 17,497 13,407 26,598 27,786 60,608 85,288
c/a Noninterest Expense, as reported to Total Assets, as reported 0.92% 0.94% 0.59% 0.53% 0.67%
Non-GAAP noninterest expense, as adjusted for PPP activities to Total Assets, as
d/b 0.92% 0.94% 0.81% 0.71% 0.76%
adjusted to exclude PPP
1.Included as a component of the net gains on sales of loans on the income statement
2.Includes valuation losses related to equity security investments, equity warrant assets, and foreclosed assets
3.See Appendix "FinTech Activities Impact on Consolidated Financials"
4.Amount reflects accelerated stock compensation expense and related employer payroll taxes in the quarter of vesting
©2021 Live Oak Banking Company. All rights reserved. Member FDIC. Equal Housing Lender. Confidential & Proprietary36
APPENDIX
($ in thousands) Q4 2019 Q1 2020 Q2 2020 Q3 2020 Q4 2020
Efficiency Ratio
Noninterest Expense 44,410 49,491 48,100 42,650 52,435
Net Interest Income 38,011 40,161 40,898 51,363 62,301
Noninterest Income 20,125 5,742 22,411 47,044 10,803
Less: gain (loss) on sale of securities 528 (79) 734 1,225 -
Adjusted operating Revenue 57,608 45,982 62,575 97,182 73,104
Efficiency Ratio 77.09% 107.63% 76.87% 43.89% 71.73%
Efficiency ratio adjusted for non-GAAP income, non-GAAP expense, and PPP
activities1
Non-GAAP noninterest expense, as adjusted for PPP activities 44,410 49,491 45,121 41,710 48,041
Net interest income, as adjusted for PPP activities 38,011 40,161 34,009 40,592 47,076
Non-GAAP noninterest income, as adjusted for PPP activities 23,629 26,827 24,519 27,716 28,751
Efficiency ratio adjusted for non-GAAP income, non-GAAP expense, and PPP 72.05% 73.88% 77.09% 61.06% 63.36%
activities
1. See preceding page of Appendix for reconciliation of non-GAAP items to reported balances
©2021 Live Oak Banking Company. All rights reserved. Member FDIC. Equal Housing Lender. Confidential & Proprietary37 DEPOSITS COF BREAKDOWN ©2021 Live Oak Banking Company. All rights reserved. Member FDIC. Equal Housing Lender. Confidential & Proprietary
You can also read