Central London office analysis - Avison Young

Page created by Lawrence Fischer
 
CONTINUE READING
Central London office analysis - Avison Young
Central London markets                                                      Contact

                                                    Charts

RESEARCH

Central
London
office
analysis
Q4 2019

 View >

OCCUPATIONAL MARKET
Central London take-up totalled 3.3 million sq ft in Q4 2019 which
was 28% above the 10-year average. Overall 2019 was the second
strongest year on record with total take-up of 12.3 million sq ft.

INVESTMENT MARKET
Investment volumes reached £4.8 billion for Q4 2019, 31% above the
10-year average and 11% above the same period in 2018. However,
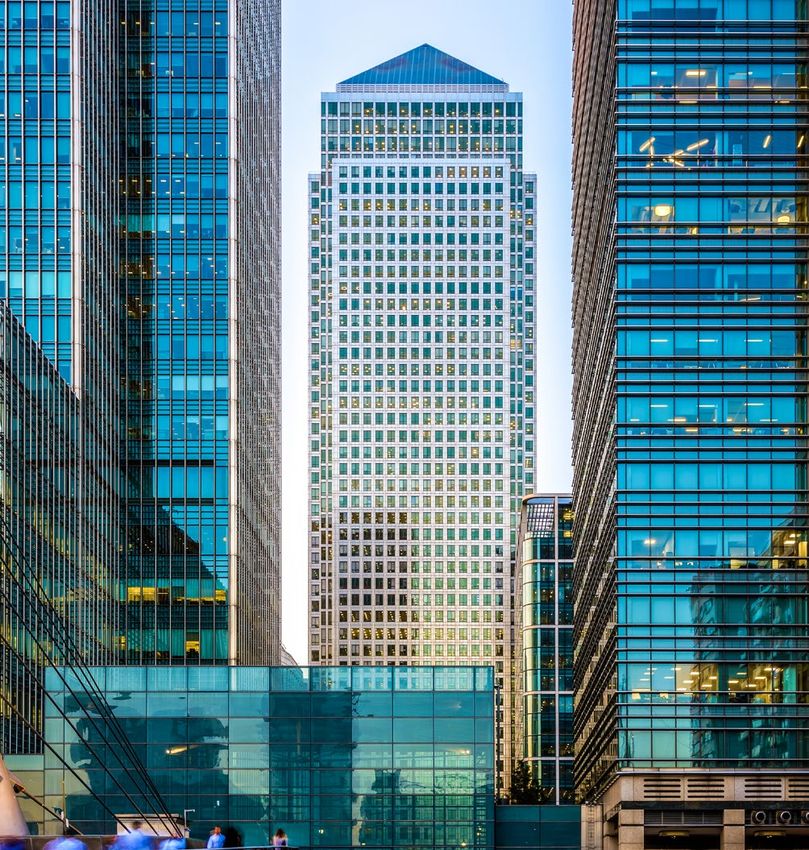
2019 volumes were still subdued overall, totalling £12 billion, which          Avison Young are marketing 11.267 sq ft at One Canada Square, E14.
was 20% down on the 10-year average.
Central London office analysis - Avison Young
Occupier market         Central London map                  Central London markets                       Investment              Investment commentary                        Investment data                    Contact

           Central London                Charts                                   West End                                  City                                East London                                  Midtown

                                  Occupier market – in brief
                                  SPACE WARS
                                  The Central London development pipeline continues to be starved of Grade A supply and under construction space remains in very high demand. Throughout 2019,
                                  3.3 million sq ft of stock was pre-let in 47 separate transactions. With just 3.4 million sq ft of available stock currently due for completion in 2020 across all size bands,
                                  we could be looking at a supply shortage in the coming year.

                                  After 2020, the level of under construction stock drops off significantly to just        Successful operators are those that are able to achieve a good business model, quality
                                  3.9 million sq ft of available stock for 2021 and 2022 combined. However, the            of provision and a collaborative approach. The movement away from quantity of
                                  outlook for the year looks set to see a number of large scale developments               locations towards quality of provision follows from similar trends in the conventional
                                  commence construction which could considerably alleviate the longer-term pipeline.       office market a year ago. This also signifies changing occupier requirements
                                  Examples include Elizabeth House, York Road, SE1 totalling 1.2 million sq ft, ‘Gotham    towards locations which drive wellbeing and productivity, reflecting the ongoing war
                                  City, EC3’ totalling 900,000 sq ft and One Leadenhall, EC3 totalling 400,000 sq ft. By   for talent. Co-working consolidation is in full swing which is affecting smaller brands
                                  2023 therefore, the City may hold a level of supply more able to cope with tenant        without the necessary access to capital, especially where they have high profit margins,
                                  requirements.                                                                            which limits their potential for success.

                                  The current market climate, however, sees low supply and high demand putting
                                                                                                                           HYBRID SECTORS
ALASDAIR GURRY                    considerable pressure on rental levels throughout Central London. Rents for the
Director                          most sought after spaces in the City continue to surpass previous benchmarks             Steady take-up despite market uncertainties to year-end 2019 is partly the result of
                                  and in some instances achieve levels comparable to the West End. In a footloose          booming hybrid sectors, primarily Fintech which has seen rapid growth in the Capital,
                                  market, geographical boundaries are increasingly redundant with occupiers placing        becoming one of London’s top performers. In Q4 2019 alone, hybrid occupiers such
                                  more importance on quality of space, digital and transport infrastructure, and value     as Monzo, Deloitte Digital and Checkout.com each acquired space in excess of
                                  for money.                                                                               50,000 sq ft, making up 260,000 sq ft and accounting for 15% of the City total alone.
Rents for the most                                                                                                         With Fintech now an established component of the Central London office market,
sought after spaces in the        CO-WORKING 2020                                                                          2020 may see other hybrid sectors rise in importance, underpinned by the attractive
City continue to surpass          In the aftermath of WeWork’s failed IPO, the serviced office sector has entered          conditions that have created strong growth in Fintech to date. Growing hybrid
previous benchmarks               its next stage of maturity and settled as a more manageable feature of the London        sectors in the London office market include Proptech (with firms such as Hubble) and
and, in some instances,           office market. Increasingly, we see major winners emerging in the sector which are       Legaltech (with firms such as Tessian), and with a number of existing property and law
achieve levels comparable         steadily rising to the top of the market to become recognised brands. Many large         firms becoming increasingly technology focused. Medtech is the latest entrant into
to the West End.                  multi-national corporates are in the process of deciding upon their level of exposure    the London office market, encouraged through London’s existing strength as a life
                                  to serviced offices with a number of operators capitalising on the growth in need for    sciences centre, particularly in the surrounds of King’s Cross where the Francis Crick
                                  corporate serviced office space for use as overflow or project space.                    Institute is based.
Central London office analysis - Avison Young
Occupier market                      Central London map                      Central London markets                        Investment                Investment commentary                     Investment data              Contact

          Central London                                   Charts                                    West End                                   City                                   East London                           Midtown

Central London
TAKE-UP                                                         AVAILABILITY AND DEVELOPMENT                                        KEY DEALS - Q4 2019                                               KEY STATS THIS QUARTER
Central London take-up reached 3.3 million sq ft for Q4         Total availability fell marginally to 11.1 million sq ft in          Address                    Occupier                Sq Ft
2019 reflecting continued strong demand, 28% above              Q4 2019, down 6% on Q3 2019’s 11.8 million sq ft and                                                                                  TOTAL TAKE-UP FOR Q4
                                                                falling below the 10-year average of 11.4 million sq ft.             22 Bishopsgate, EC2        Apple                  156,442
the 10-year quarterly average. A strong final quarter
took annual take-up to 12.3 million sq ft which was the         This was largely due to strong quarterly take-up which               53-64 Chancery Lane,       The Office             150,000        3.3 million sq ft
second strongest year on record, only just surpassed            has eroded the already limited level of Grade A supply,              WC2                        Group
by 2018’s 12.5 million sq ft. The West End saw                  in addition to a subdued development pipeline for the
                                                                                                                                     Regent’s Place, 10 Brock   Facebook               144,525
particularly strong performance during Q4 reaching              first two quarters of 2020.
take-up of 1.4 million sq ft, the strongest quarter since
                                                                There is currently 14.5 million sq ft under construction
                                                                                                                                     Street, NW1
                                                                                                                                                                                                          28%
the turn of the century and 67% above the 10-year                                                                                    Broadwalk House, 5         Monzo                  122,280
                                                                in Central London of which 49% is pre-let, leaving                                                                                    UP ON THE 10-YEAR QUARTERLY AVERAGE
quarterly average.                                                                                                                   Appold Street, EC2
                                                                7.7 million sq ft available. Under construction supply due
There were 12 deals above 100,000 sq ft throughout 2019, of                                                                          Gateway Central, White     L’Oreal                120,217
                                                                for delivery in 2020 is currently 59% pre-let overall, rising
                                                                                                                                     City, W12
which the majority (five) took place in Q4 2019. The largest
                                                                                                                                                                                                      4.96%
                                                                to 63% for buildings in excess of 100,000 sq ft which
deal in 2019 was EBRD’s acquisition of 365,000 sq ft at         remain in particularly high demand. 22 Bishopsgate, the
5 Bank Street, E14 but Q4 was particularly notable for seeing   largest building under construction in Central London                                                                                 VACANCY RATE
deals by both Apple (156,000 sq ft at 22 Bishopsgate, EC2)      due for completion in Q1 2020, was 56% pre-let at year end
and Facebook (144,000 sq ft at Regent’s Place, NW1) in the      2019 following a flurry of deals later in the year.
same quarter.                                                                                                                       TOP TENANT SECTORS
                                                                Despite a constrained pipeline at year end, construction                                                                              UNDER CONSTRUCTION
The TMT & Creative sector accounted for the largest             starts due for 2020 may partially alleviate the existing                    TMT & Creative                 Financial Services
proportion of take-up in Q4 2019 at 23%. The Financial          constrained supply. Developments due to commence
                                                                                                                                            23%                            23%                                   14.5 million sq ft
Services sector also made up 23%, although a significant        include HB Reavis’s Elizabeth House, SE1 (1.2 million sq ft),
proportion was accounted for by the growing Fintech             M&G’s 40 Leadenhall Street, EC3 (900,000 sq ft) and                                                                                              49%
sector. Serviced offices accounted for 16% of take-up for       Brookfield’s One Leadenhall, EC3 (400,000 sq ft) which                                                                                           pre-let
the quarter, which was a significant fall on Q3 2019’s 31% of   will significantly boost supply.
serviced office take-up. Serviced office operators acquired
                                                                RENTAL GROWTH
a total of 2.5 million sq ft in 2019 which was up 5% on
2018’s 1.9 million sq ft.                                       Central London prime rents grew by 2.0% over the year
                                                                to Q4 2019. On a quarterly basis, due to subdued supply
                                                                across most of the City, prime rents grew in a number of
                                                                submarkets including Holborn, Clerkenwell and Waterloo.
                                                                Contrastingly, West End prime rents stayed stable, although
                                                                record rents continue to be achieved for the best Grade A
                                                                space. Rent free periods are largely stable at 24 months for a
                                                                10-year term across Central London.
Occupier market                      Central London map               Central London markets                                  Investment                          Investment commentary                                  Investment data                          Contact

       Central London                             Charts                               West End                                                      City                                     East London                                             Midtown

CENTRAL LONDON TAKE-UP                                                                                                         UNDER CONSTRUCTION
                                                                                West End          East London                                                                                                                                       Completed        West End
  sq ft                                                                                                                           sq ft
                                                                                City              10 year quarterly average                                                                                                                         East London      City
                                                                                                                                10,000,000
4,000,000

3,500,000
                                                                                                                                8,000,000

3,000,000

2,500,000                                                                                                                       6,000,000

2,000,000
                                                                                                                                4,000,000
1,500,000

1,000,000
                                                                                                                                2,000,000

 500,000

          0                                                                                                                               0
                12 13 13 13 13 14 14 14 14 15 15 15 15 16 16 16 16 17 17 17 17 18 18 18 18 19 19 19 19                                        2012          2013       2014     2015          2016          2017          2018      2019     2020           2021        2022
                Q4 Q1 Q2 Q3 Q4 Q1 Q2 Q3 Q4 Q1 Q2 Q3 Q4 Q1 Q2 Q3 Q4 Q1 Q2 Q3 Q4 Q1 Q2 Q3 Q4 Q1 Q2 Q3 Q4

OFFICE AVAILABILITY RATES                                                       City               East London                 PRIME RENTAL GROWTH                                                                                                  City           East London
                                                                                West End           Central London                                                                                                                                   West End       Central London
  %
 14%
                                                                                                                                  %

                                                                                                                                 0.3
 12%
                                                                                                                                 0.2

 10%
                                                                                                                                  0.1

  8%
                                                                                                                                  0

  6%                                                                                                                             -0.1

  4%                                                                                                                             -0.2

  2%                                                                                                                            -0.3

                                                                                                                                -0.4
  0%                                                                                                                               2009       2010           2011        2012          2013          2014          2015          2016      2017            2018             2019
              2007   2008   2009   2010   2011   2012    2013   2014   2015   2016         2017          2018           2019
Occupier market                     Central London map                      Central London markets                        Investment                 Investment commentary                    Investment data              Contact

          Central London                                   Charts                                  West End                                    City                                   East London                           Midtown

West End
TAKE-UP                                                         AVAILABILITY AND DEVELOPMENT                                       KEY DEALS - Q4 2019                                               KEY STATS THIS QUARTER
The 87 deals in the West End over Q4 2019 amounted              West End availability fell for the fourth consecutive               Address                   Occupier                 Sq Ft
to a highly impressive 1.4 million sq ft of take-up activity.   quarter to 3.3 million sq ft. This was a 9% decrease                                                                                 TOTAL TAKE-UP FOR Q4
                                                                                                                                    Regent’s Place,           Facebook                144,525
This is 67% above the ten-year average of quarterly             from Q3 and is considerably lower than the ten-year
take-up and is the highest result since Q1 2013. The two        average. As a result, the vacancy rate fell to 3.7%,
                                                                                                                                    10 Brock Street, NW1
                                                                                                                                                                                                     1.4 million sq ft
deals over 100,000 sq ft drove strong take-up, Facebook         the lowest level since Q3 2016.                                     Gateway Central,          L’Oreal                 120,217
took 145,000 sq ft at Regent’s Place, NW1 and L’Oreal                                                                               White City, W12
agreed 120,000 sq ft at Gateway Central, White City,            Seven developments completed in the West End in Q4
W12. Such an impressive quarter rounds off an even              totalling over 140,000 sq ft including 24 St James’s Square         Soho Place,
                                                                                                                                    1 Oxford Street, W1
                                                                                                                                                              Apollo Global
                                                                                                                                                              Management
                                                                                                                                                                                       83,334
                                                                                                                                                                                                         67%
better year with take-up in 2019 at its highest level in        (18,000 sq ft) and Verve, 40 Villiers Street (17,000 sq ft).
                                                                                                                                                                                                     UP ON THE 10-YEAR QUARTERLY AVERAGE
the West End since 2000.                                                                                                            86 Petty France, SW1      London                   58,402
                                                                Looking forward, 5.2 million sq ft is under construction
                                                                                                                                                              Transport
The TMT & Creative sector accounted for 23% of take-up          in the West End. The limited availability means tenants                                       Museum
primarily due to the Facebook deal which accounted              are still being forced to pre-let further in advance with the
for 10% of West End take-up alone during the quarter.           pipeline already 63% pre-let overall. The 2020 pipeline is          338 Euston Road, NW1      Skyscanner               44,505        3.65%
Financial Services was the next largest sector accounting       currently 70% pre-let putting particular pressure on the                                                                             VACANCY RATE
for 16%, the largest financial services acquirer was Apollo     near-term pipeline. Post 2020, the proportion of the pipeline
Global Management who took 83,334 sq ft at Soho Place.          that is pre-committed drops to a still impressive 57% which
While the serviced offices sector had an impressive third       is likely to continue to grow.
                                                                                                                                   TOP TENANT SECTORS                                                UNDER CONSTRUCTION
quarter of the year its proportion of take-up dropped down
to 11% in Q4, similar to the level it was in Q2.                RENTAL GROWTH
                                                                West End prime rents stayed stable over the year to                        TMT & Creative                 Financial Services                      5.2 million sq ft
Victoria was by far the strongest submarket accounting for                                                                                 23%                            16%
21% of Q4 take-up. Euston, Covent Garden, Fitzrovia and
                                                                Q4 2019 . However, the Hammersmith prime rent fell
                                                                marginally to £52.50 psf reflecting more supply than
                                                                                                                                                                                                                  63%
Hammersmith followed suit with these submarkets each                                                                                                                                                              pre-let
                                                                demand. A return to stronger demand for Q4 2019 despite
accounting for around 13%. Mayfair and St James’s had a
                                                                continued limited supply may generate rental growth
relatively poor quarter with take-up in these submarkets
                                                                in 2020, particularly for Grade A stock in well-connected
dropping by a third from Q3 to Q4. The largest deal in
                                                                submarkets. Rent free periods are currently stable at
Mayfair and St James’s was AMP Capital Investments Ltd
                                                                24 months but may see some downwards pressure for the
taking 22,497 sq ft at Berkeley Square House, W1.
                                                                best quality space.                                                                                                                  £115.00 per sq ft
                                                                                                                                                                                                     PRIME RENT

                     Nick Rock
                     Principal
                     +44 (0)7046 6517
                     nick.rock@avisonyoung.com
Occupier market                      Central London map                        Central London markets                         Investment                 Investment commentary                   Investment data              Contact

          Central London                                      Charts                                  West End                                     City                                  East London                           Midtown

City
TAKE-UP                                                           AVAILABILITY AND DEVELOPMENT                                         KEY DEALS - Q4 2019                                              KEY STATS THIS QUARTER
The 76 deals in the City amounted to 1.8 million sq ft            Availability continues its trend of falling since the                 Address                    Occupier               Sq Ft
for Q4 2019. This is 20% above the 10-year average                beginning of 2019 and stood at 5.3 million sq ft in Q4.                                                                               TOTAL TAKE-UP FOR Q4
                                                                                                                                        22 Bishopsgate, EC2        Apple                 156,442
despite a fall in the number of deals from Q3 and                 This is below the 10-year average as is the vacancy
rounds off a successful 2019 for the City market where            rate which, at 4.78%, reached its lowest level since                  53-64 Chancery Lane,       The Office            150,000        1.8 million sq ft
annual take-up levels reached their second highest                Q4 2016.                                                              WC2                        Group
level since 2014. Leading this success were seven deals
                                                                  Nine developments totalling an impressive 1.2 million sq ft           Broadwalk House,           Monzo                 122,280
over 50,000 sq ft with the largest being Apple taking
156,442 sq ft at 22 Bishopsgate.                                  completed during Q4. The largest completion was at                    5 Appold Street, EC2
                                                                                                                                                                                                            20%
                                                                  100 Bishopsgate, EC2 where 800,000 sq ft completed,                   Athene Place,              Deloitte Digital       76,497
Unsurprisingly, Financial Services made up the largest                                                                                                                                                  UP ON THE 10-YEAR QUARTERLY AVERAGE
                                                                  of which 86% is pre-let. The next biggest completion of               Shoe Lane, EC4
proportion of take-up in Q4 2019 at 26% with a key                the quarter was 97,000 sq ft at Helical’s Kaleidoscope, EC1           Wenlock Works, N1          Checkout.com           63,904
deal being Monzo’s acquisition of over 120,000 sq ft at           which is fully available at present.
                                                                                                                                                                                                        4.78%
Broadwalk House. While it was the leading sector in Q3,
TMT & Creative came in a close second with 25% of take-           There are 43 developments currently under construction
up, despite accounting for the largest deal in the quarter.       in the City totalling 8.3 million sq ft. 59% of the total sq ft                                                                       VACANCY RATE
                                                                  will be completed in 2020 while around a third will
The Serviced Offices sector continued growing and                 complete in 2021 and just under a tenth will complete in             TOP TENANT SECTORS
accounted for 21% of Q4 take-up. The largest serviced             2022. Of all that is under construction, 41% is pre-let which
offices deals were The Office Group taking 150,000 sq ft          leaves 4.8 million sq ft still available. The top ten                                                                                 UNDER CONSTRUCTION
                                                                                                                                              Financial Services                TMT & Creative
at 53-64 Chancery Lane, WC1 and Canopius Managing                 developments due for delivery are particularly constrained                  26%                               25%
Agents Ltd taking 52,000 sq ft at 22 Bishopsgate, EC2.            with 55% of the 5.9 million sq ft currently pre-let.                                                                                               8.3 million sq ft
This performance is in stark comparison to Q4 2018 when
serviced offices accounted for only 13% of City take-up.          RENTAL GROWTH
                                                                                                                                                                                                                     41%
                                                                                                                                                                                                                     pre-let
Finally, while pre-lets accounted for a record 41% of City        Rents saw above average 4.2% growth over the year
take-up in Q3 this figure dropped to a still notable 27%          to Q4 2019.
in Q4 despite there only being nine pre-let deals out of the
                                                                  The majority of City submarkets saw rents rise over the
total 76. As with the previous two quarters, the majority
                                                                  period, driven by constrained supply and strong demand.
of City pre-letting activity was inside the City Core where
seven such deals took place.
                                                                  Clerkenwell rents rose to £75.00 per sq ft in Q4 2019, the
                                                                  highest submarket rent across the wider City.
                                                                                                                                                                                                        £70.00 per sq ft
                                                                                                                                                                                                        PRIME RENT

                      Jeremy Prosser
                      Principal
                      +44 (0)20 7911 2865
                      jeremy.prosser@avisonyoung.com
Occupier market                     Central London map                        Central London markets                          Investment                Investment commentary                Investment data              Contact

          Central London                                      Charts                                  West End                                      City                             East London                           Midtown

East London
TAKE-UP                                                           AVAILABILITY AND DEVELOPMENT                                         KEY DEALS - Q4 2019                                          KEY STATS THIS QUARTER
East London reported 100,000 sq ft of office take-up              Availability in the last quarter of 2019 rose to 2.5 million          Address                     Occupier           Sq Ft
in Q4 2019. This is the lowest seen in the area in 2019           sq ft, a 15% increase on the previous quarter. This figure                                                                        TOTAL TAKE-UP FOR Q4
                                                                                                                                        The Columbus Building,      Revolut           32,188
and 60% below the ten-year average. Unlike Q1 to Q3               is 92% above the ten-year average and is the highest
2019, there were no deals above 50,000 sq ft in Q4                quarterly availability for the East London market since
                                                                                                                                        7 Westferry Circus, E14
                                                                                                                                                                                                    99,700 sq ft
which contributed to the lower take-up level.                     Q3 2003. The most substantial new space to come onto                  Exchange Tower, E14         QBE Europe        31,796
                                                                  the market in Q4 2019 was 514,000 sq ft at 1 Westferry
Three of the four transactions which completed in Q4 2019                                                                               20 Canada Square, E14       Wateraid          25,147
                                                                  Circus, E14.
were located in the Docklands market, representing                                                                                      S9 International Quarter,   FNZ UK Ltd        10,579            59%
89% of the total take-up as the submarket continues to            There are currently four office buildings under construction          E20
                                                                                                                                                                                                    DOWN ON THE 10-YEAR QUARTERLY AVERAGE
dominate East London leasing activity. The two largest            in East London, totalling 1 million sq ft, all of which are due
deals of Q4 were 32,000 sq ft at The Columbus Building,           to complete in 2020. Of these developments 46% have
E14, to Revolut and QBE’s acquisition at Exchange Tower,          been prelet, leaving 552,000 sq ft available. The largest
E14, also of 32,000 sq ft. Both of these transactions were
within the financial services sector, making it the largest
                                                                  building under construction is Blackstone’s Cargo at 25
                                                                  North Colonnade, E14 which boasts 341,000 sq ft due for
                                                                                                                                                                                                    11.49%
                                                                                                                                       TOP TENANT SECTORS
acquirer by sector in Q4 at 64%.                                  completion in Q4 2020, followed by 14 Westfield Avenue,                                                                           VACANCY RATE
                                                                  E20, which has been entirely prelet to HMRC totalling                                                        Government
Strong performance earlier in the year means that                                                                                             Financial Services
                                                                  298,000 sq ft and is due for completion in Q1 2020. There                                                    & Services
East London take-up in 2019 totalled 1.2 million sq ft.                                                                                       64%                              25%
                                                                  remains significant development potential in the pipeline
This is the highest annual figure observed in the market          with planning permission granted to 8.9 million sq ft of office                                                                   UNDER CONSTRUCTION
since 2016 and is 34% above the ten-year annual average.          space in the East London market.
                                                                                                                                                                                                                 1.0 million sq ft
                                                                  RENTAL GROWTH
                                                                  Prime rents rose by 5% in the year to Q4 2019. Rents in                                                                                        46%
                                                                                                                                                                                                                 pre-let
                                                                  Stratford remained at £45.00 per sq ft, whilst Canary Wharf
                                                                  rents grew to £45.00 per sq ft. Rent free periods are also
                                                                  unchanged at 30 months.

                                                                                                                                                                                                    £42.50 per sq ft
                                                                                                                                                                                                    PRIME RENT

                     Alasdair Gurry
                     Director
                     +44 (0)20 7911 2831
                     alasdair.gurry@avisonyoung.com
Occupier market                       Central London map                       Central London markets                         Investment              Investment commentary                     Investment data              Contact

          Central London                                      Charts                                   West End                                    City                                 East London                           Midtown

Midtown
TAKE-UP                                                           AVAILABILITY AND DEVELOPMENT                                         KEY DEALS - Q4 2019                                             KEY STATS THIS QUARTER
The Midtown market achieved a take-up figure of                   The availability of office stock in Midtown was                       Address                      Occupier            Sq Ft
410,000 sq ft in Q4 2019. This was the second largest             745,000 sq ft for Q4 2019, a 27% decline from Q3.                                                                                    TOTAL TAKE-UP FOR Q4
quarterly figure in 2019, a 45% increase on the previous                                                                                53-64 Chancery Lane,         The Office         150,000
                                                                  This equates to a reduced vacancy rate of 2.1% for
quarter and 23% up on the 5-year average. Despite                 the market. The completion of Kaleidoscope, EC1
                                                                                                                                        WC2                          Group
                                                                                                                                                                                                       410,000 sq ft
only reporting 12 transactions, the significant size of           (97,000 sq ft), and the refurbishment of One Gray’s                   Athene Place, EC4            Deloitte Digital   76,497
a few deals helped to bolster take-up, with two of the            Inn, WC1 (20,000 sq ft), brought considerable Grade
                                                                                                                                        110 High Holborn, WC1        Knotel             42,750
three largest deals of 2019 occurring in the final quarter.       A space to the hungry market, although both remain
                                                                  available. No new schemes broke ground in Q4 2019,                    1 Bartholomew Close, EC1 BDB Pitmans            38,156             23%
Take-up for the year to Q4 2019 totalled 1.5 million sq ft,       suggesting that the restrained supply will continue                   10 Bloomsbury Way, WC1       Genius Sports      23,586         UP ON THE 5-YEAR QUARTERLY AVERAGE
a 4% decrease on 2018 and the lowest annual figure                in the future.
observed since 2016. However, Midtown’s 2019 take-up
is in line with the 5-year annual average for the market.         Schemes currently under construction in Midtown total
                                                                  926,000 sq ft, of which 55% is pre-let leaving 420,000 sq ft
The largest sector by take-up in Q4 was the serviced              available. There is just over 510,000 sq ft due for delivery in                                                                      2.1%
offices sector, a 54% proportion of total take-up in              2020 of which 81% is currently pre-let. Of the five sites due        TOP TENANT SECTORS                                              VACANCY RATE
Midtown. The majority of this space went to The Office            for completion, only two still have availability totalling just
Group who leased 150,000 sq ft at 53-64 Chancery Lane,            over 100,000 sq ft. Post 2020, the pipeline is currently 22%                    Serviced Offices            TMT & Creative
WC1, providing 36% of Q4’s overall take-up, in the                pre-let. Mainly, Smith & Charter, EC1 remains fully available                   65%                         34%
largest deal of the quarter and the year. The second              for pre-let offering 166,000 sq ft due to complete in Q1 2022.                                                                       UNDER CONSTRUCTION
largest acquisition was by Deloitte Digital who pre-let
76,000 sq ft at Athene Place, EC4, accounting for 18%             RENTAL GROWTH                                                                                                                                     930,000 sq ft
of Q4 take-up in Midtown. Holborn was the strongest
submarket with take-up achieving 295,000 sq ft, equal             Prime rents in Midtown have increased for the second                                                                                              55%
to 71% of Midtown’s Q4 total. Clerkenwell experienced             quarter in a row to £70.00 psf in Q4 2019, up from                                                                                                pre-let
another subdued quarter, reporting only 71,000 sq ft              £68.50 psf in Q3 2019. Bloomsbury remains the most
as constrained supply continues to restrain take-up               expensive submarket per sq ft in Midtown, with prime
in the submarket.                                                 rents standing at £80.00 psf for the eighth consecutive
                                                                  quarter. Incentives in the submarket have remained stable
                                                                  at 24 months.
                                                                                                                                                                                                       £70.00 per sq ft
                                                                                                                                                                                                       PRIME RENT

                      Charles Walker
                      Associate
                      +44 (0)20 7911 2687
                      charles.walker@avisonyoung.com
Occupier market                  Central London map               Central London markets                                  Investment                   Investment commentary                     Investment data             Contact

   Central London                          Charts                                    West End                                                  City                          East London                                Midtown

Central London map
West End
City                                                                                                                                                                                                           Stratford
East London
Parks                                                                                          Camden

                                                                                                                      King’s
                                                                                                                      Cross                                                      West City
                                                                                     Regent’s
                                                                                       Park              Euston                                        Shoreditch/               Northern City
                                                                                                                                                       Spitalfields

                                                                                                                                     Clerkenwell
                                                                                                                      Bloomsbury

                                                                                Marylebone           Fitzrovia
                                                                   Paddington                                                                                                Aldgate –
                                                                                                                                    Chancery          City
                                                                                                                                      Lane            Core                  Whitechapel
                                                                                                               Soho       Covent                                      EC3
                                                                                               Mayfair                    Garden

                    White City
                                                                  Hyde Park                                 St James’s

                                                                                                                                                   London Bridge                                            Canary
                                                                                                Green Park/
                                                                                                 St James’s
                                                                                                                                   Waterloo                                                                 Wharf

                                                     Kensington                 Belgravia/
                                                                              Knightsbridge               Victoria
                                                                                                           Victoria                                                                                          Fringe
                            Hammersmith
                                                                                                                                                                                                            Docklands

                                                                  Chelsea

                                                                                   Battersea
                                                                                     Park
                                            Fulham
                                                                                Vauxhall/Battersea
Occupier market                  Central London map                Central London markets                 Investment                 Investment commentary                 Investment data                 Contact

           Central London                          Charts                             West End                                 City                              East London                           Midtown

Central London markets
 West End                   Prime headline rent   Rent free period   Business rates   Total occupancy costs      City                      Prime headline rent     Rent free period   Business rates   Total occupancy costs
                                (£ per sq ft)        (months)         (£ per sq ft)         (£ per sq ft)                                      (£ per sq ft)          (months)         (£ per sq ft)         (£ per sq ft)
Mayfair                           £115.00                24              £51.37              £176.62           City Tower                        £90.00                  24               £26.77              £127.02
St James's                        £115.00                24              £49.00              £174.25           Holborn                           £70.00                  24               £29.24              £109.49
Soho                               £95.00                24              £43.73              £148.98           City Core                         £70.00                  24               £27.13              £107.38
Belgravia / Knightsbridge          £92.50                24              £41.62              £144.37           West City                         £70.00                  24               £27.13              £107.38
Chelsea                            £95.00                22              £38.99              £144.24           Clerkenwell                       £75.00                  24               £24.50              £109.75
North of Oxford St                 £85.00                24              £41.62              £136.87           EC3                               £67.50                  24               £27.92              £105.67
Kensington                         £72.50                22              £46.36              £129.11           London Bridge                     £65.00                  24               £27.40              £102.65
Fitzrovia                          £82.50                24              £35.56              £128.31           Waterloo                          £70.00                  24               £23.97              £104.22
Covent Garden                      £85.00                24              £31.61              £126.86           Northern City                     £70.00                  24               £20.81              £101.06
King's Cross                       £80.00                24              £33.19              £123.44           Shoreditch/Spitalfields           £67.50                  24               £18.97               £96.72
Victoria                           £77.50                24              £35.50              £123.25           Aldgate/Whitechapel               £57.50                  24               £21.07               £88.82
Bloomsbury                         £80.00                24              £31.87              £122.12
Euston                             £75.00                24              £29.24              £114.49             East London               Prime headline rent     Rent free period   Business rates     Total occupancy
Paddington                         £75.00                24              £28.19              £113.44                                           (£ per sq ft)          (months)         (£ per sq ft)     costs (£ per sq ft)
Camden                             £60.00                24              £28.19               £98.44           Canary Wharf                      £45.00                  30               £13.43               £66.18
Battersea PS                       £60.00                24              £16.07               £86.32           Stratford                         £45.00                  30               £8.96                £64.21
Hammersmith                        £52.50                24              £22.13               £84.88           Other Docklands                   £32.50                  30               £10.54               £53.29
Vauxhall                           £58.00                24              £16.07               £84.32
Fulham                             £47.50                24              £21.07               £78.82
White City                         £55.00                24               £8.96               £74.21
Occupier market        Central London map                   Central London markets                        Investment                 Investment commentary                          Investment data                      Contact

            Central London               Charts                                    West End                                       City                                 East London                                    Midtown

                                  Investment market – in brief
                                  BORIS BOUNCE                                                                                        BULLISH BUYERS
                                  After a subdued 2019, the final month of the year 2019 saw a considerable boost to                  A return to activity at the year end from investor groups who were quieter while
                                  investment volumes following improved sentiment brought by the Conservative victory                 uncertainty endured, created a significant boost to total investment volumes in Q4 2019.
                                  in the general election. Central London volumes for the 4th quarter of the year reached             This was particularly true of Malaysian, German and North American investors which
                                  £4.8 billion, which was up on the preceding quarter by 87% and above the 10-year average            made up a combined 35% of total investment volumes, compared to just 7% in Q3 2019.
                                  by 31%.
                                                                                                                                      Malaysian investor KWAP re-entered the market in Q4 2019 with its purchase of 100
                                  Q4 2019 was the busiest final quarter of the year since 2014. December 2019 was one of              Cheapside for £141 million after a hiatus of over five years. Similarly, Malaysia’s EPF acquired
                                  the single strongest months on record. PonteGadea purchased The Post Building, WC1 for              Premier Place, EC2 via CBREGi, which was their first acquisition since their purchase of
                                  £610 million, EPF purchased Premier Place, EC2 for £327 million (4.25 %), KWAP purchased            Battersea Power Station, SW8 which was a joint venture with fellow Malaysian PNB.
                                  100 Cheapside, EC2 for £141 million (4.10% NIY) and DEKA purchased 40 Chancery Lane, WC2
                                                                                                                                      Furthermore, German investors including DEKA and REInvest bought in the City in Q4
                                  for £123.5 million (4.25% NIY).
                                                                                                                                      following a longer period of subdued activity from German Funds. DEKA were repeat buyers
                                                                                                                                      during the quarter acquiring both 40 Chancery Lane, WC2 for £123.5 million (4.25% NIY) and
                                  BIG IS BACK
                                                                                                                                      51 Moorgate, EC2 for £61.75 million (4.00% NIY). Likewise, REInvest acquired Aurum, Lombard
CHRIS GORE                        There were five deals above £250 million in the fourth quarter which was considerably               Street, EC3 for £76.5 million (4.16% NIY), which is fully let to St James’s Place Wealth
Principal                         above the first three quarters of the year combined during which only two deals above               Management.
                                  this level were recorded, albeit Citi’s acquisition of 25 Canada Square, E14 in Q1 2019 was the
                                  largest deal of the year with a purchase price of £1.1 billion. The sale of 25 Canada Square, E14   There were 7 acquisitions by North American investors in Q4 2019, (up from just 2 in
                                  made up 9% of total 2019 investment volumes alone. Volumes are increasingly driven by a             Q3 2019), of which over half had lot sizes above £100 million. Following a 3 year hiatus, North
                                  few large deals due to a distinct lack of stock. The sale of 25 Canada Square, E14 made up 9%       American investor Brookfield was also a repeat buyer in Q4 2019 with acquisitions
There were 7 acquisitions         of total 2019 investment volumes and the sale of the Post Building, WC1 made up 13% of Q4           at London Wall Place, EC2 where they consolidated their holding and acquired Oxford
by North American                 volumes alone.                                                                                      Properties’ 50% stake for £354 million (4.20% NIY) and Nexus Place, EC4 which it acquired
investors in Q4 2019,                                                                                                                 for £169.4 million (4.78% NIY).
up from just 2 in Q3 2019         With 2019 having seen no pricing growth due to uncertainty and a lack of depth
and of which over half            to demand, London now stands at a considerable pricing discount to mainland Europe                  BREXIT
had lot sizes above               which is driving investment activity from investors attracted by the relative good value
                                                                                                                                      A lack of stock and heightened political uncertainty in 2019 led to the lowest annual
£100 million.                     and potential for capital appreciation. With demand now returning to the London market,
                                                                                                                                      investment volumes since 2011; however the performance in the final quarter is evidence
                                  prime City Core yields contracted 25 bps for the fourth quarter of the year.
                                                                                                                                      that confidence appears to have been restored with the strong occupational market
                                                                                                                                      fundamentals back in focus, driving interest for core and value-add stock. Overseas investors
                                                                                                                                      who were put off London during the midst of uncertainty are increasingly looking to
                                                                                                                                      London as a safe haven while their own countries manage other political issues. This
                                                                                                                                      provides London with much needed context on the global stage, and to many offering fair
                                                                                                                                      value when compared to core yields in most of the mature European markets.
Occupier market                     Central London map                      Central London markets                    Investment                   Investment commentary                Investment data               Contact

     Central London                                  Charts                                West End                                       City                             East London                          Midtown

Investment commentary                                                                                                                                                           KEY STATS THIS QUARTER

Investment volumes reached £4.8 billion for Q4 2019, 31% above the 10-year average and 11% above the same period in 2018, representing a significant                            TRANSACTION VOLUMES
pick-up in activity after the General Election. Overall, 2019 investment volumes totalled £12 billion which was 34% down on 2018 and 20% down on the
10-year average. There were a total of 57 transactions recorded in Central London in Q4 2019 which was 5% below the 10-year average and 15% below the                           £4.8 billion
same period in 2018. This suggests a rise in average lot size in order to explain higher overall volumes.

Q4 2019 recorded 14 deals over £100 million signifying a return to investor         The purchaser breakdown changed dramatically from Q3 to Q4 2019 with
confidence in the market. By comparison, the first three quarters of the year       overseas investors accounting for 81% of purchaser activity in Q4 2019, up from                    31%
saw a total of 17 deals over £100 million. The largest transaction in Q4 2019       just 21% in Q3 and reflecting the return of overseas interest following greater             UP ON THE 10-YEAR QUARTERLY AVERAGE
was Ponte Gadea’s acquisition of the Post Building, WC1 for £610 million, which     certainty brought by the election. A weak start to the year, despite a return
was the largest West End investment sale by lot size since 2013. The second         to strength in the final quarter, took 2019 West End investment volumes to
largest transaction, and the largest in the City market, was M&G’s purchase of      £3.6 billion which was 37% down on the 10-year average and 45% down on 2018.
                                                                                                                                                                                VOLUMES BY MARKET
Gotham City, 40 Leadenhall Street, EC3 for £355 million. The two aforementioned
                                                                                    East London investment volumes totalled £110 million for Q4 2019 with just one
investment transactions signify continued interest by investors in both core                                                                                                    CITY               WEST END             EAST LONDON
                                                                                    deal recorded, the purchase of 17 Columbus Courtyard, E14 by a JV between
                                                                                                                                                                                £3.1               £1.6                 £110
long-income and value-add stock.
                                                                                    Macquarie, Sun Hung Kai & Co and DPK Quay. Due to Citi Group’s purchase of 25
The City market was the star performer for Q4 2019 with volumes reaching            Canada Square, E14 for £1.1 billion in Q1 2019, 2019 was the strongest year for East        billion            million              million
£3.1 billion, 56% above the 10-year average and 16% above the same period           London investment volumes since 2014 and the fourth strongest year of all time,
in 2018. In addition to the acquisition of Gotham City, EC3 by M&G, there were      50% up on the 10-year average.
a further nine deals above £100 million, and 25 deals under £100 million. The
                                                                                    YIELDS
majority of purchasers came from overseas making up a massive 74% of total                                                                                                      VOLUMES BY INVESTOR TYPE
City investment volumes, and eight out of ten transactions which were above         City prime yields contracted slightly in Q4 2019 as investor interest returned to
£100 million were by overseas investors. European investors made up 26%, Asian      drive pricing upwards. The City Core prime yield now stands at 4.00%. West End
investors 25% and North American investors 24% of total investment activity.        prime yields remained stable across all submarkets including Mayfair / St James’s
Despite a strong Q4 2019, a weak start to the year meant total 2019 volumes         where yields continue to stand at 3.50%, unchanged since 2016.
reached £6.7 billion, 17% below the 10-year average and 40% below 2018.                                                                                                         OVERSEAS           UK                  UK PROPERTY
                                                                                                                                                                                INVESTORS          INSTITUTIONS        COMPANIES
In the West End, investment volumes reached £1.6 billion which was 10% above
the 10-year average and 7% above the same period in 2018. There were three          In the West End, investment volumes reached                                                 77%                11%                 10%
transactions over £100 million in the West End, close to half of the annual total   £1.6 billion which was 10% above the 10-year average
of seven.                                                                           and 7% above the same period in 2018.
                                                                                                                                                                                   4.00%                          3.50%
                                                                                                                                                                                CITY PRIME YIELD              WEST END PRIME YIELD
Occupier market                    Central London map                             Central London markets                 Investment                                               Investment commentary                                                                                           Investment data                                                            Contact

             Central London                                          Charts                                  West End                                          City                                                                                                           East London                                                                     Midtown

CENTRAL LONDON QUARTERLY VOLUMES VS NUMBER OF DEALS                                                                               CENTRAL LONDON YIELDS Q4 2019
    £ ‘000

12,000                                                                                                                      100

                                                                                                                            90
10,000
                                                                                                                            80          5
                                                                                                                                                  4.75          4.75                       4.75
                                                                                                                                                                                                          4.5                     4.5
                                                                                                                            70                                                                                                                         4.25                    4.25           4.25        4.25      4.25       4.25
8,000
                                                                                                                                                                                                                                                                                                                                                     4             4                   4
                                                                                                                            60
                                                                                                                                                                                                                                                                                                                                                                                                  3.5
 6,000                                                                                                                      50

                                                                                                                                                                 Hammersmith/West London
                                                                                                                            40

                                                                                                                                                                                                                                                                                                                                                               Marylebone/Fitzrovia
                                                                                                                                                                                                                                                       City northern fringe
 4,000

                                                                                                                                                                                                                                  Euston/Kings Cross

                                                                                                                                                                                                                                                                                                                                                                                                  Mayfair/ St James’s
                                                                                                                                                                                                          City eastern fringe
                                                                                                                            30

                                                                                                                                                                                                                                                                                                                               Covent Garden
                                                                                                                                                                                           Canary Wharf
                                                                                                                            20

                                                                                                                                                                                                                                                                                Clerkenwell
                                                                                                                                                  Paddington

                                                                                                                                                                                                                                                                                              Southwark
 2,000

                                                                                                                                                                                                                                                                                                                                                  City Core
                                                                                                                                      Stratford

                                                                                                                                                                                                                                                                                                          Holborn

                                                                                                                                                                                                                                                                                                                    Victoria
                                                                                                                            10

                                                                                                                                                                                                                                                                                                                                                                                      Soho
              2013          2014               2015                      2016       2017              2018           2019

     City     East London   West End   10 year average         Number of deals

LARGEST INVESTMENT DEALS OF Q4 2019                                                                                               NEWLY AVAILABLE ON MARKET Q4 2019

 Address                                              Price             Yield    Month         Purchaser                           Address                                                                                      Vendor                                                                                                         Price                                       Yield
                                                      (£m)               (%)                                                                                                                                                                                                                                                                   (£m)                                         (%)
 Post Building, Museum Street, WC1                       610             3.95    Dec-19        PonteGadea                          The Cabot, 25 Cabot Square, E14                                                              Hines                                                                                                          390                                         4.75
 Gotham City, 40 Leadenhall, EC3                         355              VP     Dec-19        M&G Real Estate                     Sanctuary Buildings, SW1                                                                     Hana                                                                                                           285                                         4.20
 London Wall Place, EC2                                  354             4.20    Nov-19        Brookfield                          Cannon Green, EC4                                                                            Kiwoom                                                                                                         140                                         4.50
 Premier Place, EC2                                      327             4.25    Dec-19        EPF                                 5 St James’s Square, SW1                                                                     Ocubis                                                                                                          75                                         2.90
 Alban Gate, London Wall, EC2                            285             5.90    Dec-19        King Street Capital                 Camden Works, NW1                                                                            Hermes                                                                                                         43.4                                        5.00
Occupier market                                    Central London map                                      Central London markets                                         Investment                             Investment commentary                                           Investment data                                   Contact

              Central London                                                      Charts                                                   West End                                                        City                                                East London                                                    Midtown

Should you wish to discuss any details within
this update please get in touch.

Jeremy Prosser                                              Nick Rock                                                  Alasdair Gurry                                               Chris Gore                                                  Jamie Olley                                                 Charles Walker
Principal, City Agency                                      Principal, West End Agency                                 Director, City and Docklands Agency                          Principal, City Investment                                  Principal, City Investment                                  Associate
+44 (0)20 7911 2865                                         +44 (0)7046 6517                                           +44 (0)20 7911 2831                                          +44 (0)20 7911 2036                                         +44 (0)20 7911 2802                                         +44 (0)20 7911 2687
jeremy.prosser@avisonyoung.com                              nick.rock@avisonyoung.com                                  alasdair.gurry@avisonyoung.com                               chris.gore@avisonyoung.com                                  jamie.olley@avisonyoung.com                                 charles.walker@avisonyoung.com

Daryl Perry                                                 Fiona Don
Head of UK Research                                         Senior Researcher
+44 (0)20 7911 2340                                         +44 (0)20 7911 2753
daryl.perry@avisonyoung.com                                 fiona.don@avisonyoung.com

Visit us online
avisonyoung.co.uk/research

Avison Young
                                                                                                                                                                                                                                                                                                                                                  @AYUKviews
65 Gresham Street, London EC2V 7NQ
Avison Young is the trading name of GVA Grimley Limited. 2020 Avison Young Created: 02/20 Ref: 12019

This report has been prepared by Avison Young for general information purposes only. Whilst Avison Young endeavours to ensure that the information in this report is correct it does not warrant completeness or accuracy. You should not rely on it without seeking professional advice. Avison Young assumes no responsibility for errors or omissions in this
publication or other documents which are referenced by or linked to this report. To the maximum extent permitted by law and without limitation Avison Young excludes all representations, warranties and conditions relating to this report and the use of this report. All intellectual property rights are reserved and prior written permission is required from
Avison Young to reproduce material contained in this report.
You can also read