Central London office analysis - Avison Young
←
→
Page content transcription
If your browser does not render page correctly, please read the page content below
Central London markets Contact
Charts
Central
RESEARCH
London
office
analysis
Q1 2019
View >
OCCUPATIONAL MARKET
Central London take-up totalled 2.7 million sq ft for Q1
2019, in line with the 5-year quarterly average.
INVESTMENT MARKET
Investment transaction volumes were down in Q1 2019 with
£2.8 billion recorded, however this was only 11% below the same
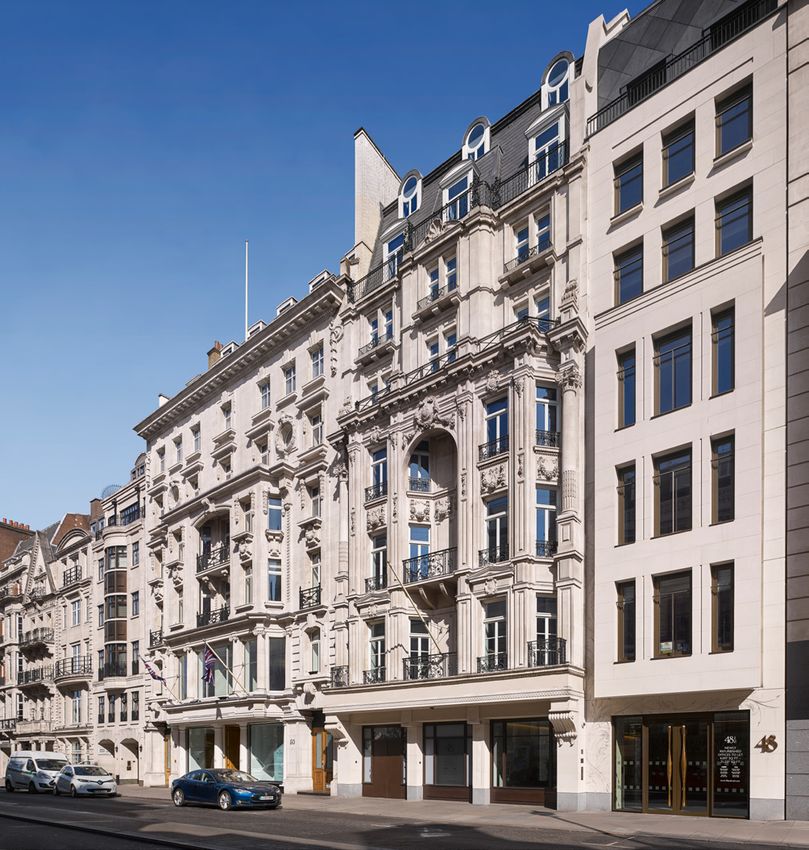
period last year. 48 Pall Mall, St James’s SW1: Avison Young are currently instructed as joint letting agents on behalf of Real Estate Management (UK) Limited.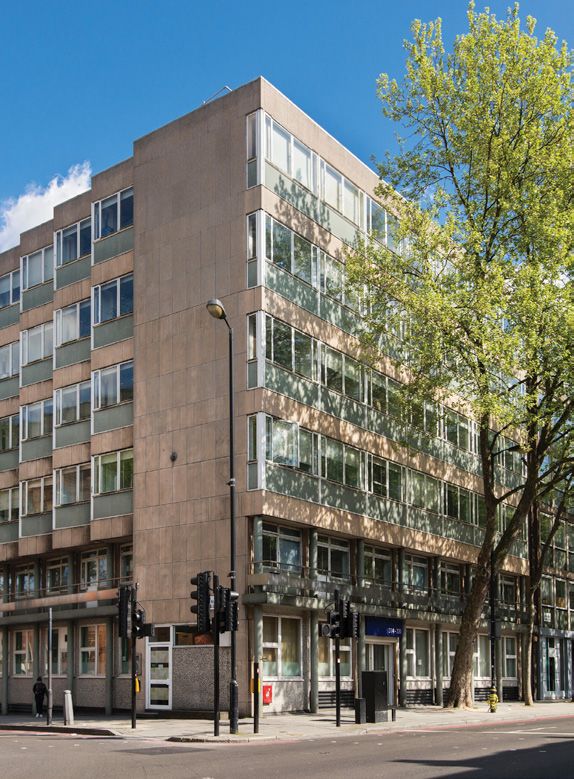
Occupier market       Investment          Investment commentary                          Investment data                   Central London map                       Central London markets                          Contact

       Central London               Charts                                   West End                                     City                                 East London                                    Midtown

                              Occupier market – in brief
                              With London in the midst of uncertainty surrounding Brexit and the now revised October deadline, Q1 2019 was quieter than normal as occupiers and investors
                              who were able to, held off their decisions until after the now redundant 29th March Brexit date. Greater certainty on the impact of Brexit on occupation
                              was brought by the recent ruling that the European Medicines Agency (EMA) at Churchill Place are unable to exit their lease on the grounds of ‘frustration’
                              over EU departure.

                              Nevertheless, last year was a record breaker and should not be downplayed by negative       An uncertain market has forced some occupiers to increase the efficiency of their
                              headlines in the past three months. Take-up in 2018 was 30% up on the 10-year average       business occupation with staff packed more densely into offices. This further drives
                              making 2018 the best performing year by take-up in a decade.                                up demand for the best quality space, but also makes the market more competitive.
                                                                                                                          The ‘space as a service’ agenda allows landlords to differentiate their offering, and they
                              Indeed, London’s success is no longer in response to cyclical conditions but instead is
                                                                                                                          are often successful in achieving the best occupancy rates and the highest rents.
                              the product of London’s ability to respond to changing technology and provision of
                              the right spaces and places that allow companies to attract the best talent to grow and     With an increasingly distinct separation between demand for the best and
                              sustain their businesses.                                                                   poorer quality second hand space, investors are waking up to the opportunity of
                                                                                                                          refurbishments but with significant caution around pricing.
                              Despite subdued overall transaction volumes, occupier demand continues unabated for
                              the best market supply, of which transport connectivity is an essential component. With     Underpinning the changing market is the growing serviced office sector which is
PATRICK O’KEEFFE              the development pipeline still constrained, larger occupiers have few options available,    providing an alternative to tenants without the perceived commitment, cost and
Principal                     especially those with space requirements over 100,000 sq ft. With reduced development       associated time constraints of ‘conventional offices’. This creates a greater separation
                              availability and improved transport connectivity, occupier requirements are changing        between demand for the best quality unit sizes, and for second hand space that
                              with increasing numbers of tenants willing to consider several locations within Central     increasingly sees lower demand due to the impact of the sector. The growth in this
                              London, providing the appropriate amenities.                                                sector is exacerbated as serviced office providers take larger amounts of space. This
                                                                                                                          further limits the level of supply for the best quality space on the market, although the
The market will               This quarter has seen continued good preletting activity, further eating into the already
                                                                                                                          space will remain available but under a different guise.
continue to be supply-        limited level of development supply. 74% of preletting activity for Q1 2019 was made
                              up from lettings in close proximity to future Crossrail stations. These included lettings
led rather than demand
                              at The Cabot, E14, 100 Liverpool Street, EC2, 18-19 Hanover Square, W1 and The Brunel
driven and the lack
                              Building, W2. Evidently, the Crossrail delay announcements are not deterring occupiers
of supply will help to
                              from seeing future potential in these submarkets.
underpin many of the
lettings this year
Occupier market                      Investment                Investment commentary                           Investment data              Central London map                     Central London markets           Contact

       Central London                                     Charts                                  West End                                  City                               East London                       Midtown

Central London
                                                                                                                                                                                              KEY STATS THIS QUARTER
TAKE-UP                                                         AVAILABILITY AND DEVELOPMENT                                     KEY DEALS - Q1 2019
Central London take-up totalled 2.7 million sq ft in Q1         Availability rose in Q1 2019, reflecting a fall in                                                                            TOTAL TAKE-UP FOR Q1
                                                                                                                                  Address                     Occupier            Sq Ft
2019, 33% below Q4 2018 but up 7% on the 10-year
quarterly average, providing evidence the market
                                                                take-up to 12.4 million sq ft. Current availability is
                                                                therefore 14% up on Q4 2018 and 5% up on the                      S1 Handyside, N1            Sony               133,000      2.7 million sq ft
continues to weather uncertainty and surpassing                 10-year average. The development pipeline                         25 Wilton Road, SW1         Spaces              83,000
expectations for the start of the year.                         comprises 18.0 million sq ft, a 15% rise on Q4
                                                                                                                                  155 Bishopsgate, EC2        Bulb                76,000
Q1 has seen a lack of larger deals transact in Central          2018 construction levels.
                                                                                                                                  The Cabot, E14              Spaces              71,000
                                                                                                                                                                                                 7%
London. With the exception of the deal to Sony at S1            Developments that commenced construction during the                                                                           UP ON THE 10-YEAR QUARTERLY AVERAGE
Handyside, N1 totalling 133,000 sq ft, no other deals were      quarter included 6-8 Bishopsgate, EC3, Ropemaker Place,           127 Kensington High         Spaces              70,000
recorded over 100,000 sq ft. Nevertheless, demand for           EC2 and 1 Portsoken Street, E1, all of which are within           Street, W8
larger floor plates in developed buildings continues to         the City. As a proportion of the pipeline therefore, the
remain high with a number of key developments receiving
further prelets in the quarter, including The Cabot, E14, The
                                                                amount of prelet space has fallen to 46%. Developments
                                                                over 100,000 sq ft that previously saw severe availability
                                                                                                                                                                                              6.4%
Brunel Building, W2, 100 Liverpool Street, EC2, and 18-19                                                                        TOP TENANT SECTORS
                                                                shortages are now just 51% prelet overall, however there                                                                      VACANCY RATE
Hanover Square, W1.                                             is currently significant variation in available development
                                                                supply between submarkets.                                               Financial services              Serviced offices
The top four sectors accounted for around 70% of all take-
up for Q1 2019. Financial Services was top at 20%, followed                                                                              20%                             20%
                                                                RENTAL GROWTH                                                                                                                 UNDER CONSTRUCTION
by serviced offices at 20%, TMT & Creative at 15% and
                                                                Prime rents grew by 0.78% on a rolling annual basis
Government and Services at 13%. The return of Financial
Services as top performer, despite overriding economic
                                                                in Q1 2019, yet were largely stable on a quarterly                                                                                      18 million sq ft
                                                                basis as the supply-led market held rents steady.
challenges, demonstrates the changing nature of tech
demand and the Fintech sector. The top Financial Services
                                                                                                                                                                                                        46%
                                                                Prime City and West End rents are currently stable at                                                                                   prelet
acquisitions for Q1 were FIS Global’s acquisition of 56,000     £67.50 per sq ft and £115.00 per sq ft respectively. Rent free
sq ft at 25 Canada Square, E14 and Mastercard’s acquisition     periods are stable at 24 months.
of 53,000 sq ft at Watermark Place, EC4, both of which
classify themselves as tech companies but which operate
within the Financial Services sector.
Serviced office take-up continued to be robust with Q1
take-up accounting for 27% of the 2018 total at quarter
end. The largest serviced office deal was to Spaces (IWG)
at 25 Wilton Road, SW1 totalling 83,000 sq ft which was
the second largest overall deal of the quarter. With an
additional 71,000 sq ft taken at The Cabot, E14 and 70,000
sq ft at 127 Kensington High Street, W8, Spaces (IWG) was
the largest acquirer of space during Q1 2019.
Occupier market                     Investment           Investment commentary                               Investment data                                Central London map                                Central London markets                         Contact

    Central London                               Charts                                West End                                                      City                                          East London                              Midtown

CENTRAL LONDON TAKE-UP                                                                                                              UNDER CONSTRUCTION
                                                                                       West End         East London                                                                                                                                Completed           West End
    sq ft                                                                                                                             sq ft
                                                                                       City             10 year quarterly average                                                                                                                  East London         City
                                                                                                                                    12,000,000
4,000,000

3,500,000                                                                                                                           10,000,000

3,000,000
                                                                                                                                    8,000,000
2,500,000

2,000,000                                                                                                                           6,000,000

1,500,000
                                                                                                                                    4,000,000

1,000,000
                                                                                                                                    2,000,000
 500,000

            0                                                                                                                                 0
                12 12 12 12 13 13 13 13 14 14 14 14 15 15 15 15 16 16 16 16 17 17 17 17 18 18 18 18 19                                            2012       2013          2014          2015          2016     2017   2018   2019   2020            2021           2022
                Q1 Q2 Q3 Q4 Q1 Q2 Q3 Q4 Q1 Q2 Q3 Q4 Q1 Q2 Q3 Q4 Q1 Q2 Q3 Q4 Q1 Q2 Q3 Q4 Q1 Q2 Q3 Q4 Q1

OFFICE AVAILABILITY RATES                                                       City                 East London                    PRIME RENTAL GROWTH                                                                                     City               Docklands
                                                                                West End             Central London                    %                                                                                                    West End           Central London
%                                                                                                                                      40
14%

                                                                                                                                       30
12%
                                                                                                                                       20
10%
                                                                                                                                       10

 8%
                                                                                                                                        0

 6%
                                                                                                                                      -10

 4%
                                                                                                                                      -20

 2%                                                                                                                                   -30

 0%                                                                                                                                   -40
            2007    2008    2009   2010   2011   2012   2013   2014   2015    2016            2017        2018        2019               2009        2010           2011          2012          2013          2014     2015   2016     2017                 2018              2019
Occupier market Investment Investment commentary Investment data Central London map Central London markets Contact
Central London Charts West End City East London Midtown
West End
KEY STATS THIS QUARTER
TAKE-UP AVAILABILITY AND DEVELOPMENT KEY DEALS - Q1 2019
Take-up totalled 1.1 million sq ft in Q1 2019, in line Supply rose marginally to 3.9 million sq ft, which TOTAL TAKE-UP FOR Q1
Address Occupier Sq Ft
with Q4 2018 and up on the 10-year average by equates to a vacancy rate of 4.7% and is just above
33%. The largest West End deal of the quarter was to the 10-year quarterly average of 4.0 million sq ft. S1 Handyside, N1 Sony 133,000 1.1 million sq ft
Sony at S1 Handyside, N1 who acquired 133,000 sq Despite continued strong demand, there is a lack of 25 Wilton Road, SW1 Spaces 83,000
ft. The second and third largest deals of the quarter larger development supply on the market.
were both to Spaces at 25 Wilton Road, SW1 and 127 127 Kensington High Spaces 70,000
Kensington High Street, W8.
The wider pipeline is limited with 74% of space in Street, W8 33%
developments over 100,000 sq ft prelet. In comparison,
18-19 Hanover Square, Glencore UK 53,000 UP ON THE 10-YEAR QUARTERLY AVERAGE
The Serviced Office sector accounted for the largest developments below 100,000 sq ft are currently just
proportion of take-up for Q1 2019 at 23%. The TMT & 13% prelet. Q1 2019 saw occupational deals further W1 Ltd
Creative sector accounted for a similar 22% of take-up, eat into the availability of good supply with six prelets, 21 Dartmouth Street, House of 52,000
4.7%
largely due to Sony’s acquisition at King’s Cross which contributing 310,000 sq ft of take-up, or 28%. This is an SW1 Commons
alone accounted for 12% of West End take-up. increase from the 2018 figure in which prelets totalled
1.1 million sq ft. The smaller unit sizes and second hand VACANCY RATE
By submarket, King’s Cross saw the most activity
space increasingly sees poorer letting activity, despite
recording 172,000 sq ft of take-up across six deals. The
rising levels of tenant space on the market. TOP TENANT SECTORS
Mayfair and St James’s combined submarket had a good
quarter recording 175,000 sq ft of take-up, 86% above Hammersmith currently has the highest level of UNDER CONSTRUCTION
the 10-year average. The figure was boosted by two availability accounting for 15% of the market. This can be Serviced offices TMT & creative
significant deals over 50,000 sq ft, to Glencore and 18-19
Hanover Square, W1 and to Cinven Partners at 21 St
attributed mostly to Bechtel House and The Ark. The two
buildings account for 35% of all availability over 100,000
20% 22% 5.7 million sq ft
James’s Square, SW1. sq ft in the West End. King’s Cross and Paddington have 62%
two of the lowest vacancy rates in Central London prelet
following strong letting activity, particularly for the
development stock.
RENTAL GROWTH
Prime rents grew by 1% on a rolling annual basis
but on a quarterly basis were largely stable, with the £115 per sq ft
exceptions of Soho and Hammersmith where rents
fell slightly to £95.00 per sq ft and £52.50 per sq ft PRIME RENT
respectively.
It is constrained supply and robust demand has kept rents
Patrick O’Keeffe
largely stable, and rent free periods are also stable at 24
Principal
months across the majority of West End submarkets.
+44 (0)20 7911 2768
pok@avisonyoung.comOccupier market Investment Investment commentary Investment data Central London map Central London markets Contact
Central London Charts West End City East London Midtown
City
KEY STATS THIS QUARTER
TAKE-UP AVAILABILITY AND DEVELOPMENT KEY DEALS - Q1 2019
City take-up totalled 1.4 million sq ft in Q1 2019, in City availability rose to 6.2 million sq ft for Q1 2019, TOTAL TAKE-UP FOR Q1
Address Occupier Sq Ft
line with Q1 last year and only 6% below the 10-year 15% up on Q4 2018 but still 4% below the 10-year
average. Q1 2019 recorded 97 deals which was only average. The vacancy rate stands at 6.7%, up from 155 Bishopsgate, EC2 Bulb 76,000 1.4 million sq ft
slightly down on Q4 2018’s figure of 107 (despite year 5.8% at the end of last year. 100 Liverpool Street, EC2 Millbank 68,000
end volumes reaching 2.4 million sq ft) and up from
Overall, the development pipeline is still relatively Watermark Place, 1 Mastercard 53,000
the 71 deals recorded in Q1 2018.
constrained with only 9.9 million sq ft under construction Angel Lane, EC4 6%
The average deal size for the quarter was just 13,621 sq ft, of which 36% is prelet. However, this is a marked increase
2 Minster Court, EC3 WeWork 50,000 DOWN ON THE 10-YEAR QUARTERLY AVERAGE
its lowest since 2012. This was due to a lack of larger in under construction levels since the end of last year.
transactions with no deals recorded over 100,000 sq ft. 1 New Change, EC4 Phillip Morris 49,000
At year end, there was just 2.6 million sq ft in
The largest transaction in Q1 was Bulb’s acquisition of
developments over 100,000 sq ft due for delivery post
6.7%
76,000 sq ft at 155 Bishopsgate, EC2, at £47.50 per sq ft.
2020 (9 schemes), of which 45% was prelet. The figure has
Financial Services was the most active sector accounting risen to 4.8 million sq ft in Q1 (16 schemes), of which 27%
TOP TENANT SECTORS VACANCY RATE
for 20% of all take-up. A lack of larger deals this quarter is prelet.
meant that the dominance of one particular sector was
During Q1, construction started on 6-8 Bishopsgate
not the result of a single deal. Serviced offices followed Financial services Serviced offices
(710,000 sq ft), Ropemaker Place (480,000 sq ft) and
behind accounting for 15% of take-up of which the
1 Portsoken Street (190,000 sq ft). The addition of these 20% 15% UNDER CONSTRUCTION
largest deal was to WeWork acquiring 50,000 sq ft at
developments has increased the volume of post 2020
2 Minster Court, EC3.
completions to 5.0 million sq ft, of which 25% is prelet. 9.9 million sq ft
Demand continues to be strong for the best stock in the
best locations with a two tier market increasingly evident. RENTAL GROWTH 36%
100 Liverpool Street has seen deals of 63,000 sq ft to Prime rents grew by 0.3% on a rolling annual basis. prelet
Millbank and 40,000 sq ft to Peel Hunt, achieving higher Quarterly rental levels were stable across all core
than average rents for the area. Clerkenwell continues submarkets with marginal rental growth in the West City
to perform well recording 130,000 sq ft of take-up in Q1, and Holborn submarkets. These areas continue to receive
equivalent to 10% of all City take-up and up from just 2% high demand with low supply, benefiting from high
in Q1 2018. The largest Clerkenwell acquisition was by
£67.50 per sq ft
occupier demand in neighbouring Clerkenwell. Rent free
The Open Society at Herbal House taking 29,000 sq ft on periods are stable at 24 months.
a 15-year lease. PRIME RENT
Jeremy Prosser
Principal
+44 (0)20 7911 2865
jeremy.prosser@avisonyoung.comOccupier market Investment Investment commentary Investment data Central London map Central London markets Contact
Central London Charts West End City East London Midtown
East London
KEY STATS THIS QUARTER
TAKE-UP AVAILABILITY AND DEVELOPMENT KEY DEALS - Q1 2019
Q1 2019 saw 210,000 sq ft of take-up, with no one East London availability rose to 2.3 million sq ft in TOTAL TAKE-UP FOR Q1
Address Occupier Sq Ft
deal accounting for the majority of the total. The Q1 2019, a substantial 45% rise on Q4 2018 and well
largest East London deal was to Spaces at The Cabot, above the 10-year average by 75%. The 430,000 sq ft The Cabot, 25 Cabot Spaces 71,000 210,000 sq ft
E14 where the serviced office operator acquired due to be completed in Q3 2019 at 5 Bank Street, E14 Square, E14
71,000 sq ft. The building is now fully let following contributed the most to the supply increase, albeit it 25 Canada Square, E14 FIS Global 56,000
a separate deal to the Office of Rail and Road is currently under offer to EBRD.
comprising 22,000 sq ft. S5 International Quarter, Nursing and 22,000 9%
The East London development pipeline comprises Midwifery
E20 DOWN ON THE 10-YEAR QUARTERLY AVERAGE
The majority of take-up for the quarter was recorded 2.6 million sq ft, of which 46% is prelet. The majority of Council
in the Canary Wharf submarket, which accounted supply in the pipeline is due for delivery by year end 2019
for 180,000 sq ft of take-up. The market has recently totalling 1.9 million sq ft, of which 57% is prelet. Of the The Cabot, 25 Cabot The Office of 22,000
Square, E14 Rail & Road
12.1%
benefited from increased tenant space, providing more 720,000 sq ft under construction due for completion post
Grade A options for tenants in a historically under- 2020 however, just 25% is prelet. These include Wood 25 Canada Square, E14 Amec 20,000
supplied market. The market also particularly benefits Wharf, E14 where 400,000 sq ft is due for delivery in 2020, VACANCY RATE
from larger floor plates that are increasingly limited in and 25 North Colonnade, E14 which will provide 330,000
other submarkets and are available at a discounted rent. sq ft of refurbished space, located adjacent to the Canary
Wharf Elizabeth Line station.
On a quarterly basis, Financial Services and Serviced TOP TENANT SECTORS
UNDER CONSTRUCTION
Offices accounted for 36% and 34% of take-up RENTAL GROWTH
Government
respectively. Despite East London’s recent high level of
government take-up, there was just one government
East London rents grew by 6.25% on a rolling annual basis TMT & creative & services 2.6 million sq ft
due to growth in Canary Wharf rental figures from £40.00 28% 22%
sector deal to the Nursing and Midwifery Council at S5
per sq ft to £42.50 per sq ft in H1 2018. On a quarterly basis, 46%
International Quarter, E20, totalling 22,000 sq ft. prelet
rents remained stable across Canary Wharf and Stratford.
Rent frees were unchanged at 24 months.
£42.50 per sq ft
PRIME RENT
Alasdair Gurry
Director
+44 (0)20 7911 2831
alasdair.gurry@avisonyoung.comOccupier market Investment Investment commentary Investment data Central London map Central London markets Contact
Central London Charts West End City East London Midtown
Midtown
KEY STATS THIS QUARTER
TAKE-UP AVAILABILITY AND DEVELOPMENT KEY DEALS - Q1 2019
Midtown take-up totalled 330,000 sq ft for Q1 2019, Midtown availability fell to 960,000 sq ft for Q1 2019, TOTAL TAKE-UP FOR Q1
Address Occupier Sq Ft
down 52% on Q4 2018, but only 9% below the 5-year down from 1.1 million sq ft at the end of last year. The
quarterly average. The largest deal of the quarter was vacancy rate now stands at a very low 2% together Herbal House, 10 Back The Open 29,000 330,000 sq ft
at Herbal House, 10 Back Hill, EC1 where The Open with a limited development pipeline going forward. Hill, EC1 Society
Society acquired 29,000 sq ft on a 15 year lease. Q1 Farringdon Place, 20 26,000
The under construction development pipeline currently
saw a scarcity of larger deals; by comparison Q4 2018
recorded three over 50,000 sq ft. There were 28 deals
comprises 410,000 sq ft overall, of which 36% is prelet. Farringdon Rood, EC1 9%
Developments over 50,000 sq ft currently total 200,000 6 New Street Square, EC4 Alix Partners 24,000
transacted overall, resulting in an average deal size of DOWN ON THE 5-YEAR QUARTERLY AVERAGE
sq ft, of which 55% is prelet. There are currently no
just 12,000 sq ft. One Bartholomew Close, Trade desk 20,000
developments over 100,000 sq ft in the market; the
The TMT & Creative sector accounted for the majority largest available development is Farringdon East which EC1A (The)
2.0%
of take-up in Q1 2019 at 28%. This was largely due will provide 90,000 sq ft due for delivery in Q4 2019. 1 Fleet Place, EC4 Langham Hall 18,000
to the impact of the burgeoning creative district in Ltd
Clerkenwell where 57% of the sector’s take-up was based. RENTAL GROWTH VACANCY RATE
The Government and Services sector followed next, Holborn prime rents saw marginal growth for Q1 2019,
accounting for 22% of take-up. increasing to £66.50 per sq ft. This is up from £65.00 per
sq ft at the end of last year and could be attributed to the
falling supply in the submarket, placing upwards pressure TOP TENANT SECTORS UNDER CONSTRUCTION
on rents. Bloomsbury rents remained at £80.00 per sq ft,
unchanged since Q1 2018. Similarly, rent free periods
Financial services Business services 410,000 sq ft
stayed stable in line with wider trends at 24 months.
37% 34% 36%
prelet
£66.50 per sq ft
PRIME RENT
Nick Rock
Principal
+44 (0)7046 6517
nick.rock@avisonyoung.comOccupier market Investment Investment commentary Investment data Central London map Central London markets Contact
Central London Charts West End City East London Midtown
Investment market – in brief
KEY STATS THIS QUARTER
STEADY INVESTMENT VOLUMES The market saw just a single transaction in January when
Investment volumes totalled £2.8 billion in Q1, a sharp Arax purchased Euston House, NW1 for £95.0m, 4.64% NIY. TRANSACTION VOLUMES
decline from Q4 last year, but despite the uncertainty in the Investment activity then picked up through February and
market investment volumes were largely in line with Q1 from March with domestic investors particularly active. Motcomb £2.8 billion
previous years. Estates continued their acquisition spree with the off market
purchase of 100 Pall Mall, SW1 for £90.0m and on the same
There were 38 deals recorded in Q1, the lowest level in 10
years with an average deal size of just £72.6 million. One
street Lazari Investments purchased 50 Pall Mall, SW1 for
£59.16m, 4.25% NIY.
31%
transaction over £1 billion was recorded in Q1; Citi Group’s DOWN ON THE 10-YEAR AVERAGE
acquisition of 25 Canada Square, E14 for £1.1 billion, 4.23% UK FUNDS ONCE AGAIN NET SELLERS
NIY. Without its inclusion, volumes would be 86% down on UK funds continue to be net sellers across central London. The
Q1 2018. open ended funds have recently seen over £1bn of investor VOLUMES BY CITY
redemptions. Consequently the market anticipated a number of
The motive for the acquisition comes in response to the CITY WEST END EAST LONDON
sales of their most liquid assets, Central London offices.
introduction of IFRS 16 and changes to how commercial
CHRIS GORE leases are treated on a company’s balance sheet. This is the Completed transactions from Q1 include Aviva’s disposal of 4 £1.1 £420 £1.2
Principal fifth transaction in excess of £1bn to have completed in Matthew Parker Street, SW1 for £51.50m, 4.47% NIY to Charles billion million billion
London over the last two years, which, although headline Street Buildings, Nuveen selling Steward Building, E1 for
grabbing, masks the reality of this being a fairly slow moving £97.0m, 4.00% NIY to Al Rasheed Group, ASI’s off market sale of
market. Market sentiment for best in class assets remains 85-89 Southwark Street, SE1 for £37.50m, 4.12% NIY to RLAM
strong, with prime yields stable across the capital, primarily and their subsequent sale of 60 Charlotte Street, W1, £80.25m, VOLUMES BY INVESTOR TYPE
Investment volumes
totalled £2.8 billion in due to the weight of international capital chasing central 4.40% NIY to Westbrook Partners.
London investments.
Q1, a sharp decline from DEVELOPMENT STOCK TRADING WELL
Q4 last year, but despite We expect investment volumes to remain steady throughout Development stock continues to trade well with many REITs
the uncertainty in the 2019 given there are a number of high value properties and Property Companies looking to acquire new sites. Recent OWNER OVERSEAS UK PROPERTY
market investment currently under offer. Since the start of April, investment has deals include GPE putting the former London HQ of BT at OCCUPIER INVESTORS COMPANIES
volumes were largely
£1.1 £850 £250
picked up. However with the date when the UK will leave the 81 Newgate Street, EC2 under offer and Stanhope and The
in line with Q1 from EU being pushed back for the second time to October 2019, Baupost Group being selected as the preferred development
previous years we still expect to see some investors exercising caution with partners for the Royal Street site in Waterloo. Furthermore, we billion million million
new acquisitions. have seen competitive bidding, followed by interviews, on
TRANSACTION LEVELS DOWN IN THE WEST END Colechurch Street, SE1 and 87 Newington Causeway SE1 as
Overall the first quarter saw around £416 million across 10
well as strong interest in Blackfriars Crown Court, SE1 and 247
Tottenham Court Road, W1 before M&G withdrew the sale.
3.50% 4.25%
transactions in the West End, which represents the quietest WEST END PRIME YIELD CITY PRIME YIELD
first quarter for ten years.Occupier market Investment Investment commentary Investment data Central London map Central London markets Contact
Central London Charts West End City East London Midtown
Investment commentary
Q1 investment volumes fell to £2.8 billion for Q1 2019, a 31% decline on the 10-year average but only 11% down on Q1 2018. There were 38 314-320 Grays Inn Road
deals recorded for the quarter, one of the lowest levels on record and 37% down on this time last year.
There was a lack of larger transactions in the market in Q1 with just four The West End saw investment volumes fall to £420 million for Q1 2018,
transactions over £100 million, equating to a total of £1.5 billion. By down over 200% on the 10-year average and Q1 2018. There were no
comparison, Q1 2018 recorded nine transactions with total volumes of deals recorded over £100m, the largest transaction was Arax’s acquisition
£2.0 billion. of 24 Eversholt Street, NW1 for £95m, 4.83% NIY. By number of deals, Q1
2019 recorded just 10, the lowest level on record and considerably below
The figures were boosted by Citigroup’s purchase of their own offices at
this time last year when 26 deals transacted.
25 Canada Square, E14 for £1.1 billion, 4.23% NIY. On a submarket basis
therefore, East London outperformed recording the second highest There was a spread of activity across most West End submarkets for Q1
investment total on record, 258% above the 10-year average. There were 2019, although Victoria saw the most investment overall with £120m
only two deals recorded in the market in Q1 2019 but they were the two recorded in three deals. This is the second quarter in a row that Victoria
largest deals overall. has been the best performing submarket. Submarkets surrounding King’s
Cross also saw strong activity recording £110m in two deals, located in
Conversely, the City and West End markets saw investment volumes fall
Euston and Camden. There were two deals in Mayfair and St James’s for
dramatically. City investment volumes totalled £1.1 billion in Q1 2019,
the quarter recording £44m of investment, 26 St James’s Square, SW1
down 75% on the 10-year average and 52% down on Q1 2018. The largest
bought for £33m, and 11 Curzon Street, W1 bought for £11m.
deal to transact in the market in Q1 was Dukelease Properties’ acquisition
of 42-47 Minories, E1 for £121.25m. By number of deals, City investment We expect further sales to complete this year and the table overleaf shows
activity remained largely stable with 26 deals recorded, slightly below the a number of buildings that are currently on the market as UK funds look to
10-year average of 29, but in line with Q1 2018. benefit from continued liquidity across Central London.
The majority of purchaser activity in the City market in Q1 2019 was YIELDS
from overseas investors who accounted for 49% of the total. Although Prime yields were stable in Q1 2019 at 4.25% in the City and 3.50% in the
overseas investors still accounted for the majority of acquisitions, overseas West End.
investment also saw the largest fall by total volumes, dropping 160% on
the 10-year average. As a result, UK Property Companies accounted for a
higher overall percentage of 29%, although volumes remained in line with
previous quarters. Q1 investment volumes fell to £2.8 billion for
Q1 2019, a 31% decline on the 10-year average
but only 11% down on Q1 2018Occupier market Investment Investment commentary Investment data Central London map Central London markets Contact
Central London Charts West End City East London Midtown
CENTRAL LONDON QUARTERLY VOLUMES VS NUMBER OF DEALS CENTRAL LONDON YIELDS
8
100
7 90
5 5
80 4.75 4.75 4.75
6
4.5 4.5 4.5 4.5 4.5
4.25 4.25 4.25
70 4 4
5
3.5
60
Hammersmith/West London
4
50
Marylebone/Fitzrovia
3
40
City northern fringe
Euston/Kings Cross
Mayfair/ St James’s
City eastern fringe
Covent Garden
2 30
Canary Wharf
Paddington
Clerkenwell
Southwark
City Core
Stratford
Holborn
20
Victoria
1
Soho
10
2013 2014 2015 2016 2017 2018 2019
City East London West End 10 year quarterly average Number of deals
LARGEST INVESTMENT DEALS OF Q1 2019 AVAILABLE ON MARKET Q1 2019
Address Price Yield Month Purchaser Address Vendor Price Yield
(£m) (%) (£m) (%)
25 Canada Square, E14 1,100 Sub 4.5 Mar-19 Citi Group 20 Churchill Street, E14 M&G 300.0 4.55
30 South Colonnade, E14 130 Mar-19 LS Estates 15 Bonhill Street, EC2 L&G 110.0 5.23
42-47 Minories, EC3 121 4.95 Feb-19 Dukelease Properties 1 Lyric Square, W6 Schroders 105.5 4.75
169 Union Street, SE1 100 4.25 Feb-19 Brockton Capital LLP 25 Soho Square, W1 Aviva 75.0 4.00
12 Steward Street, E1 97 4.00 Jan-19 Al Rashed & Sons Group 4 Chiswell Street, EC1 Schroders 37.0 4.60Occupier market Investment Investment commentary Investment data Central London map Central London markets Contact
Central London Charts West End City East London Midtown
Central London map
West End
City
East London Stratford
Parks
Camden
King’s
Cross West City
Regent’s
Park Euston Shoreditch/ Northern City
Spitalfields
Clerkenwell
Bloomsbury
Marylebone Fitzrovia
Paddington Aldgate –
Chancery City
Lane Core Whitechapel
Soho Covent EC3
Mayfair Garden
White City
Hyde Park
London Bridge Canary
Green Park/
St James’s
Waterloo Wharf
Kensington Belgravia/
Knightsbridge Victoria
Fringe
Hammersmith
Docklands
Chelsea
Battersea
Park
Fulham
Vauxhall/BatterseaOccupier market Investment Investment commentary Investment data Central London map Central London markets Contact
Central London Charts West End City East London Midtown
Central London markets
West End Prime headline rent Rent free period Business rates Total occupancy costs City Prime headline rent Rent free period Business rates Total occupancy costs
(£ per sq ft) (months) (£ per sq ft) (£ per sq ft) (£ per sq ft) (months) (£ per sq ft) (£ per sq ft)
Battersea PS £60.00 24 £15.25 £85.50 City Core £67.50 24 £25.75 £103.50
Belgravia / Knightsbridge £92.50 24 £39.50 £142.25 Holborn £66.50 24 £27.75 £104.50
Bloomsbury £80.00 24 £30.25 £120.50 Aldgate/Whitechapel £57.50 24 £20.00 £87.75
Camden £60.00 24 £26.75 £97.00 Clerkenwell £70.00 24 £23.25 £103.50
Chelsea £95.00 22 £37.00 £142.25 EC3 £67.50 24 £26.50 £104.25
Covent Garden £85.00 24 £30.00 £125.25 London Bridge £63.00 24 £26.00 £99.25
Euston £75.00 24 £27.75 £113.00 Northern City £65.00 24 £19.75 £95.00
Fitzrovia £82.50 24 £33.75 £126.50 Shoreditch/Spitalfields £65.00 24 £18.00 £93.25
Fulham £47.50 24 £20.00 £77.75 Waterloo £67.50 24 £22.75 £100.50
Hammersmith £55.00 24 £21.00 £86.25 West City £70.00 24 £25.75 £106.00
Kensington £72.50 22 £44.00 £126.75
King's Cross £80.00 24 £31.50 £121.75 East London Prime headline rent Rent free period Business rates Total occupancy
Mayfair £115.00 24 £48.75 £174.00 (£ per sq ft) (months) (£ per sq ft) costs (£ per sq ft)
Mayfair/St James's £170.00 20 £51.00 £231.25 Canary Wharf £42.50 24 £12.75 £65.50
"super-prime"
Other Docklands £32.50 24 £10.00 £52.75
North of Oxford St £85.00 24 £39.50 £134.75
Stratford £45.00 24 £8.50 £63.75
Paddington £75.00 24 £26.75 £112.00
Soho £97.50 24 £41.50 £149.25
St James's £115.00 24 £46.50 £171.75
Vauxhall £58.00 24 £15.25 £83.50
Victoria £77.50 24 £33.50 £121.25
White City £55.00 24 £8.50 £73.75Occupier market Investment Investment commentary Investment data Central London map Central London markets Contact
Central London Charts West End City East London Midtown
Should you wish to discuss any details
within this update please get in touch.
Patrick O’Keeffe Chris Gore Jeremy Prosser Nick Rock Alasdair Gurry Fiona Don
Principal, West End Agency Principal, City Investment Principal, City Agency Principal, West End Agency Director, City and Docklands Agency Senior Researcher
+44 (0)20 7911 2768 +44 (0)20 7911 2036 +44 (0)20 7911 2865 +44 (0)7046 6517 +44 (0)20 7911 2831 +44 (0)20 7911 2753
pok@avisonyoung.com chris.gore@avisonyoung.com jeremy.prosser@avisonyoung.com nick.rock@avisonyoung.com alasdair.gurry@avisonyoung.com fiona.don@avisonyoung.com
Visit us online
avisonyoung.co.uk/research
Avison Young
@AYUKviews
65 Gresham Street, London EC2V 7NQ
Avison Young is the trading name of GVA Grimley Limited. ©2019 Avison Young Created: 05/19 Ref: 11875
This report has been prepared by Avison Young for general information purposes only. Whilst Avison Young endeavours to ensure that the information in this report is correct it does not warrant completeness or accuracy. You should not rely on it without seeking professional advice. Avison Young assumes no responsibility for errors or omissions in this
publication or other documents which are referenced by or linked to this report. To the maximum extent permitted by law and without limitation Avison Young excludes all representations, warranties and conditions relating to this report and the use of this report. All intellectual property rights are reserved and prior written permission is required from
Avison Young to reproduce material contained in this report.You can also read