Air quality model for Barcelona - J. Lao & O. Teixidó Energy & Air Quality Department, Barcelona Regional, Spain - WIT Press
←
→
Page content transcription
If your browser does not render page correctly, please read the page content below
Air Pollution XIX   25

Air quality model for Barcelona
J. Lao & O. Teixidó
Energy & Air Quality Department, Barcelona Regional, Spain

Abstract
Some cities and metropolitan areas have a hard time complying with EU
regulations regarding certain pollutant concentration levels. In 2008, Barcelona’s
monitoring stations reported NO2 levels above the EU limit of 40 µg/m3. This
paper shows the process and results of NO2 dispersion analysis in Barcelona
using 2008 as the base year, as well as the results of the 2020 forecast. Barcelona
City Council has drawn up an air-quality model as part of the “PECQ” (Energy,
Climate Change and Air Quality Plan for Barcelona 2011-2020) to help decision
makers implement actions aimed at reducing NO2. In the first stage, a real
inventory of vehicles was performed, recording over 90,000 vehicle plates and
also measuring 42,000 actual emissions via Remote Sensing Devices. We
discovered that the vehicles on the road are newer than the city census vehicles.
We also found out that real-world vehicle emissions are 16.2% higher than
COPERT. We used GIS tools to compile the geographical inventory of
emissions inside and outside the city. The base-year results show that 65.6% of
NO2 concentration levels come from vehicles, 8.6% from the residential and
commercial, 4.8% from industry, including heat and power production close to
the city, 2.1% from Barcelona Port, and 0.1% from Barcelona Airport. The local
background contribution was calculated as 10.1% and the regional background
accounts for 8.6%. The PECQ Plan will run projects from 2011 until 2020 aimed
at reducing NOX emissions in various sectors. Improvements in vehicle
technology are also expected. The 2020 forecast scenario shows that NO2
concentration levels will drop by 35% to reach EU standards.
Keywords: air quality, air pollution modelling, validation, Barcelona, dispersion
modelling, NO2, NOX, PECQ, emission inventory, RSD.

1 Introduction
The Barcelona PECQ 2011-2020 (acronym in Catalan of Barcelona’s Energy,
Climate Change and Air Quality Plan [1]) is an action plan directed by Barcelona

     WIT Transactions on Ecology and the Environment, Vol 147, © 2011 WIT Press
     www.witpress.com, ISSN 1743-3541 (on-line)
     doi:10.2495/AIR110031
26 Air Pollution XIX
city council and developed by Barcelona Regional (a public company) together
with the City Council. The general objectives are: to reduce the increase in
energy consumption, to reduce the increase in greenhouse-gas emissions
associated with the municipality, and to improve air quality in the city, especially
as regards NO2 and PM10, with a specific reduction target of 26% for NOX and
39% for PM10 emissions, in order to achieve European objectives for air-quality
levels.
The PECQ methodology includes a historical analysis of energy, GHG
emissions and air quality in Barcelona city, plus a battery of projects and
proposals for the next 10 years. It also contains the expected future scenario,
including an in-depth dispersion modelling analysis of the city and its
surroundings. The PECQ includes other interesting aspects such as the analysis
of social attitudes towards energy consumption, and the effects of the PECQ
Action Plan on the local and regional economy. The PECQ development process
also included extensive consultation with citizens and stakeholders, from the
design stage through to drafting of the Action Plan.
This paper will focus on the NO2 air-quality model for the city of Barcelona.
We will show the methodology, validation process, results of the base case
(2008) and Barcelona’s expected air quality by 2020 according to the various
policies and measures adopted under the PECQ Action Plan.
2 Barcelona air quality
Like other cities, Barcelona exceeds the annual average NO2 concentration
thresholds established by the EU to protect human health. This means that cities,
regions and countries must adopt new strategies, on various levels, aimed at
improving air quality in metropolitan areas. This includes vehicle manufacturers,
legislators, citizens, companies, and so on.
For years, Barcelona City Council and other public bodies have been working
to improve air quality through various measures involving industry and power
plants and by promoting renewable energy. Examples of this include the Solar
Thermal Bylaw [2] of 1999 or the application of the Barcelona Energy
Improvement Plan (2001-2010) [3].
Given that the main source of pollutants is road transport, Barcelona
metropolitan area has made remarkable efforts to achieve a modal split change.
This has included promoting the integration of public transport fares and the
improvement of public transport networks (bus, metro, trams). Barcelona has
also expanded the city’s bicycle network and created “Bicing” – a public bicycle-
rental service with a very low-cost flat rate. Another measure was to increase the
roll-out of parking meters for surface parking, in order to make private transport
systems less competitive.
Despite all the policies designed to make public transport more attractive and
to stimulate the modal split change from private vehicles to the public system,
there is still some way to go, since the city does not yet fall within the air-quality
standards set by Europe. The EU limit value for annual average nitrogen dioxide
concentration in 2009 was 42 µg/m3 (including a tolerance margin of 2 µg/m3
WIT Transactions on Ecology and the Environment, Vol 147, © 2011 WIT Press
www.witpress.com, ISSN 1743-3541 (on-line)Air Pollution XIX 27
applicable in 2009). Four out of a total of six measurement stations inside the
city exceeded the annual average limit.
As shown in Figure 1, NO2 station measurements for Barcelona city and
surrounding municipalities exceed EU NO2 limits, meaning that new initiatives
are required.
© Barcelona Regional, 2010.
42 µg/m3 41 µg/m3 62 µg/m3 46 µg/m3 50 µg/m3 46 µg/m3
45 µg/m3 Barcelona:
Cornellà de Barcelona: Barcelona: Sant Adrià Badalona
El Prat de
Llobregat Sants Eixample Ciutadella de Besòs 44 µg/m3
Llobregat
3 Montcada i
63 µg/m 3
51 µg/m3 40 µg/m Reixac
43 µg/m3 Barcelona: Barcelona: 44 µg/m3
L’Hospitalet de Barcelona -
Gràcia-St. Parc Vall Santa Coloma
Llobregat Poblenou
Gervasi d’Hebrón de Gramenet
Figure 1: Annual average NO2 concentration at measurement stations in
Barcelona and surroundings (2009).
3 Barcelona urban air-dispersion model
Within the PECQ, in order to focus the Action Plan most effectively, it was
essential to determine what activities and sectors are responsible for high NO2
concentration levels. A detailed inventory of emissions by sectors has been
developed for the base case year 2008 and distributed throughout the territory.
This emission inventory was one of the key inputs of the Barcelona Air-
Dispersion Model, a tool that helps decision-makers know what is happening
with air quality and what needs to be done in order to improve it.
3.1 Methodology
For atmospheric dispersion modelling we used ADMS-Urban [4], developed by
CERC in the UK. ADMS-Urban allowed us to calculate NO2 concentration
levels based on a Gaussian dispersion model with photochemical reactions and
an integrated street canyon model. The entire model is fully integrated in a
WIT Transactions on Ecology and the Environment, Vol 147, © 2011 WIT Press
www.witpress.com, ISSN 1743-3541 (on-line)28 Air Pollution XIX
Geographical Information System (GIS) database of emission sources, terrain
configurations and other relevant aspects.
The main features of the dispersion model used are:
Specific dispersion model for urban and metropolitan areas with
resolution down to street level.
Includes a meteorological pre-processing model.
Uses the “FlowStar” module, a processing module designed for hourly
flows and turbulence for high-resolution complex plots.
Can use hourly, daily and monthly input profile schedules for each source
emission.
Works with the OSPM model, specifically to assess the “Street Canyon”
effect resulting from the recirculation of air turbulence among buildings.
Uses the GRS chemistry scheme, a semi-empirical photochemical model
which includes the reactions of NO, NO2, O3 and many organic
compounds.
After gathering the data and in order to map an air-quality model, a high-
resolution grid was created with up to 150,000 virtual grid points across the
territory, plus 50,000 points next to roads using “intelligent gridding” software
capability. The result was a mean grid resolution of 35.2 metres in outlying parts
of the city and an estimated mean grid resolution of 17.6 metres in the city centre
in order to ensure higher accuracy. More than twelve processors were used,
working constantly for 30 days. Figure 7 (left) shows the map of NO2
concentration levels after model calibration for 2008. Keep in mind that reality is
more complex than the “typical profiles” or mean behaviours introduced in the
model. Therefore, unusual traffic jams, fires, construction work, unknown
emissions, and other situations can cause deviations between the models and
actual data, meaning that model calibration must always be carried out.
Actual hourly data from the measurement stations was also compared with
modelling results for virtual point detectors. Table 1 shows a comparison of
annual mean values and Figure 6 contains a monthly example of hourly
comparison.
3.2 Characteristics and emissions of vehicles in Barcelona
Since the road transport sector is the main emitter of pollutants, the PECQ
established a clear difference with previous studies of vehicle emissions. A real-
world characterisation of traffic was developed in order to find out what types of
vehicles are driven around the city, as well as their emissions. It is important to
mention that previous studies used the vehicle census of the city [5]. We will
show below that there is a major “gap” between the traffic on the streets and
what is listed in the city census via road tax. An example of this is that the
vehicles that use the streets everyday are newer on average than the census
vehicles. This is a key point for drawing up effective policies and calculating
related NOX reductions. It is also important to have a better idea of actual
emissions in order to obtain a better estimate in the air-dispersion model.
WIT Transactions on Ecology and the Environment, Vol 147, © 2011 WIT Press
www.witpress.com, ISSN 1743-3541 (on-line)Air Pollution XIX 29
Since it is a diffuse sector, traffic emissions must be determined indirectly,
based on vehicle km/year, total number of vehicles, average speed, and
methodologies based on emission factors (EF) by vehicle characteristics (fuel
type, engine size, weight and technology of the vehicle), such as CORINAIR
[6]/COPERT [7].
To improve EF methodology, Barcelona City Council conducted an ad-hoc
study [8] over 32 days in May and June 2009, setting up 16 roadside points for
measuring vehicle exhaust emissions, with a detector system called “RSD”
(Remote Sensing Device [9]). This technology can detect pollutant emissions
from vehicle exhaust pipes instantly and in a non-intrusive manner, using
infrared and ultraviolet light according to the Lambert-Beer law. This means that
vehicles do not have to modify their normal driving patterns and thousands of
vehicle license plates and exhaust vehicle emission data can be gathered in just a
few hours. The emission data shows the actual emissions of the vehicles, unlike
other methodologies based on standard emission factors, and the license plate
shows the vehicle type. This makes it possible to know the brand, vehicle model,
technical characteristics (power, weight, fuel, age, etc.), and city of residence
(census). We gathered 90,000 vehicle license plates and emissions data for more
than 42,000 vehicles after RSD exhaust data validation.
This study revealed some important aspects:
The average age of all vehicles is 5.7 years.
The cars driving around the city are newer (with an avg. age of 5.53
years) than the city vehicle census (9.13 years). This does not mean that
the census does not work properly. The difference only shows that older
vehicles get driven less than newer vehicles or, in other words, that
people who use their car every day tend to have newer vehicles.
Petrol cars are older (7.58 years) than diesel cars (4.43 years) due to a
social trend. In Spain, it is typical to buy a diesel car if your annual
mileage is very high, so daily car users buy more diesel cars than
weekend car users.
The pre-EURO class displays an interesting behaviour pattern. 20% of the
cars in the city vehicle census are pre-EURO; by contrast, the EURO
class only represents 8% of cars driven daily in the city streets.
The taxi fleet has an average age of 3.4 years, and the average age of
trucks is 6.5 years.
The most common fuel used by vehicles in the city is diesel at 55.1%,
followed by petrol at 44.1%, biodiesel at 0.6% and, finally, natural gas at
0.3%.
52% of the vehicles come from outside Barcelona city (they are not
included in the municipal census). As for cars, 51% come from outside
the city. In this group, 41% are petrol cars and 56% are diesel cars, since
it is more cost-efficient to own a diesel car if your annual mileage is very
high, as diesel is cheaper and more efficient than petrol. This makes sense
considering that 62% [10] of daily car trips in Barcelona are made by
people that live outside the city and commute in to work (or vice-versa).
This is a very important point, since municipal policies focusing on diesel
WIT Transactions on Ecology and the Environment, Vol 147, © 2011 WIT Press
www.witpress.com, ISSN 1743-3541 (on-line)30 Air Pollution XIX
cars (emitting more pollutants than petrol cars) included in the municipal
census will not be as effective as regional policies.
According to EURO class, 39.2% of vehicles are EURO IV, 34.8% are
EURO III, 14.4% are EURO II, 5.5% are EURO I and 5.6% are pre-EURO. It
should be noted that the number of EURO V vehicles is symbolic – 0.4% – since
this classification only applied to buses and trucks in 2009 (not to cars, vans or
motorcycles) and the measurements were taken in mid-2009. The segments with
the highest percentage of EURO II vehicle and older are petrol vans (LDV) with
44.2%, diesel buses and coaches with 34.7%, and petrol cars with 32.1%.
Average age (in years) of vehicles in Barcelona
MEAN 5,66
Special vehicles 3,58
BUS (Natural Gas) 4,86
BUS+COACH (Diesel) 7,41 EURO Class distribution of vehicle traffic in
Barcelona (2008): 4.439,16 Mveh-km/year
MDV + HDV (mean) 6,85
EURO V Pre-EURO
HDV (Diesel) 6,55 EURO I
EURO IV 0,4% 5,6% 5,5%
MDV (Diesel) 7,11 39,2%
EURO II
LDV (mean) 5,85 14,4%
LDV (Diesel) 5,64
LDV (Petrol) 9,14
MOTORBIKES (Petrol) 5,54
EURO III
CARS (mean) 5,53 34,8%
CARS (Híbrid) 1,38
CARS (Diesel) 4,43
CARS (Petrol) 7,58 years
0 2 4 6 8 10
Figure 2: Average age of different categories of vehicles (left) and EURO
class distribution of vehicles driving around city streets.
© Barcelona Regional, 2010.
As mentioned above, we gathered actual exhaust pipe emissions from 42,000
vehicles driving around the streets of Barcelona, and we compared actual
emissions from the “RSD” system with COPERT methodology. The average
result was that RSD measured 16.2% higher NOX emissions than COPERT
considering the same number of vehicles in city driving mode, with an average
speed of 21.3 km/h and the weather conditions for May/June.
RSD actual vehicle emission data with the annual share of vehicular traffic
shows that 34.2% of vehicle NOX emissions are from cars (29.3% from diesel
cars and 4.9% from petrol cars), followed by vans (LDV) 17.4%, medium and
heavy trucks (MDV and HDV) 15.7%, motorcycles and mopeds 12.3% (in
Barcelona, 22.8% of all private transport is by motorbike), private buses and
coaches 12.2%, and local public buses 8.2%. The average emission factor for
total traffic was 1.1297 grams of NOX per kilometre. Figure 3 shows total
emissions and emission ratio by vehicle class, and Figure 4 contains the
distribution according to mobility, vehicle emission and trips.
WIT Transactions on Ecology and the Environment, Vol 147, © 2011 WIT Press
www.witpress.com, ISSN 1743-3541 (on-line)Air Pollution XIX 31
tn NOx/any NOx emissions of vehicles in Barcelona by vehicle type (2008). TOTAL: 5.014,72 tn/year [COPERT+RSD] [total mean (♦): 1,1297 g/km] g/km
1.600 14
1.400 11,0090 12
9,9671
1.200
8,6364 10
1.000
8
800
6
600 4,4817
4
400
1,3240
200 0,8982 0,6074 0,8311 2
0,2711 0,0064
0 0
CAR (Petrol) CAR (Diesel) CAR (Hybrid) MOTORBIKE LDV (Petrol) LDV (Diesel) MDV (Diesel) HDV (Diesel) INTERURBAN URBAN BUS
(Petrol) BUS (Diesel) (Diesel+NatGas)
Figure 3: NOX emissions and emission ratio by vehicle type for Barcelona.
© Barcelona Regional, 2010.
4,9% 29,3% NOx (sorting criteria)
5,0%
6,6% PM
3,3% 33,0%
8,2% veh-km
5,3% Co lo urs with ho rizo ntal
20,3% 36,9% stripes: when the main
trips function of the vehicle is to
5,2% 16,1% transpo rt goo ds, not
29,3% people.
1,2%
1,1%
1,0%
10,8% 1,1%
CARS (Diesel)
11,5%
25,6% 0,9% LDV (Diesel)
16,7%
INTERCITY BUS (Diesel)
4,2
22,8% 10,6% MOTORBIKES (Petrol)
%
1,4% 14,2% HDV (Diesel)
12,3%
8,3% URBAN BUS (Diesel+NatGas)
21,1% 16,7%
MDV (Diesel)
CARS (Petrol)
12,2%
LDV (Petrol)
Figure 4: Related share of NOX emissions (sorting criteria), PM10 emissions,
mobility (veh-km) and trips. © Barcelona Regional, 2010.
3.3 Barcelona 2008 emissions inventory
Database quality is one of the most important aspects of air-quality modelling.
All the emission sources input into the air-dispersion model are shown below.
The base-case year for the emissions inventory is 2008.
Road transport: we used the COPERT emission model plus the XTRA
RSD recorded exhaust emission factors in order to include actual
emissions from vehicles. Hourly, daily, weekly and monthly traffic
profiles were also used.
Residential and commercial: we used the CORINAIR emission factor to
estimate NOX emissions from natural gas and LPG. Hourly and monthly
profiles were also implemented for this sector.
Industry and power plants: Actual emissions data for isolated emission
sources with continuous environmental control was used. Other industrial
emissions were estimated using CORINAIR methodology.
WIT Transactions on Ecology and the Environment, Vol 147, © 2011 WIT Press
www.witpress.com, ISSN 1743-3541 (on-line)32 Air Pollution XIX
Port: Land traffic, sea traffic and auxiliary vehicles in Barcelona’s Port
were taken into account using the COPERT+XTRA RSD system for the
first, and the CORINAIR methodology for the second and third. Monthly
profiles were implemented for this sector.
Airport: Barcelona Airport is 12 km from the city centre (outside the city
limits). NOX emissions were estimated using CORINAIR methodology
and taking into account LTO cycle for airplanes and auxiliary vehicles.
Hourly and monthly profiles were used for the airport.
All these data provide an inventory of NOX emissions for Barcelona and
surroundings covering 1,476 km2, of which Barcelona makes up only 7%, with
102 km2. Air-quality modelling involves studying a larger area, since pollution
does not respect municipal boundaries. Thus, total NOX emissions for the entire
area covered were 34,186 tonnes in 2008, while NOX emissions for Barcelona
city were 10,413 tn/y.
As regards Barcelona emissions, vehicle are responsible for 5,015 tn/y (4,299
according to COPERT plus 716 according to RSD), making up 48.2% of the city
emissions. The second source of emissions was Barcelona Port, with 3,078
tonnes or 29.5% (2,512.5 for sea traffic plus 565,7 for land activity). The third
source was industry and power plants, with 1,394 tn/y or 13.4%. And, finally, the
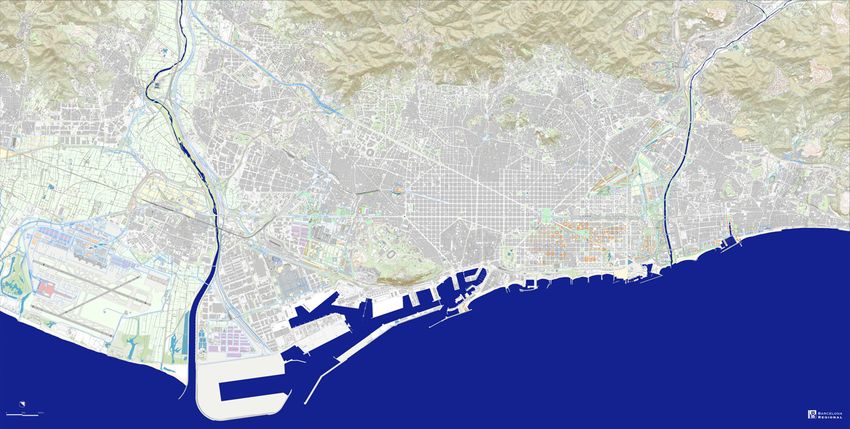
residential and services sectors, with 926 tn/y or 8.9%. Figure 5 shows the geo-
referenced emissions inventory.
NOX: (kg/year):
Barcelona City emissions (tn/y)
AIRPORT n/a Model area emissions map
PORT [ships] 2.512,5 (24,1%)
PORT [land vehicles] 565,7 (5,4%)
INDUSTRY & POWER PLANTS 1.394,5 (13,4%)
RESIDENTIAL & COMMERCIAL 925,8 (8,9%)
ROAD TRANSPORT [+RSD] 715,9 (6,9%)
ROAD TRANSPORT [COPERT] 4.298,8 (41,3%)
0
1.000
2.000
3.000
4.000
5.000
6.000
7.000
8.000
Model area emissions (tn/y)
AIRPORT 1.607,5 (4,7%)
PORT [ships] 2.512,5 (7,3%)
PORT [land vehicles] 565,7 (1,7%)
INDUSTRY & POWER PLANTS 10.012,3 (29,3%)
RESIDENTIAL & COMMERCIAL 1.462,0 (4,3%)
ROAD TRANSPORT [+RSD] 2.573,5 (7,5%)
ROAD TRANSPORT [COPERT] 15.453,2 (45,2%) © Barcelona Regional, 2010.
0
5.000
10.000
15.000
20.000
25.000
Figure 5: NO2 emissions map for 2008 (right) and source apportionment for
Barcelona city (top left) and for model area (bottom left).
3.4 Structural inputs for the model
Certain structural and meteorological inputs were also required in order to model
air quality. This is described briefly below:
WIT Transactions on Ecology and the Environment, Vol 147, © 2011 WIT Press
www.witpress.com, ISSN 1743-3541 (on-line)Air Pollution XIX 33
Meteorological data: actual hourly weather data for 2008 was used, taken
from an urban weather station located in the city.
Cartography: the topography and surface features of the area were taken
from the database of the Catalonian Institute of Cartography.
Road infrastructure: city network, highway network and bus network for
Barcelona city and surrounding municipalities were introduced in the
model with AAWT (annual average weekday traffic).
3-D building model: the 3-D Barcelona building model was used to model
the street canyon effect.
3.5 Background concentrations
Background concentration levels were based on hourly data from a specific
background concentration station located on the coast in the north of Catalonia
(Cap de Creus, Girona), 140 km from Barcelona. The annual average
concentration levels for 2008 were 4.26 µg/m3 for NO2, 0.30 µg/m3 for NO, and
74.4 µg/m3 for O3 [11].
3.6 Modelling results and validation process
By running the ADMS-Urban model for Barcelona with the geo-referenced
emissions inventory and the structural inputs of the modelled area, we obtained
an annual average NO2 concentration of 14% below actual concentration levels
for virtual point receptors representing real measurement stations. Therefore,
5 µg/m3 of NO2 was added in order to calibrate the model – called “local
background concentrations” – and the model was re-run.
After the calibration process, a very good estimate was obtained for all station
measurement points. Table 1 shows the actual concentration levels for 2008
compared with the modelled values. We also obtained a very good model
estimate for hourly concentration levels, as can be seen in Figure 6.
Table 1: NO2 model results vs. actual results.
Barcelona Actual NO2 Modelled NO2 Model /
Type of location
monitoring sites (µg/m3) (µg/m3) Actual (%)
Ciutadella Urban background 42.3 46.2 109%
Vall d’Hebrón Urban background 36.5 37.7 103%
Eixample High traffic site 65.4 63.2 97%
Gràcia High traffic site 62.6 57.9 93%
Poblenou Moderate traffic site 47.4 41.8 88%
Sants Moderate traffic site 45.3 50.0 110%
Average value --- 49.9 49.5 99%
The air-dispersion model for Barcelona revealed than 65.6% of the average
annual NO2 concentration level comes from traffic, 8.6% from the residential
and services sector, 4.8% from industry and power generation, 2.1% from
Barcelona Port, and only 0.1% from Barcelona Airport. In addition, 8.6% comes
from background pollution and 10.1% comes from “local background
concentrations” after the calibration process.
WIT Transactions on Ecology and the Environment, Vol 147, © 2011 WIT Press
www.witpress.com, ISSN 1743-3541 (on-line)34 Air Pollution XIX
200
ug NO2/m3 NO2 REAL HOURLY: Barcelona_Gràcia (ug/m3) NO2 MODELLED: Barcelona_Gràcia (ug/m3)
160
Weekend Weekend Weekend Weekend
120
80
40
0
200
ug NO2/m3 NO2 REAL ROLLING AVERAGE 24h: Barcelona_Gràcia (ug/m3) NO2 MODELLED ROLLING AVERAGE 24h: Barcelona_Gràcia (ug/m3)
160
120
80
40
0
3/10/08 (Fri)
4/10/08 (Sat)
6/10/08 (Mon)
7/10/08 (Tue)
10/10/08 (Fri)
11/10/08 (Sat)
13/10/08 (Mon)
14/10/08 (Tue)
17/10/08 (Fri)
18/10/08 (Sat)
20/10/08 (Mon)
21/10/08 (Tue)
24/10/08 (Fri)
25/10/08 (Sat)
27/10/08 (Mon)
28/10/08 (Tue)
31/10/08 (Fri)
1/10/08 (Wed)
2/10/08 (Thu)
8/10/08 (Wed)
9/10/08 (Thu)
15/10/08 (Wed)
16/10/08 (Thu)
22/10/08 (Wed)
23/10/08 (Thu)
29/10/08 (Wed)
30/10/08 (Thu)
5/10/08 (Sun)
12/10/08 (Sun)
19/10/08 (Sun)
26/10/08 (Sun)
Figure 6: Hourly and 24-hour rolling average actual and modelled NO2
concentration levels for Gràcia measurement station in October
2008. © Barcelona Regional, 2010.
4 Future scenario
A Trend Scenario was developed to estimate the future air quality of the city,
adding up the effects of the PECQ Action Plan. In general, certain foreseeable
aspects were taken into consideration, including: future population, mobility and
energy consumption considering new urban projects, social behaviour trends,
new infrastructures and public transport systems to be developed over coming
years, expected GDP growth, urban waste treatment, future power plants,
Barcelona Port and Airport expansion plans, as well as technological
improvements, especially in the transport sector with new EURO-class vehicles
and the expected penetration of alternative-fuel vehicles.
A future reduction of NOX emissions of 26.3% is expected with the “PECQ
Scenario” by 2020 (based on the “Trend Scenario” plus the “PECQ Action
Plan”). This is equivalent to reducing 2,743 tn/year compared with existing
technology. To predict future air quality, we have to assess the impact the PECQ
Action Plan will have on future cars, with cleaner vehicles expected thanks to the
technological improvements and EU regulations. So a reduction of 1,451 tn/y of
emissions is expected by 2020, equivalent to an overall reduction of emissions of
19.2% from 2008 emissions, or an annual average reduction rate of 1.8% from
2008 to 2020. We should point out that the Trend Scenario was calculated with
an annual reduction rate of 0.5%. Thus, the PECQ Action Plan will help speed
up the reduction rate through projects such as: “Urban mobility action plan”,
“High-emissions radar”, “Agreements with the business and transport sectors to
reduce diesel use in vehicle fleets”, “New more-efficient bus network”,
“Increasing low-emissions vehicles in the urban bus fleet”, “Introducing new
power sources for transport, including electric and gas vehicles”, etc.
The future PECQ scenario fulfils current EU legislation concerning NO2 air
pollution with the modelled annual average below 40 µg/m3 at all city
monitoring sites. Table 2 shows expected future concentration levels, while
Figure 7 shows the concentration maps for 2008 (left) and PECQ-2020 (right).
WIT Transactions on Ecology and the Environment, Vol 147, © 2011 WIT Press
www.witpress.com, ISSN 1743-3541 (on-line)Air Pollution XIX 35
Table 2: Expected NO2 concentration levels for future scenario in 2020.
2008 PECQ-2020
Monitoring site Type ACTUAL DATA MODEL DATA
[NO2 µg/m3] [NO2 µg/m3]
Ciutadella Urban background 42.3 30.3
Vall d’Hebrón Urban background 36.5 24.6
Eixample High traffic site 65.4 39.9
Gràcia High traffic site 62.6 36.5
Poblenou Moderate traffic site 47.4 29.8
Sants Moderate traffic site 45.3 32.7
Average value --- 49.9 32.3
© Barcelona Regional, 2010. © Barcelona Regional, 2010.
0 10 20 25 30 35 40 45 50 60 70 80 100
NO2 (µg/m3):
Figure 7: Annual average NO2 concentration map for 2008 (left) and 2020
(right).
5 Discussion and conclusion
The Barcelona air-dispersion model was drawn up as part of the Barcelona
PECQ 2011-2020 (acronym in Catalan of Barcelona’s Energy, Climate Change
and Air Quality Plan). As discussed in the paper, transport is the main culprit for
current high NO2 concentrations. This sector is responsible for 48.2% of NOX
emissions, and also produces 65.6% of NO2 concentration levels, on an annual
average. An important study has been conducted in Barcelona to determine what
kinds of vehicles use the city streets every day and their exhaust emissions.
The Barcelona air-quality model has been a very important tool for drawing
up the PECQ, for understanding local dispersion and detecting main pollutant
sectors during the diagnosis stage, and for helping to assess and predict the
impact of the measures on the city’s air quality during the policy-making
process.
With the adoption of the PECQ Action Plan for the year 2020, the Trend
Scenario is expected to show an improvement in air quality, with annual NO2
average concentrations below 40 µg/m3 at all city stations.
WIT Transactions on Ecology and the Environment, Vol 147, © 2011 WIT Press
www.witpress.com, ISSN 1743-3541 (on-line)36 Air Pollution XIX
Acknowledgements
We would like to thank all the institutions that have contributed to the project,
particularly to Barcelona Energy Agency and Mobility Depart. of Barcelona City
Council, and especially to Barcelona Regional colleagues.
References
[1] Barcelona Regional & Energy Agency of Barcelona, PECQ,
Pla de l’Energia, el Canvi Climàtic i la Qualitat de l’aire de
2011-2020, March 2011, Barcelona city council, Barcelona.
http://www.bcnregional.com/
[2] BOP, Butlletí Oficial de la Província de Barcelona, 14 of march 2006,
Num. 62, Pag. 16-22. Barcelona.
[3] Barcelona Regional & Barcelona City Council, PMEB. Pla de Millora
Energètica de Barcelona. Ed. Ajuntament de Barcelona & Agència
d’Energia de Barcelona, 2002, Barcelona.
[4] CERC, http://www.cerc.co.uk/environmental-software/ADMS-Urban-
model.html
[5] Barcelona Statistics Dept. http://www.bcn.cat/estadistica/catala/dades/
vehicles/index.htm
[6] EMEP/EEA air pollutant emission inventory guidebook – 2009,
http://www.eea.europa.eu/publications/emep-eea-emission-inventory-
guidebook-2009
[7] COPERT, http://www.emisia.com/copert/
[8] Barcelona Regional & TechNet S.L., Caracterització del parc mòbil de la
ciutat de Barcelona, October 2010, Ajuntament de Barcelona, Barcelona.
[9] Technet S.L. http://www.technetsl.es & ESP, http://www.esp-global.com
[10] Serveis de Mobilitat Aj, de Barcelona. Dades bàsiques 2008.
http://www.bcn.cat/mobilitatl
[11] EEA. European Environment Agency. Air quality statistics at reporting
stations. http://www.eea.europa.eu/themes/air/airbase.
WIT Transactions on Ecology and the Environment, Vol 147, © 2011 WIT Press
www.witpress.com, ISSN 1743-3541 (on-line)You can also read