MCNARY HIGH SCHOOL TRANSPORTATION IMPACT ANALYSIS - PREPARED FOR - CITY OF KEIZER
←
→
Page content transcription
If your browser does not render page correctly, please read the page content below
Prepared for

          McNary High School
          Transportation Impact Analysis

Prepared by

                                                                              March 2017 | page 1
                      City of Wilsonville | Parkway Woods Business Park Transportation Impact Study
February 2019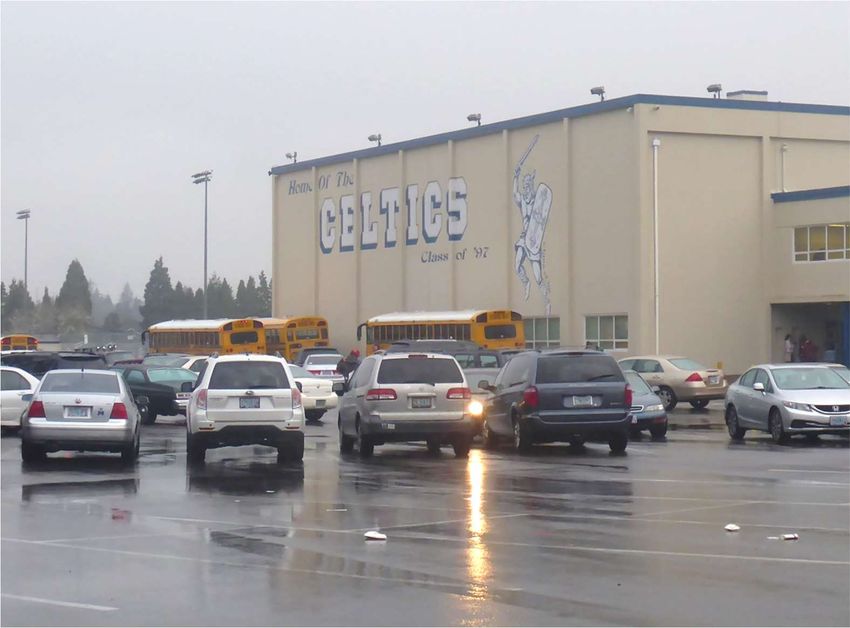
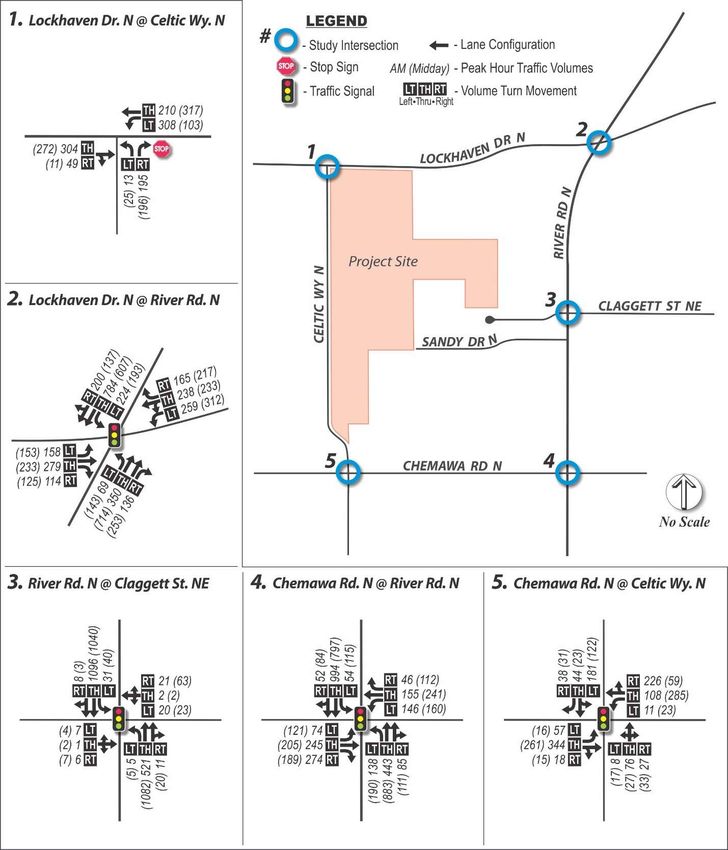
TABLE OF CONTENTS
CHAPTER 1: INTRODUCTION AND SUMMARY ..................................................................... 3
       Project Traffic Impact ......................................................................................................... 4
       Project Mitigation Summary ............................................................................................... 6

CHAPTER 2: EXISTING CONDITIONS ..................................................................................... 8
       Project Site ........................................................................................................................ 8
       Study Area Roadway Network ........................................................................................... 8
       Existing Traffic Volumes and Operations ........................................................................... 9
       Intersection Performance Measures ................................................................................ 11
       Collision History ............................................................................................................... 13
       Pedestrian and Bicycle Activity ........................................................................................ 14
       Public Transit Service ...................................................................................................... 14
       Parking and Site Circulation Observations ....................................................................... 15
       Parking Survey ................................................................................................................ 17
       Planned Improvement Projects ........................................................................................ 18

CHAPTER 3: IMPACTS ...........................................................................................................20
       Proposed Development ................................................................................................... 20
       Trip Generation ................................................................................................................ 20
       Trip Distribution................................................................................................................ 21
       Future Traffic Conditions.................................................................................................. 23
       Site Plan Review.............................................................................................................. 27
       Claggett Street Sensitivity Analysis .................................................................................. 32
       Queuing Analysis ............................................................................................................. 32

CHAPTER 4: PROJECT MITIGATION SUMMARY ..................................................................34

                                                                                1|P a g e
                                                                         February 2019
                                      McNary High School Transportation Impact Analysis
LIST OF FIGURES
Figure 1: Study Area .................................................................................................................. 3
Figure 2: Study Area .................................................................................................................. 8
Figure 3: 2018 Existing Traffic Volumes, Lane Geometries, and Traffic Control ....................... 10
Figure 4: Study Area Crash Diagram (2014 – 2016) ................................................................ 13
Figure 5: Project Trip Traffic Volumes and Trip Distribution...................................................... 22
Figure 6: 2020 Background Traffic Volumes ............................................................................ 24
Figure 7: 2020 Total Traffic Volumes ....................................................................................... 25
Figure 8: Safe Routes to School Map ....................................................................................... 29

LIST OF TABLES
Table 1: Study Area and Proposed Project Characteristics ........................................................ 4
Table 2: Existing Study Intersection Operations (A.M. and Midday Peak Hours) ........................ 5
Table 3: 2020 Background and Total Operations (A.M. and Midday Peak Hours) ...................... 6
Table 4: Study Area Roadway Characteristics ........................................................................... 9
Table 5: Existing Study Intersection Operations (A.M. and Midday Peak Hours) ...................... 12
Table 6: Study Intersection Collisions (2014 - 2016) ................................................................ 14
Table 7: Parking Space Utilization............................................................................................ 17
Table 8: City of Keizer Planned Transportation Improvement Projects ..................................... 19
Table 9: Local and National Trip Generation Rate Comparison................................................ 21
Table 10: McNary Existing and Proposed Trip Generation ....................................................... 21
Table 11: 2020 Background and Total Operations (A.M. and Midday Peak Hours) .................. 26
Table 12: City of Keizer Parking Requirements ........................................................................ 31
Table 13: Vehicle Parking Demand and Proposed Supply ....................................................... 31
Table 14: Bicycle Parking Demand .......................................................................................... 32
Table 15: Sensitivity Analysis Intersection Operations for Claggett Street ................................ 32
Table 16: AM Peak Hour 95th Percentile Queuing on Celtic Way ............................................. 33

                                                                                2|P a g e
                                                                         February 2019
                                      McNary High School Transportation Impact Analysis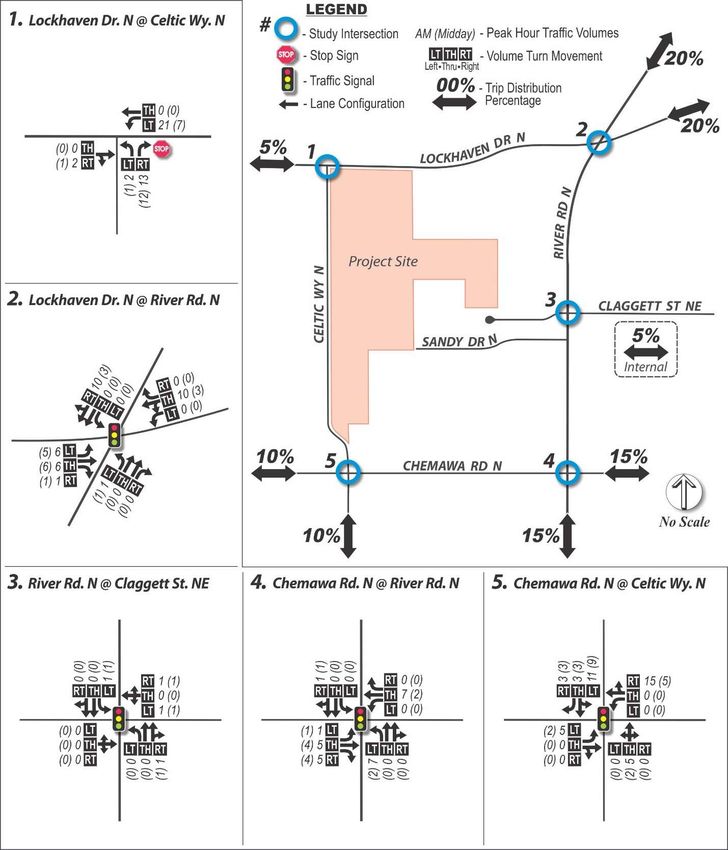
CHAPTER 1: INTRODUCTION AND SUMMARY
This study evaluates the transportation impacts for Salem-Keizer School District’s plan to
modernize, add classrooms, and improve the site circulation and parking at McNary High
School, located in Keizer. The building expansion is planned north and south of the existing
school building and two new parcels of land will be bought and leased by the School District to
provide additional sports fields and more parking for students. The purpose of this study is to
gain approval from the City of Keizer to construct the desired improvements. This report
documents the evaluation of existing transportation conditions, trip generation and distribution,
future conditions, and transportation impacts within the study area. The purpose of this report is
to determine mitigation measures to offset the traffic impacts from the proposed project.
The study area for the project is shown in Figure 1 and was determined based on discussions
with City staff. Within the study area, there are five study intersections where traffic operations
are analyzed:
Lockhaven Drive/Celtic Way
Lockhaven Drive/River Road
Chemawa Road/Celtic Way
Chemawa Road/River Road
River Road/Claggett Street
Project traffic impacts were
evaluated at the study
intersections for the weekday a.m.
and midday peak hours. The
impact analysis includes trip
generation, trip distribution, and
future traffic operating conditions
at the study intersections.
Following the analysis,
recommended mitigations are
described and analyzed.
This report also includes a project
site evaluation that addresses
access issues (e.g., location and
spacing), sight distance, internal
circulation, and parking. At the
end of the report, a summary of Figure 1: Study Area
the recommended transportation
mitigation measures that are expected to offset the negative transportation impacts of future
traffic growth is presented. Table 1 lists important characteristics of the study area and
proposed project.
3|P a g e
February 2019
McNary High School Transportation Impact Analysis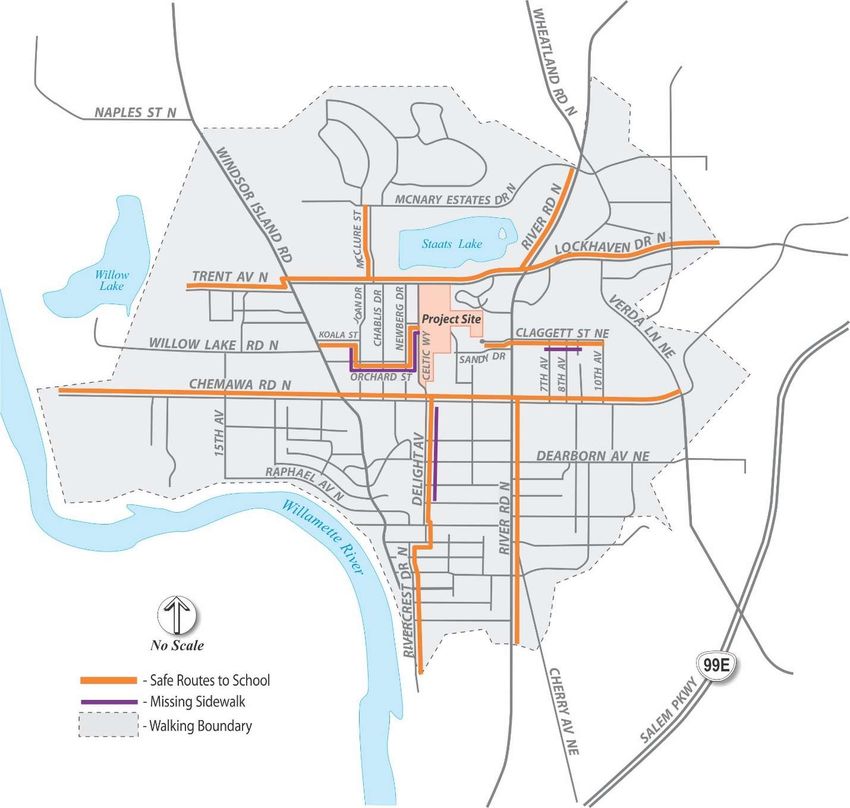
Table 1: Study Area and Proposed Project Characteristics
Characteristics Information
Study Area
Number of Study Intersections Five
Analysis Periods Weekday a.m. peak hour (one hour within 7-9 a.m.)
Weekday midday school peak hour (one hour within 2-4 p.m.)
Proposed Development
Existing Size and Land Use High School with 2,050 students
Future Size and Land Use High School with 2,200 students
Additional Project Trips 81 (49 in, 32 out) a.m. peak hour trips
(based on 150 student increase) 42 (15 in, 27 out) midday school peak hour trips
Vehicle Access Points Full access intersections at Lockhaven Drive /Celtic Way
(TWSC) and Chemawa Road /Celtic Way (Signalized)
Other Transportation Facilities
Pedestrian Facilities Sidewalks are available adjacent to developed properties and
along upgraded roadways.
Bicycle Facilities Marked bike lanes on Lockhaven Drive, River Road, and
Chemawa Road
Nearest Transit Stop Bus stops for Cherriots Route 14 are located on Lockhaven
Drive at the Lakefair Place intersection and on Chemawa
Road at the Celtic Way intersection. Route 14 travels at
approximately 30-minute headways throughout the day. Bus
stops for Cherriots Routes 9 and 19 are located on River
Road at the Claggett Street intersection. Route 9 travels at
approximately 30 -minute headways throughout the day and
Route 19 travels at 15-minutes headways.
Project Traffic Impact
To determine project impact at the study intersections, traffic operating conditions were
analyzed during the a.m. and midday peak hours for the following scenarios:
2018 Existing
2020 Background (includes background growth and traffic from approved developments in
the project vicinity that are not yet constructed)
2020 Total (includes background traffic plus project trips from the 150-student increase in
high school enrollment)
4|P a g e
February 2019
McNary High School Transportation Impact Analysis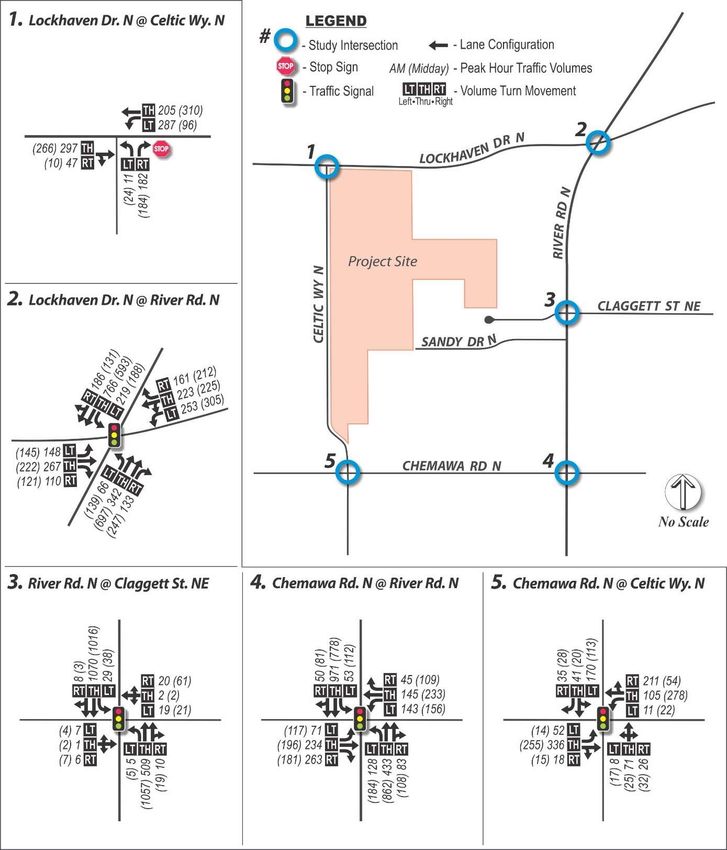
The 2020 scenario was selected for analysis since it is the anticipated year of opening for the
high school expansion. The analysis of this year was also coordinated with Salem-Keizer
School District staff. For future 2020 background volumes, a 1.2% annual growth was applied to
all study area roadways. For future 2020 total volumes, trip generation was performed for the
proposed school using local rates. Traffic signal timing information was provided by City of
Salem staff for the traffic signals at study intersections since the City of Salem maintains the
City of Keizer’s traffic signals. This signal timing information was used in the existing and future
traffic analysis.

2018 Existing Operating Conditions
The existing traffic operations at the study intersections were determined for the a.m. and
midday peak hours using 2000 Highway Capacity Manual methodology1 for signalized and the
2010 Highway Capacity Manual methodology2 for unsignalized intersections. The level of
service (LOS) and volume to capacity (v/c) ratio of each study intersection are listed in Table 2.
As shown, all the study intersections meet the City standards.
           Table 2: Existing Study Intersection Operations (A.M. and Midday Peak Hours)

                                                                     A.M. Peak                 Midday Peak
                                                 Operating
                Intersection
                                                 Standard
                                                                  LOS            v/c          LOS           v/c
     Two-Way Stop Controlled
     Lockhaven Drive/Celtic Way                   LOS E            A/C          0.42          A/C           0.43
     Signalized
     Lockhaven Drive/River Road                   v/c ≤ 1.0         D           0.86            D           0.85
     River Road/Claggett Street                   LOS D             A           0.43            A           0.46
     Chemawa Road/River Road                     v/c ≤ 0.95         D           0.77            D           0.74
     Chemawa Road/Celtic Way                      LOS D             D           0.81            D           0.52

     Signalized intersections:                                Two-Way Stop Controlled intersections:
        LOS = Level of Service of Intersection                  LOS = Level of Service of Major Street/Minor Street
        v/c = Volume-to-Capacity Ratio of Intersection          v/c = Volume-to-Capacity Ratio of Worst Movement

2020 Traffic Operating Conditions
The future intersection operations were analyzed for the peak hours using 2000 Highway
Capacity Manual methodology signalized intersections and 2010 Highway Capacity Manual
methodology for unsignalized intersections.

1
    2000 Highway Capacity Manual, Transportation Research board, 2000.
2
    2010 Highway Capacity Manual, Transportation Research board, 2010.
                                                                            5|P a g e
                                                                     February 2019
                                  McNary High School Transportation Impact Analysis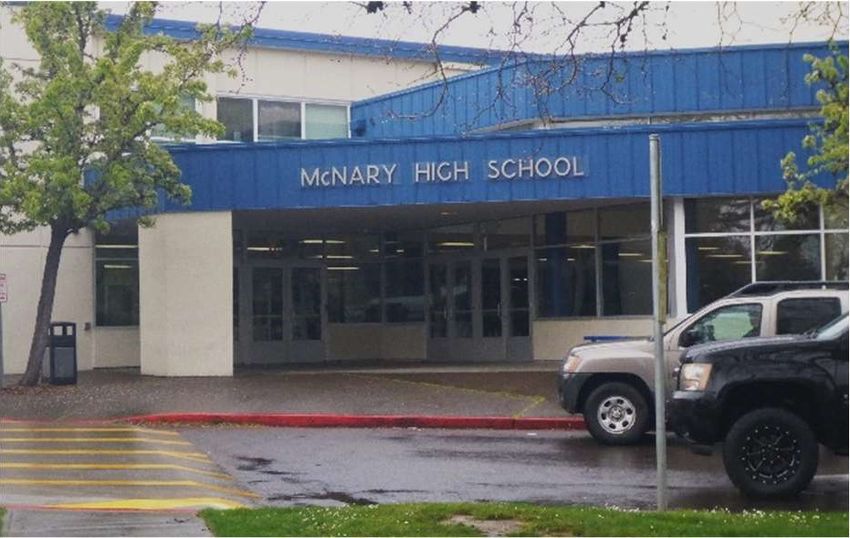
Intersection operating conditions for the 2020 Background and Total traffic scenarios are listed
in Table 3. As shown, all study intersections would meet applicable City operating standards for
all peak hours and scenarios.
Table 3: 2020 Background and Total Operations (A.M. and Midday Peak Hours)
2020 Background 2020 Total
A.M. Peak Midday Peak A.M. Peak Midday Peak
Operating
Intersection
Standard
LOS v/c LOS v/c LOS v/c LOS v/c
Two-Way Stop Controlled
Lockhaven Dr/
LOS E A/C 0.43 A/C 0.43 A/C 0.48 A/C 0.46
Celtic Way
Signalized
Lockhaven Dr/
v/c ≤ 1.0 D 0.87 D 0.86 D 0.89 D 0.87
River Rd
River Rd/
LOS D A 0.44 A 0.47 A 0.44 A 0.48
Claggett St
Chemawa Rd/
v/c ≤ 0.95 D 0.79 D 0.76 D 0.80 D 0.76
River Rd
Chemawa Rd/
LOS D D 0.82 D 0.55 D 0.85 D 0.58
Celtic Way
Signalized intersections: Two-Way Stop Controlled intersections:
LOS = Level of Service of Intersection LOS = Level of Service of Major Street/Minor Street
v/c = Volume-to-Capacity Ratio of Intersection v/c = Volume-to-Capacity Ratio of Worst Movement
Project Mitigation Summary
To preserve study area roadway performance and provide safe access to the updated McNary
High School, it is recommended that the following additional transportation mitigation measures
be performed. These project-related measures would typically be required as conditions of
approval if the project were approved and should be coordinated with City of Keizer staff:
Sight Distance
Prior to occupancy, sight distance at the existing access points will need to be verified,
documented, and stamped by a registered professional Civil or Traffic Engineer licensed in
the State of Oregon.
6|P a g e
February 2019
McNary High School Transportation Impact Analysis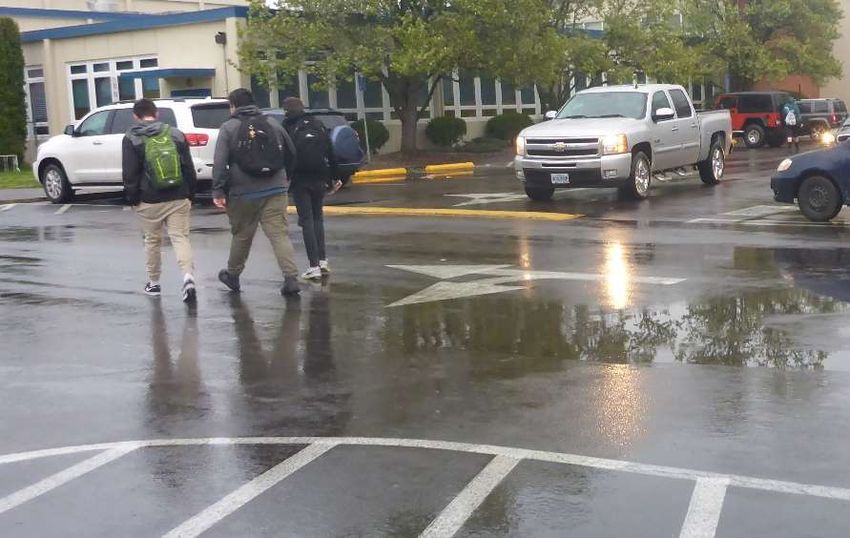
Pedestrian and Bicycle Access
It is recommended that some pedestrian crossing treatments (ramps, signage, etc.) be
installed where the path from the Claggett Street cul-de-sac meets the bus-only road near
the northeast corner of the main building to provide a safe crossing for pedestrians.
It is recommended to construct all sidewalks to meet ADA requirements.
Bus Loading and Access
Bus only signage will need to be provided on site for areas where bus-only circulation
occurs.
Parent Drop-off/Pick-up Areas
It is recommended that signage be installed that prohibits parent pick-up/drop-off in the
parking lot off Claggett Street and that the curb of the cul-de-sac be used for
loading/unloading. It is also recommended that sidewalk be installed on the east side of
that parking lot, connecting the cul-de-sac to the proposed sidewalk shown on the site
plan.
Parking
Based on 2,200 high school students, it is recommended that a minimum of 506 parking
stalls be provided to meet the estimated typical demand.
Based on 2,200 high school students, it is recommended that a minimum of 18 bicycle
parking spaces be provided per the City code and current estimated demand.
7|P a g e
February 2019
McNary High School Transportation Impact Analysis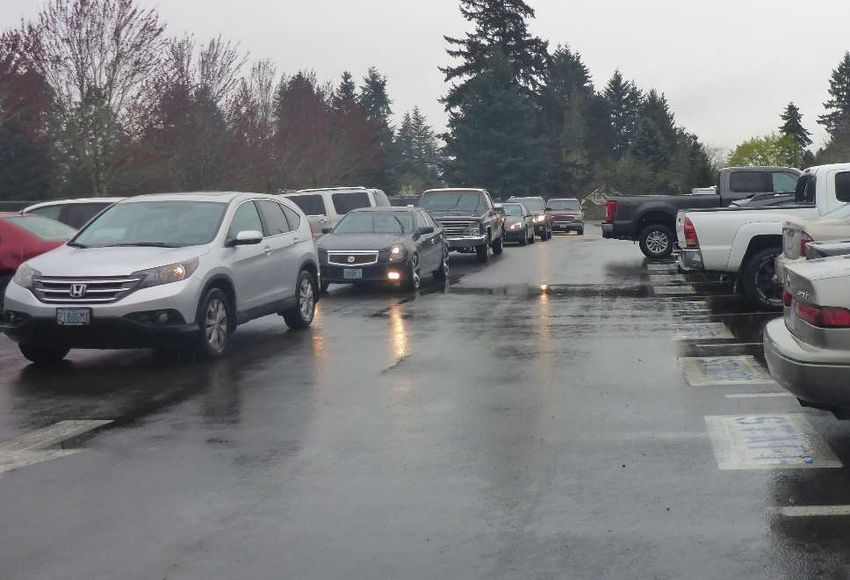
CHAPTER 2: EXISTING CONDITIONS
This chapter documents existing study area conditions, including the project site, roadway
network, existing traffic volumes, existing traffic operating conditions, collision history,
pedestrian and bicycle activity, transit service, and planned improvements. Supporting details
(i.e. traffic counts and level of service calculations) are provided in the appendix.

Project Site
McNary High School is currently located
between Chemawa Road and Lockhaven
Drive in Keizer, Oregon. This site is
accessed via Celtic Way, which connects
Chemawa Road (to the south) to
Lockhaven Drive (to the north) and runs in
front of the existing school building. The
Chemawa Road/Celtic Way intersection is
signalized, and the Lockhaven Drive/Celtic
Way intersection is a stop-controlled
intersection with Celtic Way being the
minor street stopped approach. The
Salem-Keizer School District’s desire is to
modernize the campus for new and
expanded educational facilities for up to
2,200 students and to improve the existing
site circulation and parking. The new
buildings and classrooms are proposed to
be added north and south of the existing
school building and two new parcels of
land will be either purchased or leased by                   Figure 2: Study Area
the Salem Keizer School District to provide
additional sports fields and more parking for students and events. Currently, there are 2,050
students enrolled at McNary High School. Classes start at 7:30 a.m. each morning except on
Thursdays, when classes begin at 8:05 a.m. School releases at 2:20 pm every day.

Study Area Roadway Network
Key study area roadways are listed in Table 4 along with their functional classification and other
important roadway characteristics. The functional classification for City of Keizer streets are
based on the City of Keizer Transportation System Plan3 (TSP). Three of the main functional
classes are local (more access but less mobility), collector (balanced access and mobility), and

3
    City of Keizer Transportation System Plan, Kittelson & Associates, Revised June 2014.
                                                                            8|P a g e
                                                                     February 2019
                                  McNary High School Transportation Impact Analysis
arterial (less access but more mobility). The primary roadways in the immediate vicinity of the
project site are Celtic Way, Lockhaven Drive, River Road, and Chemawa Road.
Table 4: Study Area Roadway Characteristics
Functional Cross Posted On-Street Bike
Roadway Sidewalks
Classification Section Speed Parking Lanes
Lockhaven Drive Minor Arterial 3 lanes 35 mph No Yes Yes
River Road Major Arterial 5 lanes 35 mph No Yes Yes
Chemawa Road Minor Arterial 2 lanes 30 mph No Yes Yes
Celtic Way Local Street 2 lanes 15 mph No Partial a No
Claggett Street Local Street 2 lanes 25 mph Yes Yes No
a
Sidewalks are only present on the east side of Celtic Way
Existing Traffic Volumes and Operations
Existing intersection operations analysis was performed for the study area intersections to
ensure that the transportation network reaches desired performance levels (agencies often
specify intersection performance thresholds as required operating standards). Intersections are
the focus of the analysis because they are the controlling bottlenecks of traffic flow and the
ability of a roadway system to carry traffic efficiently is nearly always diminished in their vicinity.
Due to the joint consideration of commuter and school peak traffic, intersection operations were
analyzed for the a.m. and midday peak hours. The midday peak period coincides with the High
School release time. In consultation with City of Keizer staff4, the following five existing study
intersections were selected:
Lockhaven Drive/Celtic Way
Lockhaven Drive/River Road
Chemawa Road/Celtic Way
Chemawa Road/River Road
River Road/Claggett Street
Traffic counts were collected5 for the a.m. and midday peak periods. The peak hour traffic
volumes are shown in Figure 3. The detailed two-hour traffic counts are included in the
appendix. Traffic signal timing information was provided by City of Salem staff6 for the traffic
signals at Lockhaven Drive/River Road, Chemawa Road/River Road, and River Road/Claggett
Street since the City of Salem maintains the City of Keizer traffic signals. This signal timing
information was used for the intersection operational analysis. Before the analysis results of the
study intersections are presented, discussion is provided for two important analysis issues:
4
Phone conversation with Shane Witham, City of Keizer, February 7, 2018.
5
Traffic counts were collected on March 8, 2018 by All Traffic Data during the morning and midday peak periods.
6
Traffic signal timing data was provided by Eric Destival, City of Salem on April 5, 2018.
9|P a g e
February 2019
McNary High School Transportation Impact Analysisintersection performance measures (definitions of typical measures) and required operating
standards (as specified by the agency with roadway jurisdiction).
Figure 3: 2018 Existing Traffic Volumes, Lane Geometries, and Traffic Control
10 | P a g e
February 2019
McNary High School Transportation Impact AnalysisIntersection Performance Measures
Level of service (LOS) ratings and volume-to-capacity (v/c) ratios are two commonly used
performance measures that provide a good picture of intersection operations. In addition, they
are often incorporated into agency mobility standards.
Level of service (LOS): A “report card” rating (A through F) based on the average delay
experienced by vehicles at the intersection. LOS A, B, and C indicate conditions where
traffic moves without significant delays over periods of peak hour travel demand. LOS D
and E are progressively worse operating conditions. LOS F represents conditions where
average vehicle delay has become excessive and demand has exceeded capacity. This
condition is typically evident in long queues and delays.
Volume-to-capacity (v/c) ratio: A decimal representation (typically between 0.00 and
1.00) of the proportion of capacity that is being used at a turn movement, approach leg, or
intersection. It is determined by dividing the peak hour traffic volume by the hourly capacity
of a given intersection or movement. A lower ratio indicates smooth operations and
minimal delays. As the ratio approaches 0.95, congestion increases, and performance is
reduced. If the ratio is greater than 1.00, the turn movement, approach leg, or intersection
is oversaturated and usually results in excessive queues and long delays.
Required Operating Standards
The City of Keizer has jurisdiction for all study area intersections; therefore, City operating
standards7 apply and are required to be met. City standards state that LOS D is the minimum
acceptable standard for signalized intersections and LOS E for all-way stop-controlled
intersections. For intersections of two arterial roadways (i.e. Chemawa Road/River Road), the
minimum acceptable standard is a v/c ratio of 0.95 or less. For intersections within the
Chemawa Interchange Overlay Zone (i.e. Lockhaven Road/River Road), the alternative
standard is a v/c ratio of 1.0 or less.
Existing Operating Conditions
The existing traffic operations at the study intersections were determined for the a.m. and
midday peak hours using 2000 Highway Capacity Manual methodology8 for signalized
intersections and 2010 Highway Capacity Manual methodology9 for unsignalized intersections.
The level of service (LOS) and volume to capacity (v/c) ratio of each study intersection are listed
in Table 5. As shown, all intersections currently meet City operating standards.
7
Chapter 4, City of Keizer Transportation System Plan, Kittelson & Associates, Revised June 2014.
8
2000 Highway Capacity Manual, Transportation Research Board, 2000.
9
2010 Highway Capacity Manual, Transportation Research Board, 2018.
11 | P a g e
February 2019
McNary High School Transportation Impact AnalysisTable 5: Existing Study Intersection Operations (A.M. and Midday Peak Hours)
A.M. Peak Midday Peak
Operating
Intersection
Standard
LOS v/c LOS v/c
Two-Way Stop Controlled
Lockhaven Drive/Celtic Way LOS E A/C 0.42 A/C 0.43
Signalized
Lockhaven Drive/River Road v/c ≤ 1.0 D 0.86 D 0.85
River Road/Claggett Street LOS D A 0.43 A 0.46
Chemawa Road/River Road v/c ≤ 0.95 D 0.77 D 0.74
Chemawa Road/Celtic Way LOS D D 0.81 D 0.52
Signalized intersections: Two-Way Stop Controlled intersections:
LOS = Level of Service of Intersection LOS = Level of Service of Major Street/Minor Street
v/c = Volume-to-Capacity Ratio of Intersection v/c = Volume-to-Capacity Ratio of Worst Movement
It should be noted that long delays and queuing at the Lockhaven Drive/Celtic Way intersection
were observed during the morning peak hour due to poor internal site circulation (see below).
However, the queues last only for a brief period of time and the operations meet the City’s
operating standard over the peak hour.
Eastbound queues at the Lockhaven Drive/Celtic Way intersection during the AM peak hour
12 | P a g e
February 2019
McNary High School Transportation Impact AnalysisCollision History
The collision histories of the study intersections were obtained for 2014 - 2016 from the Oregon
Department of Transportation (ODOT) Crash Analysis and Reporting Unit. Between 2014 and
2016, there were a total of 92 crashes at the five study intersections. One fatal injury crash
occurred at the Chemawa Road/River Road intersection, in which a pedestrian was struck while
walking on the roadway during nighttime (dark) conditions. There were also four Injury A
crashes, two of which involved pedestrians. The pedestrian collisions, which occurred at River
Road/Claggett Street and Chemawa Road/Celtic Way, were a result of the right-turning vehicles
failing to yield to the pedestrians crossing the roadway. The other two Injury A crashes occurred
at Lockhaven Drive/River Road and Chemawa Road/River Road, and were a head-on collision
and a rear-end collision, respectively.
Based on the collision data and
peak hour traffic counts, collision
rates were estimated at the study
intersections. ODOT publishes
critical crash rates which
represent the 90th percentile
crash rates for specific types of
intersections and roadway
classifications across the state. If
the collision rate exceeds the 90th
percentile crash rate, this may
indicate a safety concern and
further investigation is warranted.
Table 6 shows the breakdown of
collisions by severity, the 90th
percentile crash rate, and the
collision rate. The total number of
crashes experienced at an
intersection is typically
proportional to the number of
vehicles entering it; therefore, a
crash rate describing the
frequency of crashes per million
entering vehicles (MEV) is used
to evaluate safety performance.
As shown, the Lockhaven
Drive/River Road and Chemawa Figure 4: Study Area Crash Diagram (2014 – 2016)
Road/River Road collision rates
were both above the ODOT 90th percentile crash rate. Of the 36 collisions at the Lockhaven
Drive/River Road intersection, 28 collisions (78%) were rear-end. Of the 38 collisions at
Chemawa Road/River Road, 30 collisions (79%) were rear-end.
13 | P a g e
February 2019
McNary High School Transportation Impact AnalysisTable 6: Study Intersection Collisions (2014 - 2016)
Collisions (by Severity)
90th Percentile Collision
Intersection
Crash Rateb Ratec
Fatal Injury PDOa Total
Lockhaven Drive/Celtic Way 0 1 1 2 0.293 0.205
Lockhaven Drive/River Road 0 17 19 36 0.860 1.02
Chemawa Road/Celtic Way 0 5 1 6 0.860 0.628
Chemawa Road/River Road 1 16 21 38 0.860 1.11
River Road/Claggett Street 0 5 5 10 0.860 0.409
Bold and Highlighted cells indicate the collision rate is above the 90 th percentile crash rate
a
PDO = Property damage only.
b
90th Percentile Crash Rates from Analysis Procedure Manual, Exhibit 4-1
c
Collision rate = average annual collisions per million entering vehicles (MEV); MEV estimates based on p.m.
peak-hour traffic count.
Pedestrian and Bicycle Activity
Pedestrian activity was high both before and after school hours. In the morning, most
pedestrians were observed to enter campus using the MacArthur Street pedestrian access
located west of the school parking lot. This pedestrian connection connects the school with the
adjacent neighborhood. Approximately 133 pedestrians were observed using this pedestrian
connection in the morning. Many pedestrians also entered campus at the Chemawa Road/Celtic
Way intersection. According to the collected traffic count data, over 100 pedestrian crossings
were observed at this intersection.
During the after school peak hour, most pedestrians either left campus via the signalized
intersection at Chemawa Road/Celtic Way or the pedestrian access at MacArthur Street. About
150 pedestrian crossings were observed at the Chemawa Road/Celtic Way intersection. Many
pedestrians were also observed to be leaving campus via the MacArthur Street pedestrian
access. A small number of pedestrian crossings, 13, were observed also at the Lockhaven
Drive/Celtic Way intersection after school.
Bicycle activity was observed to be low. During the morning peak hour, no bicyclists were
observed crossing any of the Celtic Way intersections and only one was seen at the MacArthur
Street access. During the after school peak hour, 2 bicyclists were observed at both Celtic Way
intersections.
Public Transit Service
Salem-Keizer Transit (Cherriots) provides public transportation services within the Salem-Keizer
Urban Growth Boundary (UGB). There is currently one transit line (Route 14) that provides
14 | P a g e
February 2019
McNary High School Transportation Impact Analysisservice to Lockhaven Drive and Chemawa Road near the high school. Route 14 travels in a
loop and has half-hour headways throughout the day, including the a.m. and midday peak
hours. Cherriots Route 9 and Route 19 provide service to River Road at Claggett Street. Route
9 has half-hour headways throughout the day and Route 19 has 15-minute headways
throughout the day. The nearest transit stop is located approximately ¼ mile from the high
school.
Parking and Site Circulation Observations
Observations were also performed during the a.m. and midday peak hours on April 5 th and April
6th of 2018. Morning observations were made on Friday, April 6th, to capture a typical start time
of 7:30 a.m. The purpose of these site visits was to observe the vehicle circulation and parking
issues on site prior to the start of school and after school release. The following issues were
observed:
During the morning, students cut through the parking lot and walked through drive aisles to
get to school building entrances. There are no designated walkways though the school
parking lot to the school entrances (see photo below).
Students cut through parking lot during the morning.
Vehicles were observed to cut through the parking lot diagonally through unoccupied
parking stalls instead of using the designated aisles, causing unpredictable vehicle
behavior.
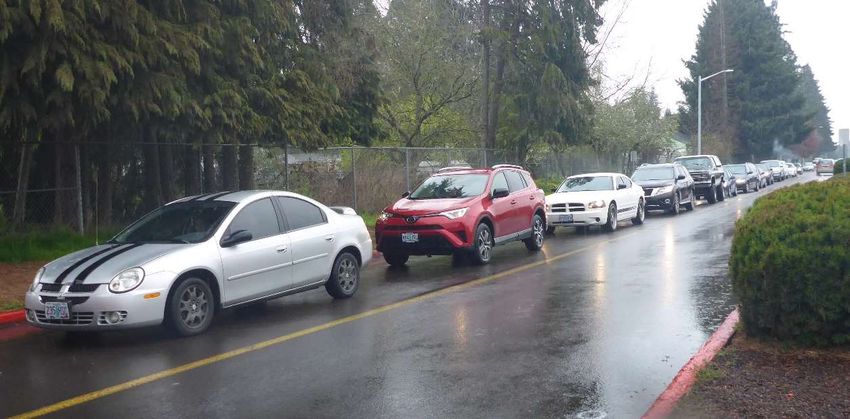
After school was released in the midday at 2:20 p.m., cars were already queuing from the
front of school entrance back onto Celtic Way (see photo below). Because of the long
queues and congestion on-site, cars were observed to pick-up or drop-off students on the
south leg of Delight Street so as to avoid waiting in line.
15 | P a g e
February 2019
McNary High School Transportation Impact AnalysisParent Pick-up vehicles start to queue before school is released in the midday.
By 2:30 pm, vehicles attempting to exit the site at the signalized Chemawa Road/Celtic
Way intersection queue back into the parking lot (see below). School buses are intermixed
with this traffic creating numerous conflict points with students walking from school
buildings to parked vehicles and the pathway connection to MacArthur Street. It took
approximately 3-5 minutes for a school bus to travel from the bus loading area in front of
the Gymnasium to the Chemawa Road/Celtic Way intersection.
Vehicles queue at Chemawa Road/Celtic Way signal after school hours.
16 | P a g e
February 2019
McNary High School Transportation Impact AnalysisParking Survey
Three parking space utilization surveys were conducted at 7:45 a.m., 10 a.m., and 2 p.m. on a
typical school day. The results of the surveys are shown in the table below. “Cars parked
illegally” refers to the vehicles that are parked in the no parking areas located at the ends of the
parking stall aisles (see photo below) or adjacent to school buildings that are signed for no
parking. Cars parked on “MacArthur Street” refers to the number of vehicles that were found to
park on MacArthur Street, which is adjacent to the west side of the parking lot and provides
pedestrian connection to the site. Parking that occurs here is likely due to students that do not
have parking passes to the on-site lot. If additional parking were available these students would
likely park on-site.
Table 7: Parking Space Utilization
Estimated Capacity, Typical School Day
7:45 am 10 am 2 pm
Spaces Spaces Spaces
Used/ Percent Used/ Percent Used/ Percent
Location Spaces Occupied Spaces Occupied Spaces Occupied
Available Available Available
On-Site
Student Parking 293 / 320 92% 313 / 320 98% 210 / 320 66%
Staff/Visitor Parking 105 / 165 64% 136 / 165 82% 113 / 165 68%
Handicap Spaces 3 / 10 30% 0 / 10 0% 5/10 50%
Cars Parked Illegally 5 - 7 - 0 -
Off-Site
MacArthur Street 10 - 14 - 14 -
Total 416/495 84% 470/495 95% 342/495 70%
As shown, shortly after the start of school (7:45 a.m.), there is approximately 92% of the student
parking spaces being occupied. By 10 a.m., there are even fewer parking spaces available for
students which cause some students to park illegally on-site or park in the adjacent
neighborhood (see photos below). Based on the parking survey, there appears to be sufficient
staff/visitor parking and handicap parking spaces throughout the day.
The estimated parking demand rate for McNary high school is calculated by summing the
number of parking spaces (including illegal and off-site parking) and dividing by the number of
enrolled students. In the morning, the peak parking demand rate is 0.23 spaces per student.
17 | P a g e
February 2019
McNary High School Transportation Impact AnalysisVehicles are parked illegally on-site.
Vehicles are parked on MacArthur Street during the day adjacent to the school.
Planned Improvement Projects
There is one transportation improvement project in the project study area that is identified in the
Chapter 9 of the City’s Transportation System Plan (TSP)10. This planned project is
summarized in Table 8 and is financially unconstrained (no funding has been identified). Since
there is no funding identified, this improvement was not assumed for future transportation
analysis scenarios.
10
Chapter 9, City of Keizer Transportation System Plan, Kittelson & Associates, June 2009.
18 | P a g e
February 2019
McNary High School Transportation Impact AnalysisTable 8: City of Keizer Planned Transportation Improvement Projects
Intersection TSP Project Number and Description
Lockhaven Road/River Road TSP Medium Priority Project R4
The improvements identified will convert the westbound approach to
dual left-turn lanes, single through lane, and separate
right-turn lane and change the split phasing to protected left-turn
phasing on Lockhaven Drive.
19 | P a g e
February 2019
McNary High School Transportation Impact AnalysisCHAPTER 3: IMPACTS
This chapter reviews the impacts that the proposed modernization and classroom additions to
the McNary High School campus would have on the study area transportation system. Analysis
was performed for the a.m. and midday (school release period) peak hours to capture impacts
during the peak school periods.
The impact analysis discusses the proposed additions to the high school, project trip generation,
trip distribution, safe routes to school, future operating conditions of study intersections
(including project impacts and mitigations), and a site plan and circulation review.
Proposed Development
The recently approved Salem-Keizer School District School Bond includes the modernization
and expansion of McNary High School to serve up to 2,200 students. McNary High School is
located at 595 Chemawa Road in Keizer, Oregon, and is currently zoned public. The high
school is surrounded by single family and medium density residential zoning.
The Salem-Keizer School District desires to modernize existing buildings and add more school
classroom space to accommodate up to 2,200 students and improve the site circulation and
parking. The proposed additions are assumed to be constructed and occupied by the fall of
2020. There are currently 2,050 students enrolled at McNary High School, so an additional
capacity of 150 students is proposed. Classes start at 7:30 a.m. each morning except on
Thursdays, when classes begin at 8:05 a.m. School releases at 2:20 pm every day.
Trip Generation
Trip generation is the method used to estimate the number of vehicles that are added to the site
driveways and roadway network by the proposed project during a specified period (i.e., such as
a peak hour or an entire day). Trip generation is performed by multiplying trip rates by land use
size (in this case the number of students). National trip generation rates are provided in the
Institute of Transportation Engineers (ITE) Trip Generation, 10th Edition.
Because local peak hour trip generation data is available for the existing McNary High School
based on the recent traffic counts taken at the project driveways, a comparison was made
between local trip rates and ITE trip rates for the a.m. and midday peak hours. Table 9 shows
the comparison.
20 | P a g e
February 2019
McNary High School Transportation Impact AnalysisTable 9: Local and National Trip Generation Rate Comparison
Peak Hour Trip Rate per Student
Source Students
A.M. Midday
Local Data
McNary High School 2,050 0.54a 0.28a
ITE National High School Data (ITE Code)
High School (530) - 0.52 0.33
a
Trip rates based on traffic counts that were collected on March 8, 2018.
b
N/A = Not Available
As shown, the local rate is more conservative in the AM peak hour but less in the midday peak
hour. The local rates were used for this study since they represent local conditions and travel
characteristics. Table 10 shows the estimated trip generation for the existing number of students
(2,050), additional 150 students, and total future number of students (2,200) at McNary High
School using local trip rates. The additional 150 students created a total of 81 (49 in, 32 out)
A.M. peak hour trips and 42 (15 in, 27 out) Midday peak hour trips. Only the proposed trip
generation was added to the existing counts for the 2020 Total scenario. The existing counts
already included the existing trip generation.
Table 10: McNary Existing and Proposed Trip Generation
Peak Hour Number of Students Trip Rate Trips Generated
Existing Trip Generation
A.M. 0.54 (60% in, 40% out) 1,107 (668 in, 439 out)
2,050
Midday 0.28 (35% in, 65% out) 568 (199 in, 369 out)
Proposed Trip Generation
A.M. 0.54 (60% in, 40% out) 81 (49 in, 32 out)
150
Midday 0.28 (35% in, 65% out) 42 (15 in, 27 out)
Total Trip Generation
A.M. 0.54 (60% in, 40% out) 1,188 (713 in, 475 out)
2,200
Midday 0.28 (35% in, 65% out) 616 (216 in, 400 out)
Trip Distribution
Trip distribution for the proposed high school was based on existing school trip distribution from
traffic counts and a select zone analysis on the Salem-Keizer Area Transportation System
(SKATS) model. The trip distribution for the school is shown in Figure 5. Applying the trip
distribution to the trips generated by the additional 150 students at the high school yields the
project trips also shown in Figure 5.
21 | P a g e
February 2019
McNary High School Transportation Impact AnalysisFigure 5: Project Trip Traffic Volumes and Trip Distribution
22 | P a g e
February 2019
McNary High School Transportation Impact AnalysisFuture Traffic Conditions
Future traffic operating conditions were analyzed at the study intersections to determine if the
transportation network can support the additional proposed school trips. When City of Keizer
operating standards are not met, mitigations are required to improve network performance.
Future Analysis Scenarios
Future a.m. and midday peak hour traffic operations were analyzed at the study intersections for
the following two scenarios:
2020 Background (includes background growth and traffic from approved developments in
the project vicinity that are not yet constructed)
2020 Total (includes background traffic plus project trips from the 150-student increase in
high school student enrollment)
The 2020 horizon year was selected for analysis since it is the anticipated year of occupancy for
the proposed modernization and classroom expansion.
2020 Traffic Volumes
The 2020 Background and 2020 Total traffic volumes were estimated for the study intersections.
2020 Background traffic volumes were developed by adding two years of background
growth to the existing 2018 traffic counts. The future background growth on study area
roadways was based on growth data from the SKATS model, resulting in an average
yearly growth of 1.2%. DKS coordinated with the City and determined that there are
approved developments in the project vicinity that are not yet constructed. However, the
background growth calculated accounts for these developments.
2020 Total traffic volumes were developed by combining the 2020 Background traffic
volumes with the proposed school peak hour project trips (Table 10).
The a.m. and midday peak hour traffic volumes are shown in Figure 6 for the 2020 Background
scenario and Figure 7 for the 2020 Total scenario.
23 | P a g e
February 2019
McNary High School Transportation Impact AnalysisFigure 6: 2020 Background Traffic Volumes
24 | P a g e
February 2019
McNary High School Transportation Impact AnalysisFigure 7: 2020 Total Traffic Volumes
25 | P a g e
February 2019
McNary High School Transportation Impact Analysis2020 Traffic Operating Conditions
The future intersection operations were analyzed for the peak hours using 2000 Highway
Capacity Manual methodology for signalized intersections and the 2010 Highway Capacity
Manual methodology for unsignalized intersections.
Intersection operating conditions for the 2020 Background and Total traffic scenarios are listed
in Table 11. As shown, all study intersections would meet applicable City operating standards
for all peak hours and scenarios.
Table 11: 2020 Background and Total Operations (A.M. and Midday Peak Hours)
2020 Background 2020 Total
Operating A.M. Peak Midday Peak A.M. Peak Midday Peak
Intersection
Standard LOS v/c LOS v/c LOS v/c LOS v/c
Two-Way Stop Controlled
Lockhaven Dr/
LOS E A/C 0.43 A/C 0.43 A/C 0.48 A/C 0.46
Celtic Way
Signalized
Lockhaven Dr/
v/c ≤ 1.0 D 0.87 D 0.86 D 0.89 D 0.87
River Rd
River Rd/
LOS D A 0.44 A 0.47 A 0.44 A 0.48
Claggett St
Chemawa Rd/
v/c ≤ 0.95 D 0.79 D 0.76 D 0.80 D 0.76
River Rd
Chemawa Rd/
LOS D D 0.82 D 0.55 D 0.85 D 0.58
Celtic Way
Signalized intersections: Two-Way Stop Controlled intersections:
LOS = Level of Service of Intersection LOS = Level of Service of Major Street/Minor Street
v/c = Volume-to-Capacity Ratio of Intersection v/c = Volume-to-Capacity Ratio of Worst Movement
26 | P a g e
February 2019
McNary High School Transportation Impact AnalysisSite Plan Review
The site plan provided by the project sponsor was reviewed to evaluate site access, circulation,
and internal facilities. There were numerous iterations of the original site plan, however, the site
plan evaluated in this report is the current preferred alternative. This site plan provides many
modifications from the original site plan to improve traffic and pedestrian flow, parking and
safety. These improvements include separating bus traffic from parent/student traffic, providing
additional parking, reducing congestion at site driveways by providing more efficient internal
circulation for students, removing or improving pedestrian-vehicle conflict areas on-site, and
providing clear pedestrian pathways to/from the school entrances. The following section
includes the identification of other on-site project modifications or improvements.
Access Spacing
There are two existing site accesses, one on Chemawa Road and one on Lockhaven Drive. A
new parking lot and potential drop off area has been proposed off Claggett Street adjacent to
The Arbor at Avamere Court. This connection will provide access to a 33-stall parking lot and
athletic fields along with a pedestrian pathway to the school. The three points of access to the
school are expected to provide enhanced site access to the school. The existing driveways
experience delay in the peak 15-minute period due to congestion from the internal High School
circulation. As previously discussed, the addition of a new parking lot, relocation of bus loading,
and improved parent, student and staff parking circulation should improve delay and congestion
at the school access points.
Both the roadways of Lockhaven Drive and Chemawa Road are classified as minor arterials in
the City TSP. For arterial streets, the City of Keizer has access spacing standards providing
guidance as to how close driveways can be located to intersecting streets. The standard11 is
based on the posted speed limit and indicates that the distance must be less than 150 feet
between the existing school driveways and other driveways or public street intersections. For
the Lockhaven Drive/Celtic Way intersection, the nearest intersecting street, Newberg Drive, is
located approximately 250 feet to the west. For the Chemawa Road/Celtic Way driveway, the
nearest intersecting street, Robindale Drive, is located approximately 400 feet to the east. Both
driveways meet the City’s access spacing standard.
Sight Distance
During a field observation visit12, the preliminary sight distance at the existing site driveways
appear to have sufficient sight distance. With the planned expansion, sight distance will need to
be considered with fence or landscaping changes that may affect sight distance. Prior to
occupancy, sight distance at the existing access points will need to be verified, documented,
and stamped by a registered professional Civil or Traffic Engineer licensed in the State of
Oregon to assure no landscaping or other objects are constructed within the sight distance
triangle.
11
Table 4.3, City of Keizer Transportation System Plan, Kittelson & Associates, April 2009.
12
Field observation visit was conducted on April 5th, 2018.
27 | P a g e
February 2019
McNary High School Transportation Impact AnalysisPedestrian and Bicycle Access and Circulation
The site plan provided by the project sponsor shows pathways and sidewalks connecting the
school entrance to the various pedestrian and bicycle site entry points. The proposed pathway
connecting Chemawa Road to the front of the school building starts at Chemawa Road/Celtic
Way intersection and continues north to the school bus loop. A raised pedestrian crosswalk is
shown on the site plan at the existing crossing of the parking lot to the front of the school
building. At the other end of the parking lot, the site plan shows a raised crosswalk connecting
the pedestrian access at MacArthur Street to the existing sidewalk, which continues to the front
of the school building. Raised crosswalks slow vehicle speeds and improve pedestrian visibility
and safety. There is a total of 4 raised crosswalks proposed.
In addition, other sidewalks and crosswalks are shown to provide safe pathways to the school’s
main entrance from Lockhaven Drive and from the proposed new parking lot off Claggett Street.
It is recommended to construct all sidewalks to meet ADA requirements.
It is recommended that pedestrian crossing treatments (ramps, signage, etc.) be installed where
the path from the Claggett Street cul-de-sac meets the bus-only road near the northeast corner
of the main building (assuming this would not impact the SPED bus drop off area).
Safe Routes to School
DKS evaluated the pedestrian and bike connectivity to/from the high school within the walking
boundary, a 1.5 mile-radius of the high school. The City of Keizer recently constructed urban
street improvements to Chemawa Road that included new sidewalks and bike lanes on both
sides and a new traffic signal at Chemawa Road/Celtic Way intersection. The new signal
provides signalized school crossings for students living on the south side of Chemawa Road.
The walking boundary and safe routes to and from adjacent neighborhoods were identified and
are shown in Figure 8. The walking zone for the high school is up to a 1.5-mile radius, unless
there is a “hazard”, such as a major highway or body of water. Any students outside of the
walking boundary or within the hazard areas will be provided school bus service by the School
District per their policy.
28 | P a g e
February 2019
McNary High School Transportation Impact AnalysisFigure 8: Safe Routes to School Map
For pedestrians and bicyclists to the west of the high school, the Chemawa Road and
Lockhaven Drive roadways provide safe routes to the school via sidewalks and bike lanes. For
those to the south of the high school, Rivercrest Drive/Delight Street and River Road are the
encouraged routes to school. Missing sidewalk has been identified in the neighborhoods west
and south of the site along the safe routes to school described above. Because of the low
volume of traffic, sidewalk infill is not critical at this time, but should be considered a priority by
the City for future sidewalk infill projects.
There is fewer housing to the east of McNary High School as there are many commercial
developments on either side of River Road. For pedestrian and bicyclists who wish to walk or
bike to school, Chemawa Road, Claggett Street, and Lockhaven Drive provide adequate
29 | P a g e
February 2019
McNary High School Transportation Impact Analysisfacilities. Some missing sidewalk is identified on Claggett Street for 950 feet. This segment of
sidewalk on Claggett Street should be considered for future sidewalk infill projects. To the north,
pedestrian and bicyclists are encouraged to take River Road, Lockhaven Drive, or McClure
Street to get to the high school where bicycle lanes currently exist. The school district and City
should partner together to request safe routes to school grants for sidewalk infill that is available
through ODOT13.
Bus Loading and Access
The proposed site plan shows two new bus-only loading/unloading areas, one located to the
south of the school (regular school buses only) and the other located on the north side (SPED
school buses only). There is approximately 1,215 feet of proposed bus loading curb space. Bus
circulation on-site is mostly separated from the other vehicles by providing two-way, bus-only
travel around the east side of the school away from the parking lots. The internal roadways
provide adequate capacity for school buses to exit, enter, and load/unload on site. Signage
indicating these areas as bus-only will need to be provided on site. A raised pedestrian crossing
has been provided between the bus loading area and the front door of the school to facilitate a
safe connection to the school.
Parent Drop-Off/Pick-Up Area
The site plan shows three proposed parent drop-off/pick-up areas. Two are located along the
west side of the school building at the school entrance and one is located along the proposed,
raised island in the parking lot. There is a total of 565 feet of proposed curb space available for
parent loading along with 1,215 feet for bus loading (250% increase in loading area) that will
improve delays and congestion related to parent loading. Today, there is approximately 500 feet
of combined curb space for both parent pick-up/drop-off and school bus loading/unloading. It is
anticipated that some parents may pick-up/drop-off students at the parking lot off Claggett
Street which will also improve internal circulation and congestion. It is recommended that
signage be installed that prohibits parent pick-up/drop-off in the Claggett Street parking lot and
that the curb of the cul-de-sac be used for loading/unloading. It is also recommended that
sidewalk be installed on the east side of the parking lot, connecting the cul-de-sac to the
proposed sidewalk shown on the site plan.
Vehicle Parking
For high schools, City of Keizer Code requires a minimum of one vehicular parking stalls per
classroom as well as 1 space for every 10 students and 1 space per 350 square feet of
administrative office. The updated school has 111 classrooms planned, 2,200 students, and
7,874 feet of administrative office; therefore, it would need 354 parking stalls to meet City of
Keizer code. The site plan currently shows that 587 parking stalls will be provided on the site, 92
additional parking stalls than the 495 parking stalls that currently exist. The proposed site plan
shows sufficient parking to meet the City’s parking requirements. Table 12 summarizes the
parking requirements.
13
https://www.oregon.gov/ODOT/Programs/Pages/SRTS.aspx
30 | P a g e
February 2019
McNary High School Transportation Impact AnalysisTable 12: City of Keizer Parking Requirements
City Standards
Proposed Stalls Stalls Stalls Total
Land Use Students
Parking (based on (based on (based on
classroom students) administrative
size) office SF)
High School 2,200 587 stalls 111 220 23 354
According to the existing parking demand survey that was conducted on a typical school day
and was described earlier in the existing conditions section, the peak parking demand rate was
calculated to be 0.23 spaces per student based on parking observations (this demand
calculation included illegally parked vehicles and students parked along MacArthur Street).
Given the 2,200-student capacity, the estimated parking demand for the high school would be
506 parking stalls. The breakdown of the demand for students and staff/visitor stalls is shown in
Table 13 below. The proposed site plan provides sufficient parking to meet the existing demand
of the high school. It is recommended that a sufficient number of parking stalls be allocated for
student parking to meet the demand (0.16 vehicles per student) to avoid students parking
illegally or off-site.
Table 13: Vehicle Parking Demand and Proposed Supply
Number of Number of Number of
Future
Students Stalls Demand Rate Students
Demand
(2018) Occupied (2020)
Total 470 0.23 506
2,050 Student 334 0.16 2,200 352
Staff/Visitor 136 0.07 154
Proposed Vehicle Parking 587
Bicycle Parking
City of Keizer Code also requires that bicycle parking be calculated at 5% of required
automobile parking spaces, which would equate to 18 bicycle parking spaces.
A survey of existing bicycle parking was taken of the site, and approximately 16 bicycles were
parked in 56 of the available parking stalls. Using the existing number of students and number
of bicycle stalls occupied, a demand rate was calculated. This rate was used to approximate
future demand assuming 2,200 students.
Table 14 on the next page shows the future bicycle parking demand to be 18 bicycle parking
stalls, same as the City code requirements. The site plan shows a total of 36 bicycle parking
stalls, meeting both the current demand of the high school and the City Code requirements.
31 | P a g e
February 2019
McNary High School Transportation Impact AnalysisTable 14: Bicycle Parking Demand
Number of Existing Number of Demand Rate Number of Future
Students Parking Stalls (stalls per Students Parking
(2018) Demand Available student) (2020) Demand
2,050 16 Stalls 56 0.0078 2,200 18 Stalls
City Code Requirement 18 Stalls
Proposed Bicycle Parking 36 Stalls
Claggett Street Sensitivity Analysis
The main parking lot provides enough parking to meet student and staff/visitor parking demand
as discussed previously. Therefore, no trips were assumed to use the Claggett Street access.
However, the following provides a sensitivity analysis that assumes that 5% of the total
expected student enrollment (2,200 students) will use the Claggett Street site access to park or
for parent loading. The number of trips added to the River Road/Claggett Street intersection
during the AM peak hour would be 60 trips (36 in, 24 out) and 31 trips (11 in, 20 out) during the
Midday peak hour.
Operations for the intersection of River Road/Claggett Street are shown below for both the 2020
Total and the 2020 Sensitivity Analysis with the added trips. As shown, minimal impacts to the
intersection are expected during both peak hours with the added school related trips on Claggett
Street.
Table 15: Sensitivity Analysis Intersection Operations for Claggett Street
2020 Total 2020 Sensitivity Analysis
Operating A.M. Peak Midday Peak A.M. Peak Midday Peak
Intersection
Standard LOS v/c LOS v/c LOS v/c LOS v/c
River Rd/Claggett St LOS D A 0.44 A 0.47 A 0.46 A 0.48
Signalized intersections:
LOS = Level of Service of Intersection
v/c = Volume-to-Capacity Ratio of Intersection
Queuing Analysis
Queuing analysis was performed for the AM and midday peak hours through traffic simulations
performed in SimTrafficTM and using the 2020 Total Traffic volumes. The queuing analysis was
performed to determine the 95th percentile southbound queues on Celtic Way at the Chemawa
Road signal. The 95th percentile queue is the queue length for a given intersection movement
that has only a 5% chance of being exceeded during the peak traffic hour.
32 | P a g e
February 2019
McNary High School Transportation Impact AnalysisYou can also read