WORTHING LOCAL PLAN Worthing Borough Council Transport Assessment - Addendum
←
→
Page content transcription
If your browser does not render page correctly, please read the page content below
Worthing Borough Council

WORTHING LOCAL PLAN
Transport Assessment - Addendum

70033198-TAA
JANUARY 2021                      PUBLIC
Worthing Borough Council

WORTHING LOCAL PLAN
Transport Assessment - Addendum

TYPE OF DOCUMENT (VERSION) PUBLIC

PROJECT NO. 70033198
OUR REF. NO. 70033198-TAA

DATE: JANUARY 2021

WSP
2 London Square
Cross Lanes
Guildford, Surrey
GU1 1UN
Phone: +44 148 352 8400

WSP.com

                                    PUBLIC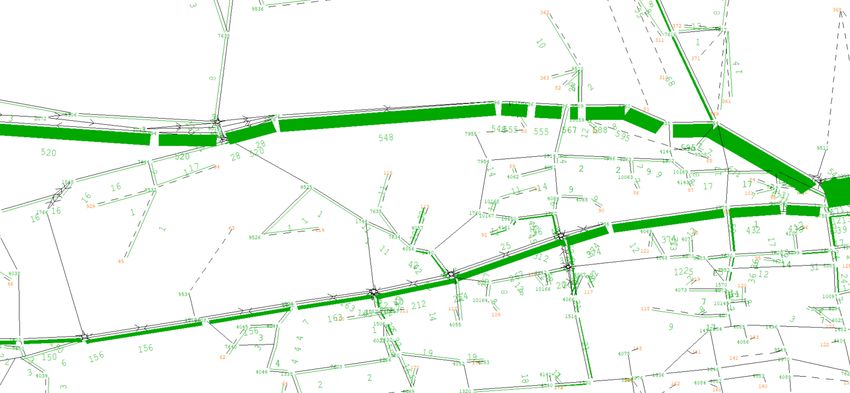
QUALITY CONTROL

 Issue/revision        First issue         Revision 1       Revision 2         Revision 3

 Remarks               Draft               Final

 Date                  15/01/2021          25/01/2021

 Prepared by           RS                  RS

 Signature

 Checked by            CD                  CD

 Signature

 Authorised by         CD                  CD

 Signature

 Project number        70033198

 Report number         70033198-TAA-2.0

 File reference        \\uk.wspgroup.com\central data\Projects\700331xx\70033198 - Worthing
                       Local Plan\03 Reports\03 Transport Assessment

WORTHING LOCAL PLAN                                                               PUBLIC | WSP
Project No.: 70033198 | Our Ref No.: 70033198-TAA                                  January 2021
Worthing Borough Council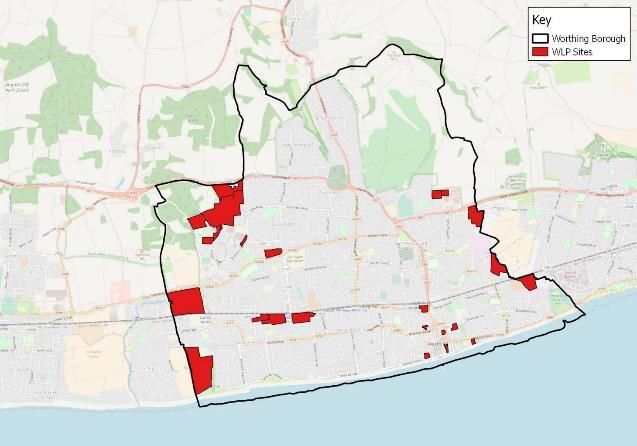
CONTENTS

1     TRANSPORT ASSESSMENT - ADDENDUM                                                          1

1.1   PURPOSE OF ADDENDUM                                                                      1
1.2   BACKGROUND                                                                               1
1.3   SUITABILITY OF THE TRAFFIC MODEL                                                         1
1.4   IMPACT UPON THE STRATEGIC ROAD NETWORK                                                  15
1.5   MITIGATION STRATEGY FOR THE STRATEGIC ROAD NETWORK                                      20
1.6   SUMMARY AND CONCLUSION                                                                  23

      TABLES
      Table 1-1 - Peak Period and Peak Hour flows – A27 Upper Brighton Road                    4
      Table 1-2 - Comparison of modelled with observed flows – A27 Upper Brighton Road         4
      Table 1-3 - Peak Period and Peak Hour flows – A2032 Littlehampton Rd                     5
      Table 1-4 - Comparison of modelled with observed flows – A2032 Littlehampton Rd          5
      Table 1-5 - Comparison of modelled with observed flows – Titnore Lane                    6
      Table 1-6 - Flow comparison – A280 Water Lane, A259 Littlehampton Rd                     6
      Table 1-7 - Comparison of modelled with observed flows – A27 Offington Lane Rdbt         7
      Table 1-8 - Comparison of modelled with observed flows – A27 Grove Lodge Rdbt            8
      Table 1-9 - Comparison of modelled with observed flows – A27 / Lyons Way                 9
      Table 1-10 - Modelled journey times (s) – A27 and A2032                                 10
      Table 1-11 - Peak Period and Peak Hour journey times – A27 through Worthing Borough 13
      Table 1-12 - Peak Period and Peak Hour journey times – A27 / A280 to Lyons Way          14
      Table 1-13 - Traffic flow forecast – Grove Lodge Rdbt performance – 2033 AM Peak        17
      Table 1-14 - Traffic flow forecast – Grove Lodge Rdbt performance – 2033 PM Peak        18
      Table 1-15 - Traffic flow forecast - A27 Offington Lane Junction - 2033 AM Peak         19
      Table 1-16 - Traffic flow forecast - A27 Offington Lane Junction - 2033 PM Peak         19

      WORTHING LOCAL PLAN                                                           PUBLIC | WSP
      Project No.: 70033198 | Our Ref No.: 70033198-TAA                              January 2021
      Worthing Borough Council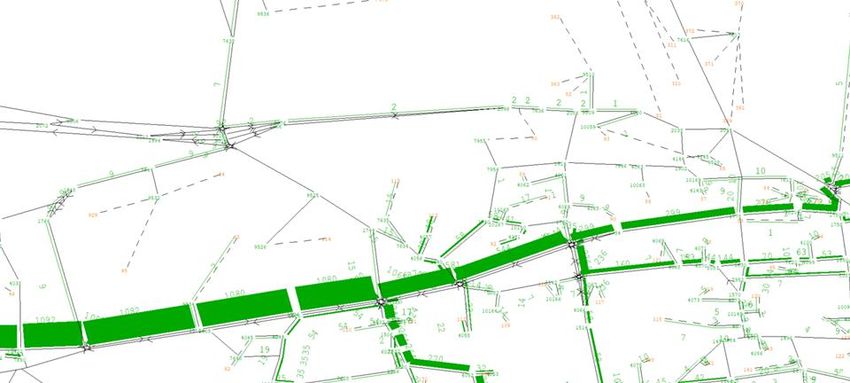
Table 1-17 - A27 Offington Lane Junction – Collision data                                20
Table 1-18 - Flow forecast (mitigation) - A27 Offington Lane – 2033 AM Peak              22
Table 1-19 - Observed flow forecast - A27 Offington Lane mitigation – 2033 PM Peak       22

FIGURES
Figure 1-1 – Location of sites for additional traffic flow comparison                     3
Figure 1-2 - Select Link Analysis - Routing via Titnore Lane (AM Northbound)             11
Figure 1-3 - Select Link Analysis - Routing via Titnore Lane (AM Southbound)             11
Figure 1-4 - Select Link Analysis - West of A280 / A259 junction (AM eastbound)          12
Figure 1-5 - Select Link Analysis - A27 east of Grove Lodge roundabout (AM westbound) 12

WORTHING LOCAL PLAN                                                            PUBLIC | WSP
Project No.: 70033198 | Our Ref No.: 70033198-TAA                               January 2021
Worthing Borough Council
TRANSPORT ASSESSMENT -
ADDENDUM

                         PUBLIC
1 TRANSPORT ASSESSMENT - ADDENDUM
1.1 PURPOSE OF ADDENDUM
This document is an addendum to the Worthing Local Plan Transport Assessment (August 2018),
produced for Worthing Borough Council (WBC). The Transport Assessment forms part of the
evidence base for the emerging Local Plan.
The purpose of this addendum is to present supplementary information in response to Highways
England representation DWLP-M-111, received in December 2018. This addendum also includes
information which responds to continuing engagement with Highways England during 2019 and
2020. Transport assessment information in relation to the following topic areas is provided:
Suitability of the traffic model (section 1.3).
Impact upon the strategic road network (section 1.4).
Mitigation strategy for the strategic road network (section 1.5).
1.2 BACKGROUND
WBC is developing a new Local Plan for the Borough. The existing Development Plan for Worthing
is the Worthing Core Strategy which was adopted in 2011 and covered the period to 2026. Since its
adoption, changes to the planning system have resulted in the need to prepare a new development
plan. The Worthing Local Plan will:
aim to meet the objectively assessed development and infrastructure needs.
identify land where development would be appropriate / inappropriate.
contain a clear strategy for enhancing the natural, built and historic environment.
The plan will cover land use proposals relating to housing business, retail, and transport and will
include new land use allocations where they are needed and policies which will be used to assess
planning proposals.
Following the Regulation 18 Consultation that took place in late 2018, it is expected that the
Submission Stage (Regulation 19) version of the Local Plan will be published for consultation in
January / February 2021.
1.3 SUITABILITY OF THE TRAFFIC MODEL
The traffic model that is the basis for the traffic assessment is Highways England’s A27 strategic
traffic model that has been used to assess the Road Investment Strategy (RIS) Period 1 schemes
for A27 Worthing and Lancing and A27 Arundel. It is noted that the ‘model calibration and validation
process….was undertaken successfully and shows the model provides a satisfactory representation
of the existing traffic situation across all peaks…..This indicated the modelled data provides a good
fit with the observed data and provides a suitable basis for transport forecasting and scheme
WORTHING LOCAL PLAN PUBLIC | WSP
Project No.: 70033198 | Our Ref No.: 70033198-TAA January 2021
Worthing Borough Council Page 1 of 24appraisal’1. Highways England has raised the following representation as part of their response to
the Regulation 18 Consultation:
“Highways England advised that whilst the model was fit for the purposes of economic trunk road
option assessment it may not be suitable for assessment of strategic allocations of any Local Plan
proposals. This is because Local plans are assessed using different guidance and policies to major
highway investment schemes. Accordingly our advice was that the model should be reviewed and
amended and re-validated to ensure that it was fit for purpose for Worthing’s Local Plan.”
Further representation was submitted in relation to a key feature of Highways England’s traffic
model; that it reflects average peak periods rather than single peak hours.
“The modelling work as presented uses an average peak period assessment (averaged over three
hours) which is not appropriate for the assessment of the Local Plan. Accordingly, Highways
England cannot accept the findings of the report as presented”.
These matters were discussed at a meeting between WBC, Highways England and consultants
WSP and Atkins on 13th February 2019. In addition, further requests for information were sent by
Highways England to WSP on 7th March 2019, 14th April 2019 and 15th November 2019. This note
summarises the information provided by WSP to Highways England during this period, in
accordance with the following headings:
Traffic flows
Traffic routing
Journey times
Trip rates
1.3.1. Traffic flows (links)
To address Highways England’s representation relating to the traffic model, a number of
comparisons have been made to establish the difference between average peak period and peak
hour traffic flows and between observed and modelled traffic flows.
The location of sites for the additional traffic flow comparisons (links and junctions) is shown in
Figure 1-1, with the locations indicated by blue circles.
1 A27 Arundel Bypass, Combined Modelling and Appraisal Report (August 2019), sections 3.14 and 3.17
WORTHING LOCAL PLAN PUBLIC | WSP
Project No.: 70033198 | Our Ref No.: 70033198-TAA January 2021
Worthing Borough Council Page 2 of 24Figure 1-1 – Location of sites for additional traffic flow comparison
© Crown Copyright and database right (2018). Ordnance Survey 100024321 & 100018824
Table 1-1 presents a comparison of the observed data for years 2015 and 2018, for neutral weeks
only, for the A27 at Upper Brighton Road, east of Grove Lodge roundabout2. Both the average peak
period (07:00 – 10:00 and 16:00 – 19:00) and highest peak hour within each period are presented.
The table shows that for all comparisons but one, the difference between the peak period and peak
hour flow on the A27 in each year and in each direction is less than 5%, and less than 50 vehicles
per hour. This level of difference is considered to be non-material, and well within typical daily
variation in flow.
The only comparison that indicates a greater level of difference is in the eastbound direction, during
the AM, in 2018, where the peak period data is shown to be 9.3% lower than the peak hour data.
2 Highways England WebTRIS database – sites 30360477 and 30360478. These sites have continuously
recorded traffic data between 2015 and 2018
WORTHING LOCAL PLAN PUBLIC | WSP
Project No.: 70033198 | Our Ref No.: 70033198-TAA January 2021
Worthing Borough Council Page 3 of 24Table 1-1 - Peak Period and Peak Hour flows – A27 Upper Brighton Road
Year Direction AM PM
Period Hour % diff Period Hour % diff
2018 EB 1094 1206 -9.3% 1201 1231 -2.5%
WB 1124 1132 -0.8% 1126 1144 -1.6%
2015 EB 1153 1201 -4.0% 1258 1302 -3.4%
WB 1088 1097 -0.8% 1048 1094 -4.2%
To confirm the significance of this difference, the peak period and peak hour data has been
compared to Highways England’s traffic model flows. The results are presented in Table 1-2.
Table 1-2 - Comparison of modelled with observed flows – A27 Upper Brighton Road
Year Direction Model AM Period AM Hour PM Period PM Hour
AM PM % diff GEH % diff GEH % diff GEH % diff GEH
2015 EB 1343 1249 16.5% 5.4 11.8% 4.0 -0.7% 0.3 -4.1% 1.5
WB 1087 1046 -0.1% 0.0 -0.9% 0.3 -0.2% 0.1 -4.4% 1.5
When the traffic model is compared to the AM and PM peak hour observed data, all modelled flows
are within 15% and a GEH of 5.0, which is consistent with WebTAG criteria and indicates a good
level of fit between observed and modelled data.
The remainder of the traffic flow comparison presents information for a number of locations across
the wider road network.
WORTHING LOCAL PLAN PUBLIC | WSP
Project No.: 70033198 | Our Ref No.: 70033198-TAA January 2021
Worthing Borough Council Page 4 of 24Table 1-3 presents a comparison of the observed data for years 2015 and 2018 at a location on the
route between the A27 / A280 junction and Grove Lodge roundabout via Titnore Lane and the
A20323. Table 1-4 presents a comparison between modelled and observed flows at this location.
Table 1-3 - Peak Period and Peak Hour flows – A2032 Littlehampton Rd
Year Direction AM PM
Period Hour % diff Period Hour % diff
2018 EB 1096 1161 -5.6% 1014 1100 -7.8%
WB 893 971 -8.0% 997 1085 -8.1%
2015 EB 1156 1264 -8.5% 1003 1074 -6.6%
WB 866 933 -7.2% 1006 1092 -7.9%
The data shows that the peak period flows are consistently between 5 and 9% lower than the peak
hour flows, or typically in the order of 80 vehicles lower.
Table 1-4 - Comparison of modelled with observed flows – A2032 Littlehampton Rd
Year Direction Model AM Period AM Hour PM Period PM Hour
AM PM % diff GEH % diff GEH % diff GEH % diff GEH
2015 EB 1131 999 -2.3% 0.8 -11.7% 3.8 -0.4% 0.1 -7.5% 2.3
WB 856 999 -1.2% 0.4 -9.0% 2.6 -0.7% 0.2 -9.3% 2.9
When the model is compared to the AM and PM peak hour observed data, all modelled flows are
within 15% and a GEH of 5.0, which is consistent with WebTAG criteria and indicates a good level of
fit between observed and modelled data. This, and the information in Table 1-2, demonstrates that
the model provides a suitably accurate representation of both average peak period and peak hour
flows at key locations within the traffic model network.
3West Sussex County Council (WSCC) database – site 1323. This site provides a complete data set for the
years 2015 and 2018 and is located just east of the A259 / A2032 Goring Crossways roundabout.
WORTHING LOCAL PLAN PUBLIC | WSP
Project No.: 70033198 | Our Ref No.: 70033198-TAA January 2021
Worthing Borough Council Page 5 of 24Additional flow comparisons have been undertaken following a further review of the availability of
traffic count information. These include a comparison of modelled with observed flows at Titnore
Lane, which is part of the potential alternative route to the A27 via the A2032.
The results are presented in Table 1-5 and show a good level of calibration is achieved in
comparison to observed AM and PM peak period flows. When considered against highest peak hour
flows, the modelled flows are lower, and outside of GEH of 5 in a southbound direction.
Table 1-5 - Comparison of modelled with observed flows – Titnore Lane
Year Direction Model AM Period AM Hour PM Period PM Hour
AM PM % diff GEH % diff GEH % diff GEH % diff GEH
2015 NB 459 488 2.0% 0.4 -12.3% 2.6 -1.9% 0.4 -23.1% 4.8
SB 525 436 0.4% 0.1 -32.3% 6.9 -25.3% 5.0 -43.8% 8.3
A further comparison of observed and modelled flow has been undertaken at sites outside of the
Worthing Local Plan study area, to the west at the junction of the A259 / A280. The total volume of
traffic using the main local authority roads to and from the west of the Worthing Local Plan study
area, the A280 and the A259, have been considered.
The information presented in Table 1-6 shows a good fit between observed (peak period) and
modelled data.
Table 1-6 - Flow comparison – A280 Water Lane, A259 Littlehampton Rd
Location Direction AM PM
Observed Modelled GEH Observed Modelled GEH
A280 Water EB 634 645 0.4 486 514 1.2
Lane
WB 507 507 0.0 872 862 0.4
A259 EB 1586 1568 0.5 1350 1443 2.5
Littlehampton
Rd
WB 1047 1049 0.1 1460 1478 0.5
WORTHING LOCAL PLAN PUBLIC | WSP
Project No.: 70033198 | Our Ref No.: 70033198-TAA January 2021
Worthing Borough Council Page 6 of 241.3.2. Traffic flows (junctions)
Further analysis of traffic flow has been undertaken using observed turning count data4. It is noted
that this observed turning data is taken from single day’s counts and is associated with a lower level
of confidence than the link traffic flow data from long-term automatic traffic count (ATC) sites.
Therefore, there should be greater caution in comparing observed and modelled flows using this
data.
A junction turning count at the A27 / A24 Offington Lane junction has been compared to the
modelled flows. Comparisons have been undertaken at a link level rather than turn level. The
observed data is from a single day count, and therefore associated with a lower level of confidence
than long term ATC data in terms of the data reflecting typical average conditions. The results are
presented in Table 1-7.
Table 1-7 - Comparison of modelled with observed flows – A27 Offington Lane Rdbt
A27 Arm Dir. Model Observed Difference
AM PM AM PM AM PM
A24 Findon SB 893 1114 822 1048 71 65
Road
(North)
NB 965 872 953 934 -59 -61
A27 Warren WB 899 701 1333 1393 -434 -692
Road (East)
EB 643 1041 1103 1161 -460 -120
A2031 NB 811 1034 632 561 179 473
Offington
Lane SB 918 784 460 654 458 129
Goodwood NB 78 94 38 18 40 75
Road
SB 20 121 12 21 8 100
A27 EB 957 892 837 979 120 -87
Crockhurst
Hill (West) WB 1092 1016 1134 1229 -42 -214
4The available turning count data has been established using the information presented within the A27
Worthing Lancing and A27 Arundel Improvements Traffic Data Collection Report (TDCR) (September 2016)
WORTHING LOCAL PLAN PUBLIC | WSP
Project No.: 70033198 | Our Ref No.: 70033198-TAA January 2021
Worthing Borough Council Page 7 of 24The modelled and observed flows compare well on three of the five individual arms at this junction,
the A24 Findon Road, Goodwood Road, and the A27 Crockhurst Hill (West). The data illustrates an
imbalance of modelled traffic flow on the A27 Warren Road (East) and the A2031 Offington Lane
arms, with modelled flows lower than observed on the A27 and higher than observed on the A2031.
The overall flows at the junction are a close match to observed flows, with total modelled volumes
within 5% of observed values.
The junction turning count at the A27 / A24 Grove Lodge Roundabout has been compared to the
modelled flows on the same basis as for the A27 Offington Lane roundabout, described above. The
results are presented in Table 1-8.
Table 1-8 - Comparison of modelled with observed flows – A27 Grove Lodge Rdbt
A27 Arm Dir. Model Observed Difference
AM PM AM PM AM PM
Hill Barn SB 58 50 82 98 -24 -48
Lane
NB 43 48 103 97 -77 -49
A27 Upper WB 1092 1062 1131 1118 -39 -56
Brighton
Road (East) EB 1349 1287 1160 1291 189 -5
A24 NB 1042 822 910 908 131 -86
Broadwater
St West SB 544 939 670 677 -126 262
A27 Warren EB 643 1041 1115 1173 -472 -132
Road (West)
WB 899 701 1305 1232 -405 -531
The modelled and observed flows compare well on three of the four individual arms at this junction,
Hill Barn Lane, A27 Upper Brighton Road (East) and A24 Broadwater St West. For Hill Barn Lane
the flows are low which limits the size of the actual differences; the proportional differences at this
location are not significant to the overall junction as this arm has much lower flow than the three
main arms.
The data illustrates the modelled flows for the A27 Warren Road (West) are lower than observed.
This correlates with the information presented in Table 1-7 for A27 Warren Road. The overall flows
at the junction are within 15% of observed values, with modelled lower than observed.
It can be concluded from this comparison that there is a good overall fit between total observed and
modelled flows at both the A27 Offington Lane roundabout and the A27 Grove Lodge roundabout. At
a link level, there is also a good fit between observed and modelled flows with the particular
WORTHING LOCAL PLAN PUBLIC | WSP
Project No.: 70033198 | Our Ref No.: 70033198-TAA January 2021
Worthing Borough Council Page 8 of 24exception of the A27 Warren Road arm on both the Offington Lane and Grove Lodge Roundabout
junctions, where modelled flows are lower than observed values.
The junction turning count at the A27 / Upper Brighton Road / Lyons Way has been compared to the
modelled flows on the same basis as for the locations in Tables 1-7 and 1-8. The results are
presented in Table 1-9.
Table 1-9 - Comparison of modelled with observed flows – A27 / Lyons Way
A27 Arm Dir. Model Observed Difference
AM PM AM PM AM PM
Lyons Way SB 127 144 242 521 -115 -378
NB 98 198 138 210 -40 -12
A27 WB 1244 1299 1279 1214 -35 85
Sompting
Bypass (E) EB 1661 1667 1728 1766 -67 -99
Upper NB 122 86 305 293 -182 -206
Brighton
Road
SB 97 137 78 148 19 -11
A27 EB 1744 1853 1525 1541 220 312
Sompting
Bypass (W)
WB 1381 1380 1406 1445 -25 -65
The modelled and observed flows compare well for most of the movements at this junction, with
particularly good fit between observed and modelled flows on the A27 arms. There is a lower
volume of trips in the model on the Lyons Way southbound movement, associated with how the
traffic model represents retail trips. The Upper Brighton Road northbound movement is lower than
observed. The overall flows at the junction are a close match to observed flows, with total modelled
volumes within approximately 5% of observed values.
1.3.3. Traffic Routing
The potential for the use of the A2032 as a diversion route to the A27 within the traffic model has
been considered. It is necessary to consider whether differences in model journey times along the
A2032 and A27 routes could result in unrealistic routing within the model, with Highways England
considering that this may contribute to the model potentially under-estimating flows on the A27.
WORTHING LOCAL PLAN PUBLIC | WSP
Project No.: 70033198 | Our Ref No.: 70033198-TAA January 2021
Worthing Borough Council Page 9 of 24For the purposes of assessing traffic routing within the model, the route from the A27 / A280 /
Titnore Lane junction to just east of the Grove Lodge roundabout has been considered (locations
highlighted on Figures 1-2 and 1-3, below).
The route via the A27 is circa 3.8 miles, and via the A2032 is 5.0 miles which suggests it would be
unlikely in principle for the alternative route via the A2032 to be an attractive diversionary route,
except in the event of a significant incident on the A27. For reference, the modelled journey time
(base year) on these routes is presented in Table 1-10 and shows that the A2032 route is, broadly,
100 – 200 seconds slower than the A27.
Table 1-10 - Modelled journey times (s) – A27 and A2032
Route Direction Base Year
AM PM
A27 EB 624 518
WB 503 435
A2032 EB 763 726
WB 621 627
This data illustrates that the journey time on the potential A2032 diversionary route is greater than
on the A27 route. To confirm whether there is any issue within the transport model relating to a
realistic or unrealistic diversion of traffic away from the A27, a ‘select link’ analysis has been
undertaken to identify any routing of traffic along the A2032. This has been undertaken on both the
traffic model base year and the forecast year scenarios.
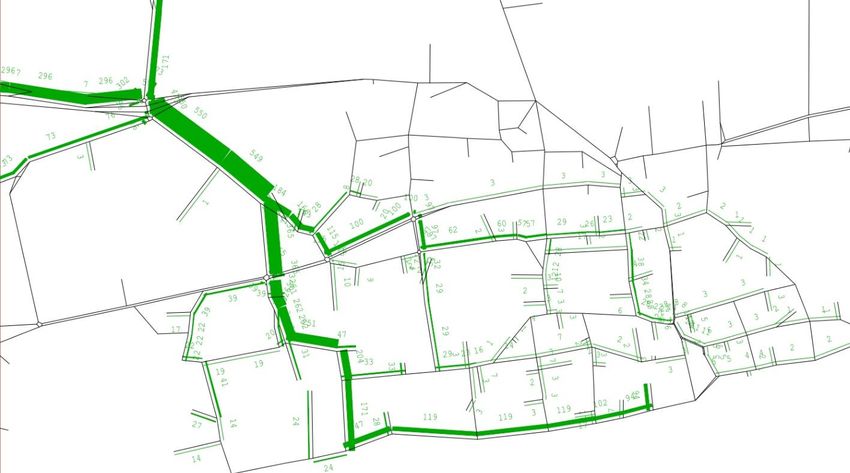
The select link analysis for all scenarios illustrates that no traffic within the model uses the A2032
route and therefore there is no under-estimation of flow on the A27 that would result from this issue.
The select link analysis for the base year scenario is illustrated in Figure 1-2 and Figure 1-3, using
the AM peak scenario (PM and forecast scenarios show the same pattern of routing).
WORTHING LOCAL PLAN PUBLIC | WSP
Project No.: 70033198 | Our Ref No.: 70033198-TAA January 2021
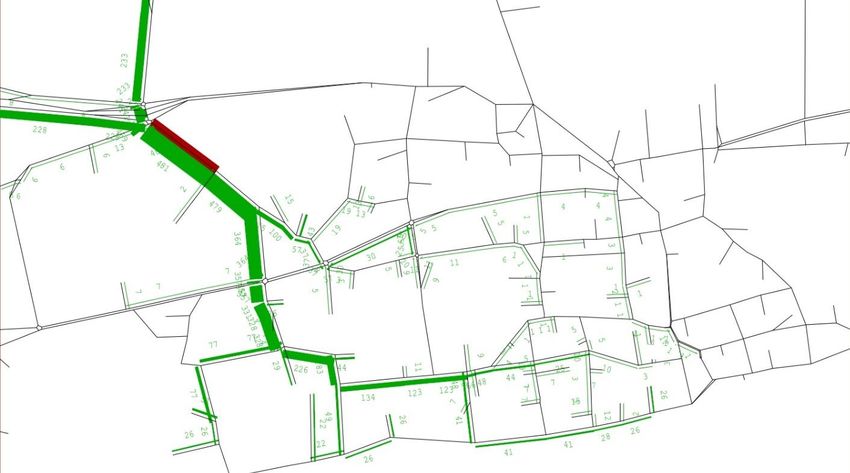
Worthing Borough Council Page 10 of 24Figure 1-2 - Select Link Analysis - Routing via Titnore Lane (AM Northbound) Figure 1-3 - Select Link Analysis - Routing via Titnore Lane (AM Southbound) Routing within the traffic model has also been considered between the A280 / A259 junction to the west, and just east of Grove Lodge roundabout. The route via the A27 is longer, at circa 5.9 miles compared with circa 4.6 miles via the A2032. A select link analysis has been undertaken and Figures 1-4 and 1-5 illustrate the routing within the model between the A280 / A259 junction and just east of Grove Lodge roundabout. WORTHING LOCAL PLAN PUBLIC | WSP Project No.: 70033198 | Our Ref No.: 70033198-TAA January 2021 Worthing Borough Council Page 11 of 24
Figure 1-4 - Select Link Analysis - West of A280 / A259 junction (AM eastbound)

Figure 1-5 - Select Link Analysis - A27 east of Grove Lodge roundabout (AM westbound)

The analysis shows that trips that pass these two points use the route via the A2032. To accompany
this analysis, the model calibration results have been considered in order to confirm the absolute
level of volume within the traffic model on the two routes to and from the A280 / A259 junction is
correct. This is demonstrated within Table 1-6 and confirms there is no difference in modelled flows
that would suggest the routing of traffic within the model is incorrect.

WORTHING LOCAL PLAN                                                                   PUBLIC | WSP
Project No.: 70033198 | Our Ref No.: 70033198-TAA                                      January 2021
Worthing Borough Council                                                               Page 12 of 24
1.3.4.   Journey Times
         The journey time information that was processed and used for the purposes of developing the
         Highways England’s A27 traffic model has been reviewed. The source of the journey time data is
         Trafficmaster5. The journey time data used to validate the model reflects average peak period
         conditions. The journey time for the peak hour has been extracted from this data.
         Both measures of journey time have then been compared to the A27 traffic model journey time. The
         extent of network considered in this assessment is consistent with one of the journey time routes
         that was used to validate the model. This includes the full extent of the A27 within Worthing
         Borough, from the junction of A27 / A280 to the west, to the junction of A27 / A283 to the east. The
         results of the assessment are presented in Table 1-11, with journey times presented in seconds.

         Table 1-11 - Peak Period and Peak Hour journey times – A27 through Worthing Borough

             Aggregation Direction                     AM                                     PM

                                        Observed      Modelled        % diff   Observed     Modelled        % diff

             Peak        EB                  1161          1199       3.3%          1066         1015      -4.8%
             Period
                         WB                  1115          1098      -1.5%          1120         1111      -0.8%

             Peak        EB                  1242          1199      -3.5%          1141         1015     -11.0%
             Hour
                         WB                  1288          1098     -14.8%          1194         1111      -7.0%

         The data illustrates that the peak hour journey times are greater than the average peak period by
         between 1 and 2 minutes on average, for journey times that are in the order of 20 minutes. When
         the modelled journey time is compared to the AM and PM peak hour observed journey time data, all
         journey times remain within 15%, which is consistent with WebTAG criteria and indicates a good
         level of fit between observed and modelled data. This demonstrates that the model provides a
         suitably accurate representation of both average peak period and peak hour journey times.
         Highways England has requested similar data be presented for a journey time along the same route
         from the A27 / A280 junction to the west through to Lambleys Lane in the east. Processed
         Trafficmaster data for that specific timing point is not available, therefore the nearest available timing
         point has been considered which is at the A27 / Lyons Way / Upper Brighton Road junction. The
         results of the assessment are presented in Table 1-12.

         5Data made available via the DfT purchased from Trafficmaster which contains Global Positioning System
         (GPS) derived journey times of vehicles

         WORTHING LOCAL PLAN                                                                        PUBLIC | WSP
         Project No.: 70033198 | Our Ref No.: 70033198-TAA                                           January 2021
         Worthing Borough Council                                                                    Page 13 of 24
Table 1-12 - Peak Period and Peak Hour journey times – A27 / A280 to Lyons Way
Aggregation Direction AM PM
Observed Modelled % diff Observed Modelled % diff
Peak EB 719 686 -4.6% 662 585 -11.6%
Period
WB 593 569 -4.0% 538 485 -9.9%
Peak EB 755 686 -9.1% 696 585 -15.9%
Hour
WB 642 569 -11.4% 539 485 -10.0%
It should be noted that the journey times presented in Table 1-12 are for a shorter section of road
network than has been subject to model validation. All comparisons indicate modelled journey times
being lower than observed journey times. The data shows that seven out of the eight comparisons
fall within 15% difference and one comparison that falls outside of 15%, (the peak hour data
aggregation in the PM peak). The model is around 8 seconds too slow to fall within 15% of the
observed journey times.
1.3.5. Trip Rates
Highways England raised the following representation as part of their response to the Regulation 18
Consultation:
In addition to this fundamental concern with the modelling approach, we require further details on
the TRICS rates and some more detail information on the trip distribution. For example, all leisure
and retail trips have been excluded as they are assumed to be linked or internal! “
Further information was submitted to Highways England for review and the trip rate information was
confirmed to be satisfactory on 15th January 2020.
1.3.6. Summary of suitability of traffic model
Highways England’s A27 traffic model has been used to assess the RIS1 schemes for A27 Worthing
and Lancing and A27 Arundel and is the basis for the traffic assessment of the WBC Local Plan.
The ‘model calibration and validation process…was undertaken successfully and shows the model
provides a satisfactory representation of the existing traffic situation across all peaks’. The further
analysis of the suitability of the model has confirmed the following:
Traffic flows – The additional link flow comparisons have shown a very good fit between the
observed and modelled flow data, including on the A27, at both peak period and peak hour
levels. The total flows at key A27 junctions are within 15% of observed values.
WORTHING LOCAL PLAN PUBLIC | WSP
Project No.: 70033198 | Our Ref No.: 70033198-TAA January 2021
Worthing Borough Council Page 14 of 24 Traffic routing – Analysis has shown that the traffic routing within the model is intuitive for key
routes associated with the A27 and A2032, and there is no issue that would result in a specific
under-estimation of flow on these routes.
Journey time – The traffic model validates well against observed journey time data along the A27
through Worthing Borough, and for shorter sections of the route through the Worthing urban area.
Trip rates – Assumptions have been agreed as suitable for the purposes of the Local Plan
transport assessment.
The A27 modelled traffic data has been shown to provide a good fit with the observed data and
provides a suitable basis for transport forecasting and scheme. There is one noted limitation in
relation to the modelled traffic flows on the A24 Warren Road, between the A27 Offington junction
and the A27 Grove Lodge roundabout. The modelled flows for the A24 Warren Road are lower the
level of observed flow when compared with observed turning count data. This limitation has been
considered further in relation to the operational assessment of these junctions and is described
further in section 1.4.
1.4 IMPACT UPON THE STRATEGIC ROAD NETWORK
The Worthing Local Plan Transport Assessment (August 2018) describes the transport impacts of
the proposed Local Plan sites (Chapter 5). As part of the assessment, an ‘area of influence’ was
established for further, more detailed investigation which included three specific junctions on the
strategic road network:
Beeches Avenue / A27
Lyons Way / Upper Brighton Road / A27
A27 / A280 / Titnore Lane
These junctions were subject to operational assessment (Transport Assessment, Chapter 6) with
conclusions drawn that there would be no material impact upon the overall performance of these
junctions.
Chapter 7 of the Transport Assessment sets out a mitigation package that includes a number of
highway interventions on the local authority road network, areas for road safety mitigation and areas
of potential walking and cycling intervention. Sustainable transport measures are described as part
of the package, including measures to manage the level of vehicular trip generation from new
developments to manage the potential impacts upon the local and strategic road networks.
Highways England required more detailed consideration of two further junctions of the strategic road
network. These junctions are:
A27 / A24 Grove Lodge Roundabout
A27 / A24 / Offington Lane
For the operational modelling of the A27 / A24 Grove Lodge Roundabout and the A27 / A24 /
Offington Lane junction, modelled traffic demand flows have been extracted from the traffic model
and the results of the operational assessment for these junctions is presented below.
To address the limitations of the model flows noted in section 1.3.6, the following methodology has
been followed for the operational assessment of these junctions. The difference between the traffic
WORTHING LOCAL PLAN PUBLIC | WSP
Project No.: 70033198 | Our Ref No.: 70033198-TAA January 2021
Worthing Borough Council Page 15 of 24model forecast and base year traffic volumes has been added to the observed turning movements to
establish a flow forecast that reflects a level of growth in addition to current observed traffic volumes.
1.4.1. A27 / A24 / Grove Lodge Roundabout
Tables 1-13 and 1-14 present the results of the operational assessment.
Commensurate with the increase in traffic volumes resulting from the Worthing Local Plan sites, the
information in Tables 1-13 to 1-14 show a slight overall increase in queuing and delay.
These tables illustrate that the maximum Degree of Saturation, on the A24 Warren Road approach,
would be 91.2%, with performance relatively similar to Do Minimum conditions. This level of
performance would suggest that the Local Plan sites do not result in a significant adverse impact on
the performance of the junction, and some performance improvement could be achieved through a
reduction in vehicular trip making as an outcome of the implementation of sustainable transport
measures.
WORTHING LOCAL PLAN PUBLIC | WSP
Project No.: 70033198 | Our Ref No.: 70033198-TAA January 2021
Worthing Borough Council Page 16 of 24Table 1-13 - Traffic flow forecast – Grove Lodge Rdbt performance – 2033 AM Peak
Arm Link Do Minimum With WLP
DoS MMQ Delay DoS MMQ Delay
(pcu) (s) (pcu) (s)
Hill Barn Lane Left Ahead 1/1 21.4% 0.9 8.3 17.4% 0.5 7.6
Upper Brighton Rd Ahead 3/1+3/2 74.0% 12.2 11.3 77.8% 13.9 12.4
Left
Upper Br'ton Rd Exit Ped 4/1 78.4% 12.0 6.7 81.8% 14.1 7.8
Ahead
Upper Br'ton Rd Internal 5/1 51.9% 5.6 28.3 49.6% 5.3 27.9
Ahead
Upper Br'ton Rd Internal 5/2 51.4% 5.5 29.1 49.2% 5.1 29.0
Right Ahead
Broadwater St West Ahead 6/1 55.7% 9.4 24.4 62.5% 11.2 25.3
Broadwater St West Ahead 6/2 60.1% 11.1 25.1 58.8% 11.0 24.1
Br'dwater St W Internal 7/1 51.2% 8.8 14.1 50.9% 8.7 14.2
Right
Br'dwater St W Internal 7/2 52.4% 9.1 15.3 51.8% 8.8 16.2
Right Right2
Warren Rd Exit Ped Ahead 8/1 41.6% 1.2 2.4 43.2% 1.5 2.6
Warren Rd Exit Ped Ahead 8/2 44.3% 1.8 2.6 45.1% 1.9 2.7
Warren Rd Ahead Ahead2 9/1 81.7% 19.4 26.1 84.1% 21.2 26.3
Warren Rd Ahead 9/2 35.0% 5.7 14.0 33.6% 5.4 12.8
Warren Road Internal Right 10/1+10/2 79.7% 14.3 18.8 85.1% 15.6 26.5
Right2
WORTHING LOCAL PLAN PUBLIC | WSP
Project No.: 70033198 | Our Ref No.: 70033198-TAA January 2021
Worthing Borough Council Page 17 of 24Table 1-14 - Traffic flow forecast – Grove Lodge Rdbt performance – 2033 PM Peak
Arm Link Do Minimum With WLP
DoS MMQ Delay DoS MMQ Delay
(pcu) (s) (pcu) (s)
Hill Barn Lane Left Ahead 1/1 47.3% 2.5 15.4 54.3% 3.7 21.2
Upper Brighton Rd Ahead 3/1+3/2 78.7% 13.6 12.4 87.6% 19.4 15.5
Left
Upper Br'ton Rd Exit Ped 4/1 85.6% 18.4 9.8 87.2% 11.3 8.9
Ahead
Upper Br'ton Rd Internal 5/1 57.3% 6.6 34.1 67.6% 5.4 48.9
Ahead
Upper Br'ton Rd Internal 5/2 57.7% 6.3 34.4 68.2% 7.7 54.4
Right Ahead
Broadwater St West Ahead 6/1 54.1% 8.5 27.1 49.8% 10.2 32.2
Broadwater St West Ahead 6/2 70.8% 13.3 31.4 76.3% 20.0 40.6
Br'dwater St W Internal 7/1 56.0% 10.7 13.3 63.0% 11.5 20.5
Right
Br'dwater St W Internal 7/2 56.7% 10.8 14.8 63.0% 11.5 20.5
Right Right2
Warren Rd Exit Ped Ahead 8/1 45.6% 1.2 2.5 47.0% 1.1 2.2
Warren Rd Exit Ped Ahead 8/2 47.5% 1.8 2.6 48.8% 1.6 2.3
Warren Rd Ahead Ahead2 9/1 86.8% 22.8 29.5 91.2% 33.4 42.1
Warren Rd Ahead 9/2 32.4% 5.1 13.2 32.9% 6.9 17.2
Warren Road Internal 10/1+10/2 86.3% 18.7 22.3 89.2% 26.4 28.9
Right Right2
WORTHING LOCAL PLAN PUBLIC | WSP
Project No.: 70033198 | Our Ref No.: 70033198-TAA January 2021
Worthing Borough Council Page 18 of 241.4.2. A27 / A24 / Offington Lane junction
Tables 1-15 and 1-16 present the results of the operational assessment using the forecast flows
which are informed by the observed turning movements.
Table 1-15 - Traffic flow forecast - A27 Offington Lane Junction - 2033 AM Peak
Arm Do Minimum With WLP
RFC Queue Delay (s) RFC Queue Delay (s)
(pcu) (pcu)
A - A24 Findon Road 0.65 2 7 0.67 2 8
B - A24 Warren Road 0.83 5 12 0.84 5 12
C - Offington Lane 0.65 2 10 0.64 2 10
D - Goodwood Road 0.84 3 219 1.07 5 331
E - A27 Crockhurst Hill 0.65 2 7 0.65 2 7
Table 1-16 - Traffic flow forecast - A27 Offington Lane Junction - 2033 PM Peak
Arm Do Minimum With WLP
RFC Queue Delay (s) RFC Queue Delay (s)
(pcu) (pcu)
A - A24 Findon Road 0.80 4 14 0.80 4 14
B - A24 Warren Road 1.03 43 81 1.11 109 177
C - Offington Lane 0.52 1 8 0.43 1 7
D - Goodwood Road 0.00 0 0 0.00 0 0
E - A27 Crockhurst Hill 0.71 2 7 0.70 2 7
Commensurate with the increase in traffic volumes resulting from the Worthing Local Plan sites, the
information in Tables 1-15 and 1-16 show an overall increase in queuing and delay. The impact
upon the A27 Crockhurst Hill and A24 Warren Road arms is negligible during the AM peak. The A24
WORTHING LOCAL PLAN PUBLIC | WSP
Project No.: 70033198 | Our Ref No.: 70033198-TAA January 2021
Worthing Borough Council Page 19 of 24Warren Road RFC increases from 1.03 to 1.11 during the PM peak, with queuing more than
doubled. However, the queue length would not extend back to the A27 / Grove Lodge Roundabout.
Highways England maintains concern in relation to proposals that have the potential to impact the
safe and efficient operation of the A27 / A24 trunk road. With reference to the operational
assessment results, it is shown that the conditions on the A24 Warren Road approach of the A27
Offington Lane would be exacerbated by an increase in traffic movements, with queuing increasing
from 43 to 109 pcu’s.
Collision analysis presented within the WLP Transport Assessment (August 2018) identifies
locations where collision clusters are observed, and this includes the A27 / A24 / Offington Lane
junction. To consider the collision record at this junction in further detail, the analysis has been
updated with more recent collision data (for the period July 2015 to October 2020) and the results
for this particular junction are presented in Table 1-17. The number of collisions over the 5-year
period is limited to 10, and only one serious incident during that period of time. The updated data
does not change any conclusions from the WLP Transport Assessment.
Table 1-17 - A27 Offington Lane Junction – Collision data
Location Severity Total
Slight Serious Fatal
A27 / A24 9 1 0 10
The mitigation strategy for the strategic road network, and in particular to mitigate the queuing
increase on the A24 Warren Road arm of the A27 Offington Lane junction, is described in section
1.5.
1.5 MITIGATION STRATEGY FOR THE STRATEGIC ROAD NETWORK
Highways England has set out the following in its representation DWLP-M-111.
“As the Council is aware there is currently no preferred scheme for the A27 improvements in
Worthing. Therefore the Local Plan requires morning and evening peak hour assessments including
mitigation if required.”
The strategy and policy position that informs decisions relating to transport mitigation has continued
to change in the period between the completion of the WLP Transport Assessment (August 2018)
and the planned Submission Stage (Regulation 19) consultation in early 2021. Key developments in
strategy and policy include:
UK Government committed in 2019 to a legally binding target of net zero emissions by 2050, and
subsequently announced a policy to ban the sale of new cars and vans powered wholly by petrol
and diesel, by 2030.
WORTHING LOCAL PLAN PUBLIC | WSP
Project No.: 70033198 | Our Ref No.: 70033198-TAA January 2021
Worthing Borough Council Page 20 of 24 Many Local Authorities (including Adur & Worthing Councils) have declared climate emergencies and developed carbon reduction action plans. WSCC followed their declaration with the adoption of a Climate Change Strategy which targets net zero carbon emissions by 2030. Adur & Worthing Councils have developed and adopted a Carbon Neutral Plan which explains how the Councils will work towards a 2030 net zero target. ‘Gear change: a bold vision for cycling and walking’, was published by the DfT in 2020, setting out a travel revolution in England’s communities. A Local Cycling and Walking Infrastructure Plan (LCWIP)6 has been developed following widespread consultation throughout Adur and Worthing. The UK Government has also outlined a £2bn package to support active travel and WSCC has identified a range of projects including new Findon Valley to Findon Village footways / cycleways, ‘school gate’ improvements including Bikeability training, and an active travel improvements programme. Cycle lanes had been provided on the A24 in Worthing as part of ‘Tranche 1’ active travel measures, however the original layout will be re-instated. The DfT’s RIS2 (2020) has announced investment in roads to support a high quality and resilient transport network, reflecting the mixed-use of roads by vehicles, pedestrians, cyclists and horse- riders. RIS2 includes commitment to a package of improvements between Worthing and Lancing to enhance the road capacity and flow of traffic. In 2020, the COVID-19 global pandemic and associated social distancing regulations continue to bring about significant short-term changes to travel behaviour, including a reduced need to travel as a result of home working, reduced reliance on public transport and increased levels of walking and cycling. The policy impetus at local and national levels continues to focus on facilitating an increase in public transport, walking and cycling as alternatives to the private car, and whilst the medium to long-term trends are uncertain, it is clear that schemes which help people access these modes can have a significant economic, environmental and social benefit. In the context of the evolving policy and strategy context described above and potential short to medium term changes in travel behaviour relating to mode shift and increasing home / virtual working, the focus of the mitigation strategy is to ‘identify appropriate and proportionate mitigation measures, and ensure that what is proposed promotes sustainable transport outcomes and avoids unnecessary works to the SRN7’. To illustrate the level of mitigation that a sustainable mitigation package might provide to the performance of the A27 Offington Lane junction, a 10% reduction in vehicular trip making associated with the new Local Plan development sites has been applied to the forecast traffic flows. This is the lower end of the range which national guidance8 cites. ‘Targets being used at present tend to be reductions on what would be expected without a travel plan of 10 – 20%’. This reduction reflects the impact of the sustainable measures described within section 7.2 of the WLP Transport Assessment (August 2018). and the societal move towards part-time home working. 6 Local Cycling & Walking Infrastructure Plan, Adur & Worthing Councils (2020) 7 The strategic road network – Planning for the future, Highways England (September 2015) 8 Good Practice Guidelines: Delivering Travel Plans through the Planning Process, DCLG, DfT (April 2009) WORTHING LOCAL PLAN PUBLIC | WSP Project No.: 70033198 | Our Ref No.: 70033198-TAA January 2021 Worthing Borough Council Page 21 of 24
Furthermore, a 5% reduction in general vehicular trip making has been applied to the forecast traffic
flows to reflect the impact of broader policy changes and societal trends associated with active travel
and home working. This % reduction remains less than the target and illustrative out-turn levels of
reduction described within section 7.2 of the WLP Transport Assessment (August 2018).
Tables 1-18 and 1-19 illustrate the improvement in performance that would be achieved with a
sustainable mitigation package which reduces vehicular traffic at this location.

Table 1-18 - Flow forecast (mitigation) - A27 Offington Lane – 2033 AM Peak

 Arm                                     Do Minimum                  With WLP & mitigation

                                RFC         Queue Delay (s)      RFC         Queue Delay (s)
                                            (pcu)                            (pcu)

 A - A24 Findon Road            0.65        2        7           0.62        2        7

 B - A24 Warren Road            0.83        5        11          0.79        4        9

 C - Offington Lane             0.65        2        10          0.62        2        9

 D - Goodwood Road              0.84        3        219         0.57        1        104

 E - A27 Crockhurst Hill        0.65        2        7           0.62        2        7

Table 1-19 - Observed flow forecast - A27 Offington Lane mitigation – 2033 PM Peak

 Arm                                     Do Minimum                  With WLP & mitigation

                                RFC         Queue Delay (s)      RFC         Queue Delay (s)
                                            (pcu)                            (pcu)

 A - A24 Findon Road            0.80        4        14          0.76        3        11

 B - A24 Warren Road            1.03        43       81          1.04        53       95

 C - Offington Lane             0.52        1        8           0.54        1        8

 D - Goodwood Road              0.00        0        0           0.23        0        117

 E - A27 Crockhurst Hill        0.71        2        7           0.71        3        8

WORTHING LOCAL PLAN                                                                       PUBLIC | WSP
Project No.: 70033198 | Our Ref No.: 70033198-TAA                                          January 2021
Worthing Borough Council                                                                   Page 22 of 24
The results of the operational assessment illustrate that this mitigation strategy has the potential to
return the junction to a level of performance that is an improvement to or consistent with Do
Minimum conditions.
Although the focus of the mitigation strategy is to promote sustainable travel outcomes, the potential
for improvements to the highway layout at Offington Corner have also been considered through a
process of engagement with Highways England.
The junction is a compact 5-arm roundabout and can be considered unconventional in the context of
typical strategic road network junction layouts. The layout reflects the urban nature of the location
and the land use constraints in the immediate vicinity of the junction. It has been established that the
existing layout does not meet current Design Manual for Roads and Bridges (DMRB) guidance
‘Geometric design of roundabouts’ (CD 116) including in the following aspects:
Width of circulating carriageway between 1 to 1.2x maximum entry width (section 3.6)
Lane widths min 3m max 4.5m, 4.5m is appropriate at single lane entry and 3 – 3.5m is
appropriate at multi-lane entry (section 3.14)
Entry path radius for normal roundabout not to exceed 100m for a 25m long curve in proximity to
the give way line (section 3.26)
Exit kerb radii should exceed the largest entry kerb radius (section 3.29)
Exit kerb radius in the range of 20m – 100m for normal roundabout, 40m is desirable (section
3.29.3)
Concept design studies have established that whilst it is possible to improve the layout such that it
meets some of the design standards, it is not possible to achieve a junction that is fully compliant
with CD 116 while achieving an improved level of junction capacity. Furthermore, the continued
commitment to improving this section of the A27 through Worthing as part of RIS2 may result in any
intermediate junction improvement being both abortive and unnecessary.
A mitigation strategy that focuses upon the reduction of private car trips is consistent with policy and
guidance and has been shown in the conservative operational analysis in Tables 1-18 and 1-19 to
be an effective approach. Such an approach would be accompanied by site-specific monitoring to
ensure that practical reductions in the level of trip-making are achieved through investment in these
measures.
1.6 SUMMARY AND CONCLUSION
The WLP Transport Assessment (August 2018) demonstrated that the proposed Local Plan sites
would not have any significant impact on the performance of the SRN. The land use development
proposed as part of the Worthing Local Plan is, overall, relatively modest due to constraints relating
to the extent of the Borough, the existing urban area and environmental constraints in the north of
the Borough.
This transport assessment addendum has provided supplementary information to address points
raised by Highways England in relation to the suitability of the traffic model, the impact upon the
strategic road network and the mitigation strategy.
Further information has been provided to confirm that the traffic model, which informs the
assessment, provides a satisfactory representation of the existing traffic situation across all peaks.
WORTHING LOCAL PLAN PUBLIC | WSP
Project No.: 70033198 | Our Ref No.: 70033198-TAA January 2021
Worthing Borough Council Page 23 of 24The further analysis has confirmed a very good fit between observed and modelled flow data at peak period and peak hour levels. Furthermore, analysis on traffic routing and journey time also illustrates a good representation of observed conditions. Trip rates and trip distribution have been agreed as suitable for the purposes of the Local Plan assessment. Additional operational assessment of the SRN has been undertaken as part of this addendum, for the A27 / A24 Grove Lodge Roundabout and the A27 / A24 Offington Lane junctions. The forecasting methodology for this assessment addressed one noted limitation within the traffic model flows (see section 1.3.6). The operational assessment for the A27 / A24 Grove Lodge Roundabout demonstrated no significant adverse impact on the performance of the junction. At the A27 / A24 Offington Lane junction, the A24 Warren Road arm is operating over-capacity in the forecast Do Minimum scenario and this performance is exacerbated with additional Local Plan traffic, with forecast queuing levels doubling, but not extending back to the A27 / Grove Lodge Roundabout. Concept design studies have established that whilst it is possible to improve the A27 / A24 Offington Lane junction layout within existing constraints such that it meets some of the design standards, it is not possible to achieve a junction that is fully compliant with design standards while achieving an improved level of junction capacity. Instead, achieving a relatively modest mode shift target that is proportionate to the Local Plan proposals and with the benefits of other sustainable travel investment, a level of performance that is close to or better than conditions without the Local Plan sites can be achieved. A mitigation package and strategy has been proposed that is considered to provide a sufficient and proportionate framework for addressing any individual and cumulative impacts of development on the transport network. The mitigation strategy is consistent with policy and would avoid potentially abortive and unnecessary works to the SRN. WORTHING LOCAL PLAN PUBLIC | WSP Project No.: 70033198 | Our Ref No.: 70033198-TAA January 2021 Worthing Borough Council Page 24 of 24
2 London Square
Cross Lanes
Guildford, Surrey
GU1 1UN

wsp.com

                    PUBLIC
You can also read