NATIONAL ROADS NETWORK INDICATORS 2018 - TRANSPORT INFRASTRUCTURE IRELAND
←
→
Page content transcription
If your browser does not render page correctly, please read the page content below
TRANSPORT INFRASTRUCTURE IRELAND

NATIONAL ROADS NETWORK INDICATORS
2018

April 2019
2

  Transport Infrastructure Ireland
National Roads Network Indicators 2018
KEY TRENDS 3
A: KEY TREND SUMMARY
TRAVEL HOTSPOTS: TRAFFIC GROWTH:
M50 Dublin area: N40 Cork area:
Border
145,000 vehicles per day 85,000 vehicles per day 1%
Hotspot: Hotspot:
0.4% Midlands
West
2.1%
-1.1% 0.6%
Dublin
0.1% 0.5%
+0.5% 0.5% 0.4%
Mid-East
Mid-West 0.6%
2.4% Traffic Growth
0.0%
South-East across the network 0%
0.5% in 2018 was 0.5%. All Motorways National National
National Primary Secondary
South-West
-0.4% Roads Roads Roads
M50 KEY NETWORK STATISTICS CHANGES IN PEAK HOUR SPREAD M50:
The peak hours remain the SHARE OF DAILY TRAFFIC 2017 2018
13,345 1.52 billion
10%
same as 2018: 6.30 - 9.30
and 15.30 - 18.30, with peak AM PM 9%
Traffic
Traffic
Highest hourly flow Vehicle km travelled. spreading occurring resulting
recorded on the N3 - N4 This represents a 1% in an increased share of trips
of Total
8%
between 4pm and 5pm on increase on 2017 2018
Shareof
between 6.00 and 8.00 in the 2017
28th March
Share
7%
morning and a slight increase 2016
Percentage
2015
between 15.00 and 16.00 in 2014
6%
Percentage
the evening. This was a result
178,770 1,164
2013
of continued growth on the
5%
May National Roads network and
18 Highest Daily Flow
Recorded between the
Total No. of Incidents traffic demand reaching
previously unreached levels
4%
6 7 8 9 10 11 12 13 14 15 16 17 18 19
N3-N4 6 7 8 15 16 17
especially on the M50. Hour Beginning
Hour Beginning
FATAL COLLISIONS ON THE NATIONAL ROADS NETWORK 2014 - 2018 TOTAL FATALITIES ON THE NATIONAL ROADS NETWORK IN 2018
29 2 4 0 17
2014–2018 Drivers Passengers Motorcyclists Cyclists Pedestrians
Total fatal collisions on National Roads:
-24% 1 1 3 6
7
3
2014 2015 2016 2017 2018
66 61 72 46 50 19
2 8
2 0
Motorway National Primary National Secondary
Transport Infrastructure Ireland
National Roads Network Indicators 2018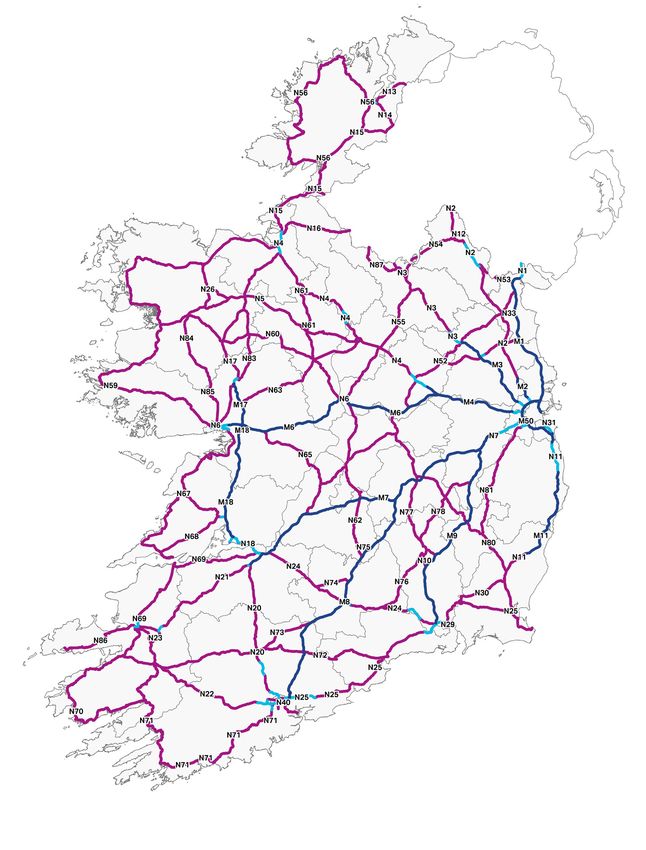
NEWS                                                                                                                                                                                  4

B: NEWS & INFORMATION

News                                                                                              Information
Traffic Indices                                  The traffic indices are produced on a            Traffic Monitoring Units
The TII Traffic Indices represent a measure      quarterly basis and annual growth rates can      TII now has over 370 Traffic Monitoring Units
of global traffic demand over time for a         also be output. The base for the TII Traffic     around the country which are used to
particular grouping of traffic monitoring        Indices is Q3 2013. The Traffic Indices can be   monitor traffic patterns and to plan future
units (TMUs) on the National Roads               found at indices.tii.ie                          interventions. A programme of work to
Network. An index is a statistical measure                                                        deliver a further 30 sites was ongoing in
of changes in a representative group of          National Transport Model (NTpM)                  2018 with data from these sites going live in
individual data points over a time period.       Since its release in 2013 the NTpM is            Q2 2019.
                                                 updated annually using data from the             See website: www.nratrafficdata.ie
TII Traffic Indices for all traffic and HGVs     Traffic Monitoring Unit network. An updated
only are available nationally, by region, by     version of the NTpM representing 2016            Motorway Service Helpline
road type, by TEN-T network status and for       traffic patterns and demand is due for           A Motorway Service Helpline has been
certain corridors of interest. This allows for   release in Q2 2019. The updated model            set-up to assist roads users in difficulty
broad estimates in traffic growth trends on      has been used in the production of these         on a Motorway. All calls are directed
a national or regional basis and on the basis    2018 Network Indicators. Documentation           through the Motorway Traffic Control
of road type, route corridor and vehicle type.   regarding the National Transport Model can       Centre (MTCC) and the number is:
                                                 be located on the TII website at www.tii.ie/
                                                 tii-library/strategic-planning/                           0818-715-100 or;
                                                                                                           operator@nraits.ie

                                                                                                  Further information and live traffic updates
                                                                                                  are available on www.tiitraffic.ie

                                                                                                                                                    Transport Infrastructure Ireland
                                                                                                                                                  National Roads Network Indicators 2018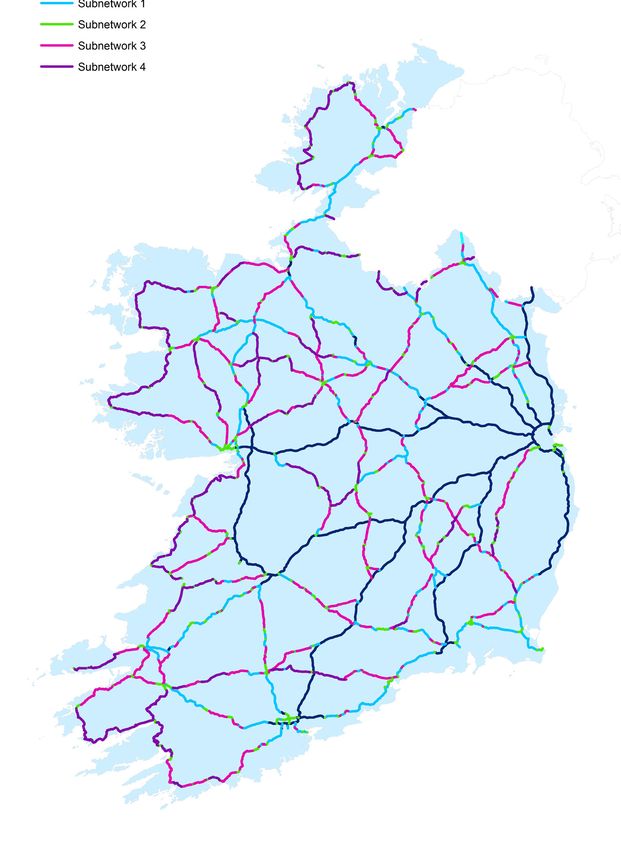
CONTENTS
   INTRODUCTION			 P6
   1. ROAD NETWORK			                  P7
   2. ECONOMIC			                      P25
   3. ROAD CONDITION			                P27
   4. SAFETY			                        P34
   5. ACCESSIBILITY + ENVIRONMENT			   P38

                                               Transport Infrastructure Ireland
                                             National Roads Network Indicators 2018
6

INTRODUCTION
   Transport Infrastructure Ireland’s mission is to deliver transport
   infrastructure and services that contribute to the quality of life of
   the people of Ireland and support the country’s economic growth
   For this purpose, TII has overall              reductions in the cost of operating vehicles.   Transport Infrastructure Ireland considers it
   responsibility not only for the planning       Society as a whole benefits from increased      important to monitor the performance and
   and supervision of the construction and        economic productivity, reduced energy           use of the National Roads network and to
   maintenance works on these roads, but          consumption and a better environment.           share this information with the public.
   also for ensuring the efficient use and safe
   operation of the National Roads network.
                                                  If the National Roads network is operated       This publication sets out some key
                                                  to a high standard, then road users will        indicators of performance and usage of the
   Efficient use of the National Roads network    enjoy safe journeys with predictable journey    National Roads network.
   provides benefits to road passengers and       times.
   road freight users in the form of shorter
   journey times, reduced congestion and

                                                                                                                                               Transport Infrastructure Ireland
                                                                                                                                            National Roads Network Indicators 2018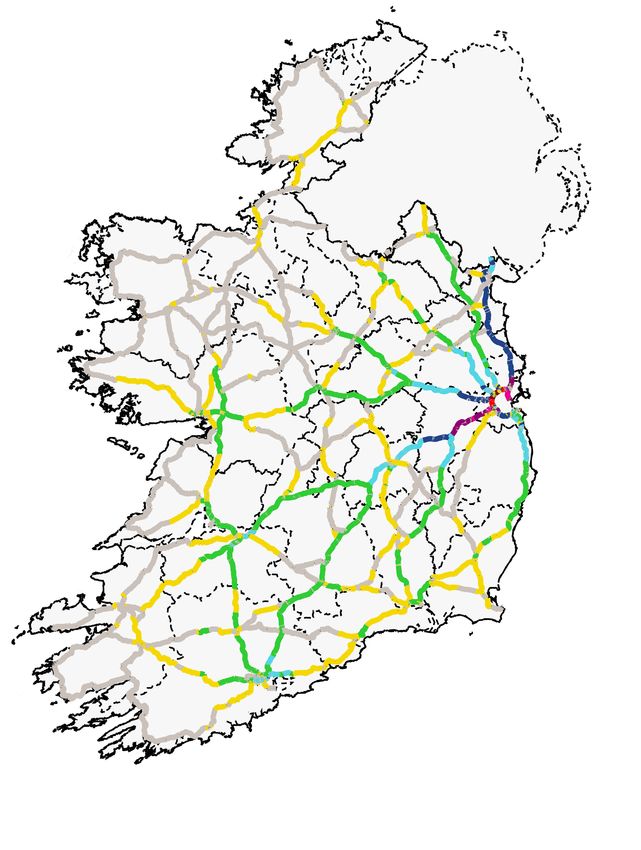
ONE: ROAD NETWORK
ONE | ROAD NETWORK                                                                                                 8

A: LENGTH OF NATIONAL ROADS NETWORK
Length of National Roads network by road
type 2018

There are in excess of
5,300 kilometres of
National Roads network
in Ireland.
The National Roads network is comprised   Road type:
of 969 km of motorway, 301km of dual
                                                  Motorway           969km
carriageway and 4,062km of single
                                           Dual carriageway          301km
carriageway.
                                          Single carriageway         4,062km
The actual length of the National Roads
network fluctuates year on year due to
road reclassification, realignments to
existing National Roads, completion of
new roads and analysis/updating of data                        18%
in the TII Roads Database.
                                                                     6%

                                                        76%

                                                                                 Transport Infrastructure Ireland
                                                                               National Roads Network Indicators 2018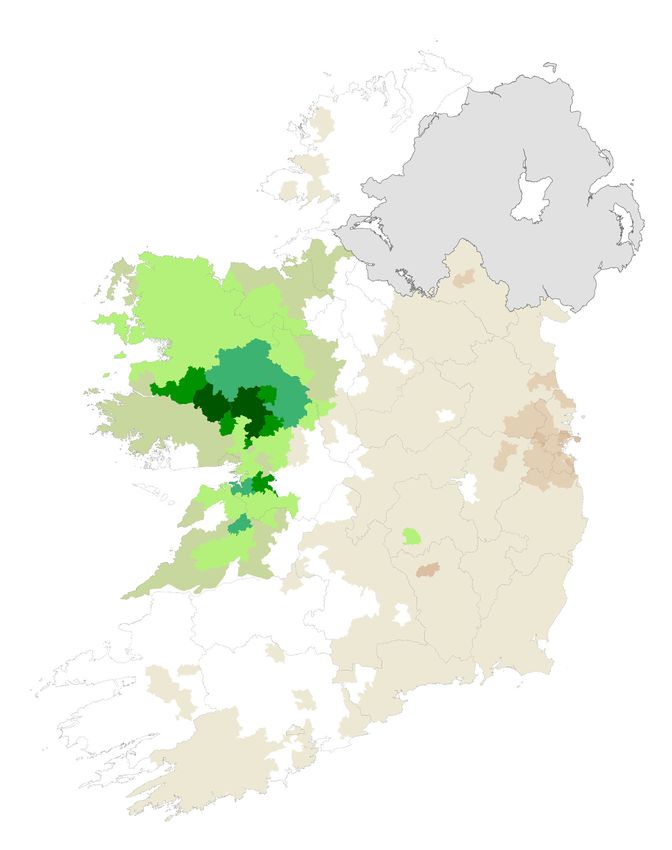
ONE | ROAD NETWORK                                                                                                            9

B1: LEVEL OF USAGE OF THE NATIONAL ROADS NETWORK
Level of usage of the National Roads network as measured by
Annual Average Daily Traffic (AADT)

The continued growth in the                                               M1
                                                                         M1
Irish economy is reflected
by the growth in traffic
on the National Roads
network.
                                                                               AADT M50
In Dublin, the M50 continues to experience
growth in levels of usage as measured by
                                                                                 N11
Annual Average Daily Traffic (AADT) flows,                                      M11
with the section between Junction 5 (N2)
and Junction 9 (N7) carrying in excess of
140,000 AADT. Increased economic activity
outside of the Dublin region is also apparent
with further AADT growth being experienced
on the N40 (Cork South Ring Road) in 2018.

AADT (thousands per day)

        1–5                       17–25      75–100                 M8

        5–10                      25–50      100–125

                                                       N40
        10–17                     50–75      125-150

                                                             AADT Cork

                                                                                            Transport Infrastructure Ireland
Source: TII National Transport Model, 2018                                                National Roads Network Indicators 2018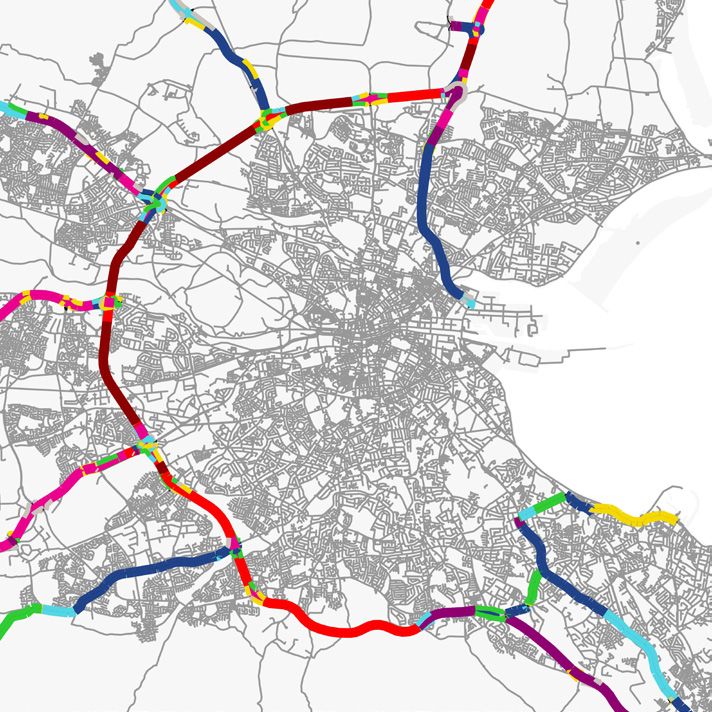
ONE | ROAD NETWORK 10
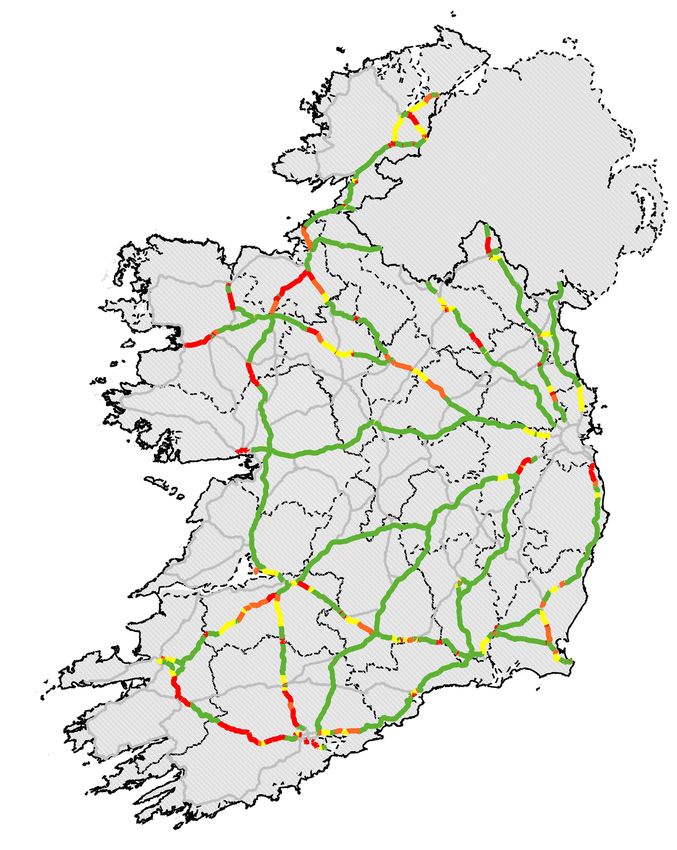
B2: FREIGHT MOVEMENTS ON THE NATIONAL ROADS
NETWORK
Level of usage of the National Roads network by freight
vehicles as measured by Heavy Goods Vehicle (HGV) AADT
The level of usage of the
National Roads network
by freight vehicles, as M1
measured by Heavy Goods
Vehicles (HGV) AADT,
continues to experience
growth particularly in AADT M50
economic centres near M11
major ports.
HGV AADT (thousands per day)
0-0.5 2-3 7-9
0.5-1 3-5 9-11
N8
1-2 5-7 11-13
N40
AADT Cork
Source: TII National Transport Model, 2018 Transport Infrastructure Ireland
National Roads Network Indicators 2018ONE | ROAD NETWORK 11
C1: LEVEL OF SERVICE:
MORNING RUSH-HOUR, NATIONAL ROADS
Proportion of the National Roads network
operating under each level of service condition
50%
The level of service (LOS) provided by 40% 60%
roads may be assessed using recognised 30% 70%
international standards. LOS is a quality All Roads
measure describing operational conditions 20% 80%
within a traffic stream. Following the 10% 90%
substantial investment in National Roads 0%
in recent times, most route sections are
operating to the highest standard of service.
For further information see: Transport
Research and Information Note: A Study of
Lane Capacity, online at www.tii.ie/tii-library/ 50%
40% 60%
strategic-planning
30%
National 70%
Primary
20%
Roads 80%
10% 90%
0%
A. Free flow
B. Reasonably free flow
50%
40% 60%
C. Stable flow
30%
National 70%
D. Approaching unstable flow Secondary
20% Roads 80%
E. Unstable flow 10% 90%
0%
F. Forced or breakdown flow
Source: TII National Transport Model, 2018 Transport Infrastructure Ireland
National Roads Network Indicators 2018ONE | ROAD NETWORK 12
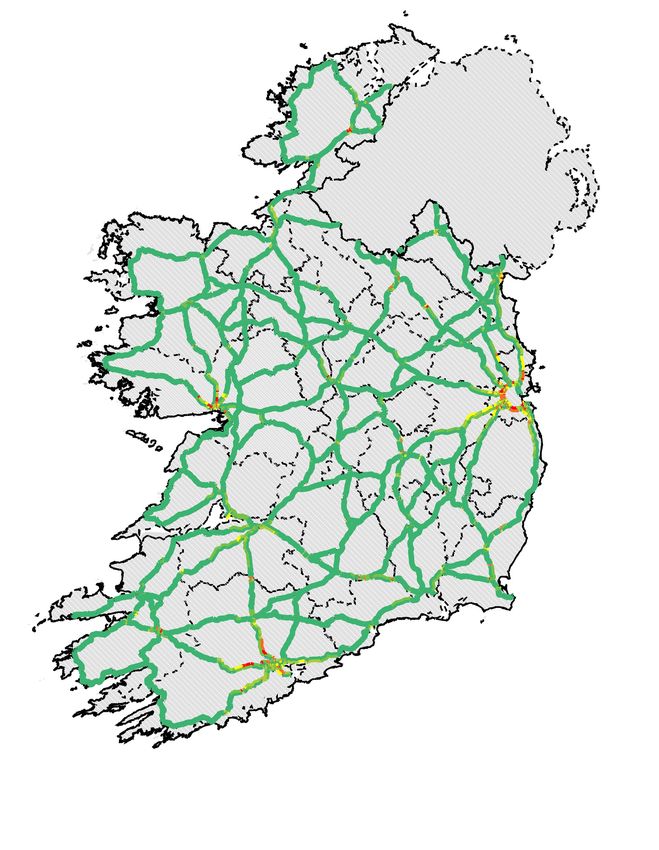
C2: VOLUME TO CAPACITY RATIO:
NATIONAL PRIMARY ROADS
Proportion of the National Primary Roads
network operating at each level of capacity
The Volume to Capacity (V/C) Ratio relates the
AADT volume carried on a section of road to its
daily operational capacity.
The V/C Ratio for the National Primary Roads
network indicates that over 70% of the
network is operating at or below 80% of its
daily capacity. This reflects the significant
investment made in the National Primary
Roads network in recent times.
50%
40% 60%
*Capacity based on TII Rural Road Link Design 30%
National 70%
Standard Table 6.1 (DN-GEO-03031) Primary
20%
Roads 80%
10% 90%
0%
Operating Below 80% Capacity
Operating between 80% - 100% Capacity
Operating between 100% - 120% Capacity
Operating above 120% Capacity
Source: TII National Transport Model, 2018 Transport Infrastructure Ireland
National Roads Network Indicators 2018ONE | ROAD NETWORK 13
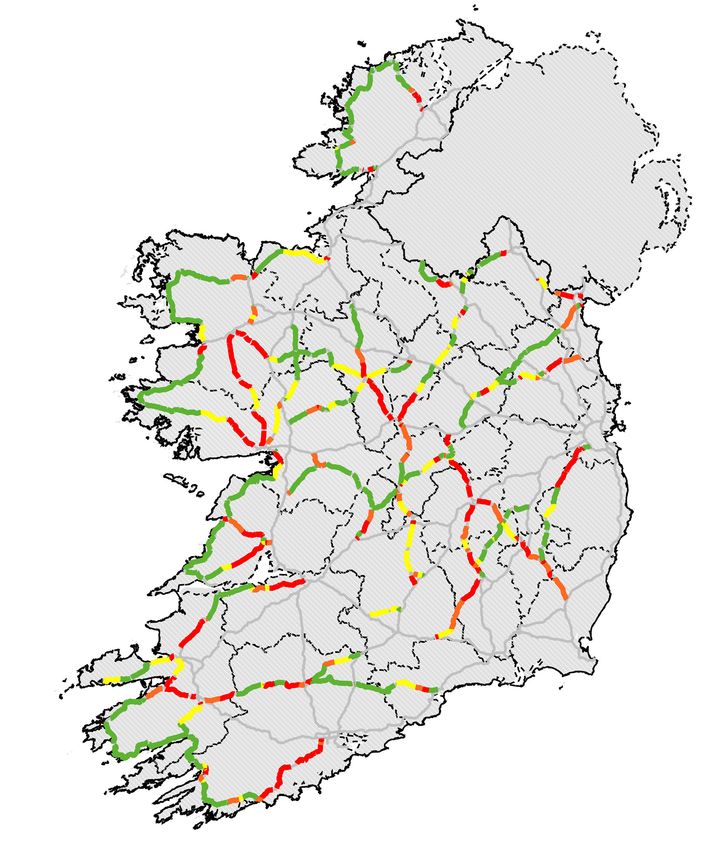
C3: VOLUME TO CAPACITY RATIO:
NATIONAL SECONDARY ROADS
Proportion of the National Secondary Roads
network operating at each level of capacity
The Volume to Capacity (V/C) Ratio relates the
AADT volume carried on a section of road to its
daily operational capacity.
The V/C Ratio for the National Secondary
Roads network indicates that just under
50% of the network is operating at or below
80% of its daily capacity. This indicates
that investment is required in the National
Secondary Roads network to match the
performance of the National Primary Roads 50%
40% 60%
network.
30%
National 70%
Secondary
*Capacity based on TII Rural Road Link Design 20%
Roads 80%
Standard Table 6.1 (DN-GEO-03031) 10% 90%
0%
Operating Below 80% Capacity
Operating between 80% - 100% Capacity
Operating between 100% - 120% Capacity
Operating above 120% Capacity
Source: TII National Transport Model, 2018 Transport Infrastructure Ireland
National Roads Network Indicators 2018ONE | ROAD NETWORK 14
D1: M50 PERFORMANCE SUMMARY
2018 Key network statistics
The M50 is the most heavily trafficked road in
the country with nearly 145,000 vehicles using
several sections on an average day.
13,345 1.52 billion
N3 N2 M1
UN
50
YM
M
LL
146,500
1/
137,750 122,250
BA
M
Highest hourly flow recorded on Vehicle km travelled. 7.5% 5
7.6% 4
8.3% 3
6
the N3 - N4 between 4pm and This represents a 1%
5pm on 28th March 82,250
increase on 2017 144,500 9.3%
7.8%
2
178,770 1,164
K
N4
OC
7
23,000
OL
CO
May 144,750 40.7%
18 Highest Daily Flow Recorded Total No. of Incidents 7.1%
RT
1
of which 541 were
PO
on M50 between the N3-N4 N7 9
IN
BL
NT
Traffic Collisions
DU
132,250
OU
FRIDAY
YM
3.8%
)
M11
LL
31
13 minutes
S
BA
(N
D
E
10
OO
IN
R
D
EE
OR
KM
SE
W
T
Busiest Typical Day
YF
RY
OU
IC
121,250
IN
ND
ER
RR
LL
RH
Average Response Time
CH
SA
BA
CA
3.2%
FI
11 12 13 14 15 16 17
2.9% 3.2% 3.5% 3.3% 3.1% 3.5%
16:00 -18:00 30 minutes 113,000 107,250 75,250 72,750 69,250 49,750
N81 N31 M11
Peak Incident Time Median Duration of
Incidents M50 Schematic Layout
2018 Annual Average Daily Traffic (%HGV) on M50
Transport Infrastructure Ireland
National Roads Network Indicators 2018ONE | ROAD NETWORK 15
D2: M50 PERFORMANCE SUMMARY
Traffic growth and typical working day conditions
represented by level of service
MADT at M50 (e-flow toll between J6 & J7)
160,000
Monthly Average Daily Traffic
The level of service (LOS) provided by 150,000
roads may be assessed using recognised
international standards. LOS is a 140,000
quality measure describing operational
(VEHS)
conditions within a traffic stream. 130,000
Average hourly levels of service for the
full year were analysed from TII Traffic 120,000
Monitoring Units which give an indication
of what the busiest times of a typical 110,000
day were, and what sections of the M50
were most congested in 2018. A typical 100,000
working day in 2018 refers to all weekdays
Jan
Mar
May
Jul
Sep
Nov
Jan
Mar
May
Jul
Sep
Nov
Jan
Mar
May
Jul
Sep
Nov
Jan
Mar
May
Jul
Sep
Nov
Jan
Mar
May
Jul
Sep
Nov
Mar
May
Jul
Sep
Nov
excluding school holidays and public
holidays. 2013 2014 2015 2016 2017 2018
J2-M1 J2-M1
N2-J4 N2-J4
N3-N2 N3-N2
N4-N3 N4-N3
N7-N4 N7-N4
Southbound
Northbound
N7-J10 N7-J10
A. Free flow
J10-N81 J10-N81
B. Reasonably free flow N81-J12 N81-J12
J12-J13 J12-J13
C. Stable flow
J13-J14 J13-J14
D. Approaching unstable flow J14-J15 J14-J15
J15-J16 J15-J16
E. Unstable flow J16-J17
J16-J17
6 7 8 9 10 11 12 13 14 15 16 17 18 19 20 6 7 8 9 10 11 12 13 14 15 16 17 18 19 20
F. Forced or breakdown flow Hour of Day
Hour of Day
Transport Infrastructure Ireland
National Roads Network Indicators 2018ONE | ROAD NETWORK 16
D3: N40 PERFORMANCE SUMMARY
2018 Key network statistics
Several sections of the N40 Cork Southern
Ring Road carry in excess of 80,000
vehicles on an average day
8,889 10 minutes 113
Highest hourly flow recorded Average Response Time Total No. of Incidents
on the Kinsale Rd - Douglas of which 34 were
section between 08:00 and Traffic Collisions
09:00 on 7th March
M8
103,812 0.34 Billion
E
TL
DEC
ET
20
NK
Highest Daily Flow Recorded Vehicle km travelled.
DU
on the Kinsale Rd - Douglas This represents a 3.1% N8 11 N25
section on 20th December increase on 2017
JACK LYNCH
FRIDAY TUNNEL
12
Busiest Typical Day
N22 N27 4.5%
67,250
T
ST
09:00 -10:00
ES
RD
D
EA
N
ON /
RD
W
RD
AV R A
EL
D
EE
E
EL
S
S
FI
UL INO
E
ON
AH
LA
LA
ER
ON
FI
AL
M
UG
UG
ND
RS
RR
GH
OO
P O LL
NS
AH
BA
DO
DO
SA
CU
BA
BL
TO
KI
M
Peak Incident Time
1 2 3 4 5 6 7 8 9 10
3.2% 3.0% 4.0%
42,000 86,000 71,250
30 minutes N71 N27 N28
Median Duration of N40 Schematic Layout
Incidents 2018 Annual Average Daily Traffic (%HGV) on N40
Transport Infrastructure Ireland
National Roads Network Indicators 2018ONE | ROAD NETWORK 17
D4: N40 OPERATIONAL PERFORMANCE
Traffic growth and typical working day conditions
represented by level of service
The level of service (LOS) provided by roads may be assessed using recognised international standards. Westbound/Southbound
LOS is a quality measure describing operational conditions within a traffic stream.
Jack-Lynch - Mahon
Average hourly levels of service for the full year were analysed from TII Traffic Monitoring Units which
Mahon - Bloomfield
give an indication of what the busiest times of a typical day were, and what sections of the N40 were
most congested in 2018. A typical working day in 2018 refers to all weekdays excluding school holidays Kinsale Rd - Douglas
and public holidays.
Ballinora - Curraheen
6 7 8 9 10 11 12 13 14 15 16 17 18 19 20
Hour of Day
MADT at N40 Jack Lynch Tunnel
75,000
Eastbound/Northbound
Jack-Lynch - Mahon
Monthly Average Daily Traffic (VEHS)
70,000 Mahon - Bloomfield
Kinsale Rd - Douglas
Ballinora - Curraheen
65,000
6 7 8 9 10 11 12 13 14 15 16 17 18 19 20
Hour of Day
60,000 Level of Service
A. Free flow D. Approaching unstable flow
55,000 B. Reasonably free flow E. Unstable flow
C. Stable flow F. Forced or breakdown flow
50,000
Jan
Mar
May
Jul
Sep
Nov
Jan
Mar
May
Jul
Sep
Nov
Jan
Mar
May
Jul
Sep
Nov
Jan
Mar
May
Jul
Sep
Nov
Mar
May
Jul
Sep
Nov
2014 2015 2016 2017 2018
Month
Transport Infrastructure Ireland
National Roads Network Indicators 2018ONE | ROAD NETWORK 18
D5: DUBLIN RADIALS PERFORMANCE SUMMARY
Traffic growth and typical working day conditions
represented by level of service
M3 N2 M1
M1
INNER
INNERCORDON
CORDON XX 16,000
16,000
8.3%
8.3%
The Dublin Radials represent a system of
OUTERCORDON
OUTER CORDON
XX 20,000
20,000
60,250
60,250
6.7%
6.7%
routes providing access to the Dublin Area, 9.2%
9.2%
ASHBOURNE
ASHBOURNE
converging onto the M50. They are made of
National Primary Routes designated M1 to DUNSHAUGHLIN
DUNSHAUGHLIN 66
M11 as one travels anticlockwise around the
M50. 44 DONABATE
The Dublin Radial Routes consisting of the COLDWINTERS
COLDWINTERS
M1, N2, N3, M4, N7, N81 and M11 are some 77,000
77,000
22 38,500
38,500
AIRPORT
AIRPORT
of the busiest routes in the country. The
3.8%
3.8% 10.3%
10.3% 22 135,500
135,500
schematic on the right contains AADT data M4
M4
11 1 5.1%
5.1%
of these routes for 2018 from the Traffic
45,500
45,500
8.6%
8.6%
BLANCHARDSTOWN
BLANCHARDSTOWN 3
3
Monitoring Units which are displayed as MAYNOOTH
MAYNOOTH
103,250
103,250
4.1%
4.1%
11
inner and outer cordons on the map of the
Greater Dublin Area. Generally there is a
77 22 11
very significant drop off in traffic demand LIFFEY VALLEY
between the inner and outer cordons as 99,250
99,250
you would expect as the population and job 2.5%
2.5%
1A
1A
11
densities decrease. NEWLANDS
NEWLANDS
The N7 shows significant traffic demand TALLAGHT
TALLAGHT
at the outer cordon. Traffic demand at the 81,250
81,250 M50
M50
7.8%
7.8% 29,750
29,750
M1,M4 and N11 outer cordon locations 77 KILL
KILL
2.0%
2.0%
is lower than the N7 but still remains
reasonably high. 11 77,500
77,550
2.5%
2.5%
44 BRAY
120,556 159,916 BRAYNORTH
NORTH
May Jun
25
Highest Daily Flow
Recorded on the M4 15
Highest Daily Flow
Recorded on the M1
BLESSINGTON
BLESSINGTON
88 KILMACANOGUE
KILMACANOGUE
between the M50 between the M50 and M7
M7
andLiffey Valley Dublin Airport
11,750
11,750 51,750
51,750
5.8%
5.8% 3.1%
3.1%
124,335 92,242 M9 N81
N81 N11
N11
Mar May
29 Highest Daily Flow
Recorded on the N7
25 Highest Daily Flow
Recorded on the M11 Dublin Radials Schematic Layout
between the M50 between the M50 and
and Newlands Bray North
2018 Annual Average Daily Traffic (%HGV) on Dublin Radials
Transport Infrastructure Ireland
National Roads Network Indicators 2018ONE | ROAD NETWORK 19
D6: DUBLIN RADIALS PERFORMANCE SUMMARY 120
Quarterly Traffic Profile of Dublin Radials*
Traffic growth and typical working day conditions
represented by level of service
Traffic Volume Index (Q3 2013
115
110
105
The level of service (LOS) provided day in 2018 refers to all weekdays
by roads may be assessed using excluding school holidays and public
recognised international standards. holidays. 100
LOS is a quality measure describing
The LOS figures show congestion
operational conditions within a traffic
occuring at inner cordon locations 95
stream.
during the peak periods. Congestion at
Average hourly levels of service for the outer cordon location is limited to
the full year were analysed from TII the evening peak at specific locations 90 2013 2013 2014 2014 2014 2014 2015 2015 2015 2015 2016 2014 2016 2016 2017 2017 2017 2017 2018 2018 2018 2018
Traffic Monitoring Units which give an where TII currently have schemes at the Q3 Q4 Q1 Q2 Q3 Q4 Q1 Q2 Q3 Q4 Q1 Q2 Q3 Q4 Q1 Q2 Q3 Q4 Q1 Q2 Q3 Q4
indication of what the busiest times of construction/design stage. *These values represent an index baseline at 100 in Q3 2013. An index is a statistical measure of changes
a typical day were, and what sections in a representative group of individual data points over a time period.
of the Dublin radial routes were most
Towards M50 From M50
congested in 2018. A typical working
M1-M50 to Airport
M2-M50 to Coldwinters
N3-M50 Blanchardstown to Clonsilla
N4-M50 to Liffey Valley
N7-M50 to Newlands
N81-M50 to Tallaght
N11-M50 to Bray North
A. Free flow 6 7 8 9 10 11 12 13 14 15 16 17 18 19 20 6 7 8 9 10 11 12 13 14 15 16 17 18 19 20
M1- Donabate to Balbriggan
B. Reasonably free flow 8 8
N2- Ashbourne to Slane
C. Stable flow M4- Maynooth to Kilcock
N7- Kill to Johnstown
D. Approaching unstable flow
N81- Tallaght to Blessington
E. Unstable flow N11- Kilmacanogue to Glen of
the Downs 6 7 8 9 10 11 12 13 14 15 16 17 18 19 6 7 8 9 10 11 12 13 14 15 16 17 18 19 20
F. Forced or breakdown flow Hour of Day Hour of Day
8 8
Transport Infrastructure Ireland
National Roads Network Indicators 2018ONE | ROAD NETWORK 20
E: ROADS USAGE OVER THE DAY
Profile of the usage of the National
Roads network by time of day
Nat Primary Peak Nat Primary Peak
The peak periods on M50 Peak M50 Peak
our National Roads are Nat Secondary Peak Nat Secondary Peak
extending outwards due
10%
to increased demand and
congestion. 9%
In the morning, the peak period lasts
Percentage share of total daily traffic
8%
between 6.30am and 9.30am whilst in in
the evening, the peak covers the period
7%
between 3:30pm and 6:30pm. Peak traffic
hours have a level of traffic some 30% to
50% above off-peak levels. The M50 is 6%
the most used road in the country with
daily weekday traffic of up to 146,000 5%
along its busiest sections. The peaks on
the M50 are more prolonged than other 4%
roads with significant traffic flows being
maintained during off-peak periods. The 3%
trend of ‘peak hour spreading’ continued
in 2018, with the peak period share of
2%
total daily M50 traffic reducing by 0.4% in
both the AM and PM Peaks compared to
1%
the previous year.
M50 Motorway 0%
National Primary 0 1 2 3 4 5 6 7 8 9 10 11 12 13 14 15 16 17 18 19 20 21 22 23 24
National Secondary
Peak period Hour Beginning Peak period
Peak period (6.30am - 9.30am) (3.30pm - 6.30pm)
Source: TII National Transport Model, 2018 Transport Infrastructure Ireland
National Roads Network Indicators 2018ONE | ROAD NETWORK 21
F: TRIP DURATION
NATIONAL ROADS AND REGIONAL ROADS - AM PEAK
Profile of the trips made on the National and Regional
Roads network by their duration
Across the road 25%
network, a significant
portion of trips that
39%
20%
people make are of
Percentage share of total trips
short duration. In total, greater
less than or
39% of trips are of 15 15% equal to 15 than 15
minutes duration or minutes minutes
less.
10%
61%
5%
0%
5
10
5
0
5
0
5
0
5
0
5
0
5
0
5
80
5
0
5
00
-1
-2
-7
-7
0-
-2
-3
-3
-8
-5
-9
-6
-4
-5
-6
-9
-4
5-
-1
-
10
65
70
15
20
25
30
45
50
75
90
80
85
55
60
35
40
95
Trip Length (minutes)
average trip duration = 22mins
light vehicles
Source: TII National Transport Model, 2018 Transport Infrastructure Ireland
National Roads Network Indicators 2018ONE | ROAD NETWORK 22
G: TRIP DISTANCE
NATIONAL AND REGIONAL ROADS - AM PEAK
Profile of the trips made on the National and
Regional Roads network by their distance
Across the road 25%
network, a significant
portion of trips that 40% 60%
20%
people make are short
Percentage share of total trips
distance. In total, just
over 52% of trips are 15 15%
0–10km 10km +
kilometres or less.
10%
5%
0%
5
10
5
0
5
0
5
0
5
0
5
0
5
0
5
80
5
0
5
00
-1
-2
-7
-7
0-
-2
-3
-3
-8
-5
-9
-6
-4
-5
-6
-9
-4
5-
-1
-
10
65
70
15
20
25
30
45
50
75
90
80
85
55
60
35
40
95
Trip Distance (km)
average trip distance = 21.7km
light vehicles
Source: TII National Transport Model, 2018 Transport Infrastructure Ireland
National Roads Network Indicators 2018ONE | ROAD NETWORK 23
H: ANNUAL TRAFFIC GROWTH RATES
Annual Traffic Growth 2017-2018
Growth by Region
All Vehicles
HGV
Traffic growth was 0.5% Growth by Road Type
(All Vehicles)
across the network in 2018.
Weather had a significant impact on year
and year growth in 2018 with significant
weather events i.e. Storm Emma, occurring 0.6%
0.5%
in Q1 2018 which led to limited use of 0.4%
National Roads for extended periods. 0% Border 0.4%
3.4%
The highest regional growth recorded in All National Motorways National National
2018 was in the Mid-West with 2.4% for Roads Primary Roads Secondary Roads West -1.1%
the year. The Midlands also experienced -1.2%
Dublin 0.1%
significant growth at 2.1%. The South-West Growth by Road Type 3.2%
Midlands 2.1%
and West experienced negative year on year (HGVs) 3.7%
growth at -0.4% and -1.1% respectively. Mid-East 0.6%
3.6%
For HGVs the Midlands and Mid-East Mid-West 2.4%
2.6%
recorded the highest regional growth at 2.4% -0.8%
2.3%
3.7% and 3.6% each. The West and Mid- 2.1%
West had negative year on year growth at South-East 0.5%
3.0%
-1.2% and -0.8% respectively. The lower
growth in 2018 can be partially attributed to
South-West -0.4%
extreme weather events in early 2018. 1.9%
The greatest year on year traffic growth for
all vehicles by road type was recorded on
motorways; where traffic has increased All National Motorways National National
0.6%. For HGVs however, the greatest Roads Primary Roads Secondary Roads
growth by road type was on National
Primary Roads with 2.6% for HGVs.
Source: TII Traffic Monitoring Units
Transport Infrastructure Ireland
National Roads Network Indicators 2018ONE | ROAD NETWORK 24
I: NETWORK MANAGEMENT
Overview of the responsibilities for
the Management of the National
Roads network
The management of the National Key facts:
Roads network is assigned to a
number of bodies with the majority 0o C
share of National Primary and
National Secondary roads being
managed by Local Authorities. 327 9,430 103
Motorways are managed under demountable all emergency nights in 2018
the Motorway Maintenance and snow ploughs calls received by where the
Motorway Traffic temperature
Renewal Contracts (MMaRCs) or Control Centre reached below
Our winter service
by PPP Concession companies. TII fleet consists of: including SOS zero
phones
manages the maintenance of 2,709
bridges, which includes all bridges
on National Roads other than on PPP
roads. PPP Consession companies
manage a total of 472 bridges.
360 1,478 110
salt spreaders SOS phones weather stations
in the in operation on the
country National Roads
Network
Routes managed by:
MMaRC
PPP 58,179
Local Authority tonnes of salt were
used on National Roads
Network in 2018
Transport Infrastructure Ireland
National Roads Network Indicators 2018TWO: ECONOMIC
TWO | ECONOMIC 26
A: ECONOMICS TRENDS AND TRANSPORT
Recent Trends
In the period up to the peak of the broad distinction may be made between Annual Growth Rate (%) Annual Growth Rate (%)
economic boom in 2008, vehicle All Traffic HGV Traffic
commuting and non-commuting. Trends
kilometres of travel on all roads grew in overall employment in the economy
at an annual average rate of 4.6% per drive commuting traffic and personal
annum. In aggregate, vehicle kilometres incomes are the major determinant of Annual Growth Rate (%) All National Route Traffic
of travel increased by 43% between 2000 non-commuting traffic. 7%
and 2008. With regard to the carriage of goods, 6% 5.9%
When the economic and financial crisis economic output is the major 5%
4.3% 4.2%
occurred, vehicle kilometres of travel in determinant and, particularly, the output 4% 3.9% 3.7%
total declined by 10% and goods traffic of the building and construction sector, 3.1%
3%
by 22%. The greater decline in goods 2.4%
which is very transport intensive. The 2%
traffic reflected in part the near collapse slow initial recovery in the building and 1%
of the building and construction sector. construction sector is the reason why 0.5%
0%
Economic growth began to recover in a goods vehicle traffic is still slightly below
2015 2016 2017 2018
sustained way in 2012 and employment its former peak level. Year
levels a year later. By 2015, total vehicle The annual growth in traffic does not
kilometres of travel had recovered its reflect economic trends due to the
pre-crisis levels. Goods traffic vehicle influence of Storm Emma, it is anticipated
kilometres has still not quite attained its that the rate of growth will be higher in
previous peak levels. 2019 compared to 2018 but that the trend Quarter to Quarter Growth Rates on National Roads (%)
Overall transport demand comprises of reducing rates of growth will continue 7%
both personal travel and carriage of as growth in the economy slows. 6%
goods. With regard to personal travel, a 5%
4.3%
Index of Vehicle Kilometres of Travel, (Year 2000= 100) 4%
3.2%
200.0 3%
2.2% 2.1%
2%
150.0 1.6%
1%
0.3%
Index
100.0 0% -2.1% 0%
-1%
50.0 -2%
-3%
0.0
Quarter 1 Quarter2 Quarter 3 Quarter 4
2000 2001 2002 2003 2004 2005 2006 2007 2008 2009 2010 2011 2012 2013 2014 2015 2016
Total Vehicle Kilometres of Travel All Goods Vehicle Kilometres of Travel Heavy Goods Vehicle Kilometres of Travel 2017 - 2018 2017 - 2018 2017 - 2018 2017 - 2018
Transport Infrastructure Ireland
National Roads Network Indicators 2018THREE: ROAD CONDITION
THREE | ROAD CONDITION                                                                                                                                               28

A1: PAVEMENT MAINTENANCE
Overview of subnetwork
classification of National Roads
network

The National Roads network consists of over                       In order to effectively manage this diverse
5,300 kilometres of road pavements. There                         network, a series of 5 subnetwork types
is a very significant variation across the TII                    have been defined to significantly reduce the
network in terms of pavement construction,                        variation in pavement condition, traffic and
pavement age, carriageway width, lane width,                      construction type within each subnetwork.
geometric design and traffic volumes carried.

  Subnetwork                            Classification                                                             % of Network

  0     Motorways + dual                High speed, high volumes pavement, made up of Motorway and Dual                22%
        carriageways                    Carriageway sections of the network. Much of this subnetwork is less
                                        than 10 years old.

  1     Engineered pavement             Significant geometric and pavement design has taken place in the               22%
                                        construction and/or rehabilitation of the pavement sections. Typically
                                        carry reasonably large volumes of traffic, and are identified by
                                        presence of hard shoulders adjacent to the carriageway.

  2     Urban Areas                     Low to medium speed, typically short sections through towns that are           13%
                                        not bypassed, also includes longer sections within the cities and larger
                                        towns where National Roads start and end.

  3     Legacy pavement –               Legacy subnetwork, typically constructed without formal geometric              24%
        high traffic                    or pavement design. Typically carries traffic volumes less than 10,000
                                        AADT.

  4     Legacy pavement – low           Legacy subnetwork, typically constructed without formal geometric              18%
        traffic                         or pavement design. Typically carries traffic volumes less than 5000
                                        AADT.

Source: TII Pavement Condition Report 2017                                                                                          Transport Infrastructure Ireland
                                                                                                                                  National Roads Network Indicators 2018
THREE | ROAD CONDITION 29
A2: MEASURING PERFORMANCE OF PAVEMENTS
ON NATIONAL ROADS NETWORK
Overview of the strategic indicators used across the
National Roads network pavement sub networks
Road pavement condition is a critical TII has therefore developed strategic level
element in ensuring the safety and performance indicators which address
efficiency of the National Roads three key characteristics – Pavement Pavement Surface Health
network. In order to maintain acceptable Surface Health; Pavement Surface Safety,
performance levels of road pavement Pavement Structural Health.
significant investment is required
annually. Within the pavement sub networks,
pavement condition is ranked on a five
Road pavements are made up of different point scale:
layers. The surface layer is key in the Very Poor, Poor, Fair, Good , Very Good.
road-wheel interface and influences
both the safety and overall condition TII research indicates that on average Pavement Surface Safety
of the pavement. Timely upgrade of it takes approximately 7 years for a
the pavement surface can prolong the pavement to transition between points on
lifecycle of the sub-surface / structural the scale.
layers of the pavement.
To ensure the safety and efficiency of the
Various engineering parameters are used network TII have set performance targets
to measure the performance of aspects for each of the subnetwork categories
of the pavement but these do not give an under each of the performance indicators.
understanding of overall performance of
the pavements on the network. Pavement Structural Health
Transport Infrastructure Ireland
National Roads Network Indicators 2018THREE | ROAD CONDITION 30
B1: CURRENT STATUS OF THE
ROADS PAVEMENT CONDITION
Pavement Surface Health TII target 95% performing fair
or better for all sub-networks
The Engineered pavement subnetworks are
% Performing Fair or Better in 2018
consistently above the target level over the Subnetworks 0-1 Subnetworks 2 Subnetworks 3-4
five year analysis period. The remainder of
Motorways, Dual Urban Areas Legacy pavement
the network is at a higher KPI level than the Carriageways – High and Low
Pavement Structural Health parameter, but and Engineered traffic
Pavement
the rate of improvement in performance is
lower than that seen with Structural Health.
An increased investment in the Legacy
96.1% 85.2% 87.1%
Subnetworks shows an improved upward
trend line.
Trends in Pavement Surface Health KPI
(% Fair or Better)
100%
90%
80%
70%
60%
2014 2015 2016 2017 2018
Target
Source: TII Pavement Condition Report Transport Infrastructure Ireland
National Roads Network Indicators 2018THREE | ROAD CONDITION 31
B2: CURRENT STATUS OF THE
ROADS PAVEMENT CONDITION
Pavement Surface Safety TII target 99% performing fair
or better for all sub-networks
This KPI is derived from network level Skid
% Performing Fair or Better in 2018
Resistance surveys. The target level is Subnetworks 0-1 Subnetworks 2 Subnetworks 3-4
set to have 99% of the network in a safe
Motorways, Dual Urban Areas Legacy pavement
condition based on annual skid resistance Carriageways – High and Low
measurements. This has been consistently and Engineered traffic
Pavement
achieved on the Engineered Subnetworks
(0 and 1) over the 5 year period as seen by
the trend line. The Legacy Subnetworks are
below but close to the target line, the trend
line is generally flat but has improved in 99.7% 92.6% 98.7%
2018. The Urban subnetwork is considerably
below the remainder of the network.
There has been an increased emphasis
on treatment within urban areas in the Trends in Pavement Surface Safety KPI
(% Fair or Better)
past 2 years, and this has produced an
100%
improvement in the KPI level.
90%
80%
70%
60%
2014 2015 2016 2017 2018
Target
Source: TII Pavement Condition Report Transport Infrastructure Ireland
National Roads Network Indicators 2018THREE | ROAD CONDITION 32
B3: CURRENT STATUS OF THE
ROADS PAVEMENT CONDITION
Pavement Structural Health TII target 95% performing fair
or better for all sub-networks
There is a very clear difference between
% Performing Fair or Better in 2018
Subnets 0 and 1 (Engineered Pavements) Subnetworks 0-1 Subnetworks 2 Subnetworks 3-4
and the remainder of the network. Subnet
Motorways, Dual Urban Areas Legacy pavement
0-1 is consistently above the target of 95% Carriageways – High and Low
in Fair or Better condition, reflecting the and Engineered traffic
Pavement
relatively new age profile of the majority
of the road sections in this category.
The Urban subnetwork (Subnet 2) is in
significantly better condition than the
Legacy Subnetworks (subnets 3 and 4). 97.2% 90.8% 80.4%
The 5 year trend lines show an overall
upward trend, reflecting a concentration on
improving the worst-performing sections
over the five year period. Trends in Pavement Structural Health KPI
(% Fair or Better)
100%
90%
80%
70%
60%
2014 2015 2016 2017 2018
Target
Transport Infrastructure Ireland
National Roads Network Indicators 2018THREE | ROAD CONDITION 33
C: NATIONAL ROAD BRIDGE STRUCTURES
Overview of the quantum and condition of bridge
structures on the National Roads network
1400
Bridges are key elements
of the National Roads 1200
system and maintenance
and rehabilitation 1000
of bridges is a key
part of the TII’s asset No. of Bridges 800
management strategy.
The National Roads network includes 600
approximately 2,700 bridge structures
of which 472 are on roads provided by
public private partnerships. 400
Bridges are inspected on a regular cycle.
Bridge components which are allocated
a condition rating of 0 or 1 do not require 200
repair work, whereas those assigned a
rating of 2 or higher are scheduled for
future repair.
0
The amount of bridges in the CR0 and
Condition Rating 2018
CR1 categories has remained constant
CR 0: No or insignificant change.
since 2017
CR 1: Minor Damage but no need of repair. CR 4: Damage is critical, repair at once.
CR 2: Some Damage, repair needed when convienent. CR 5: Ultimate Damage. The component has failed or is in danger of total failure.
CR 3: Significant Damage, repair within next financial year. N/A: Data not available due to access restrictions.
Transport Infrastructure Ireland
National Roads Network Indicators 2018FOUR: SAFETY
FOUR | SAFETY                                                                                                                                                                                                                35

A: FATAL COLLISIONS ON THE
NATIONAL ROADS NETWORK:
Key Statistics* for 2018 are presented. For further details on
road safety and national trends please see www.rsa.ie

 Fatal Collisions                    Fatalities                                                            29                        2                          4                   0                       17
                                                                                                         Drivers                 Passengers                Motorcyclists         Cyclists               Pedestrians

      50                               52
                                                                                                    7                                                     1                  1                     3                     6

                                                                                                                        3

   Head-On                        Non Motorised                  All Other Reported
                                                                                                                        19
 Fatalities - 13                 User Fatalities - 17               Fatalities - 22                                                                 2                        2                 0                             8

                                                                                                             Motorway            National Primary       National Secondary

                                                                       2018 national road fatalities by month
                                                                                     2018 National Roads fatalities by month
     11
     11
     10
     10
      9
      8
      7                                                                                                                                                                                            Secondary
                                                                                                                                                                                                   National Secondary

      6
      5                                                                                                                                                                                            Primary
                                                                                                                                                                                                    National Primary
      4
      3
      22
                                                                                                                                                                                                   Motorway
                                                                                                                                                                                                   Motorway

      11
      00
             January
             January       February         March
                                            March           April          May
                                                                           May            June           July           August
                                                                                                                        August      September
                                                                                                                                    September October
                                                                                                                                              October November
                                                                                                                                                      November December
                                                                                                                                                                December

*Pedestrians on Motorways include individuals who have left their vehicle. All figures shown are provisional and subject to revisions.                                                      Transport Infrastructure Ireland
                                                                                                                                                                                        National Roads Network Indicators 2018
FOUR | SAFETY 36
B: SERIOUS INJURIES ARISNG
FROM COLLISIONS ON THE
NATIONAL ROADS NETWORK 140 56 46 24 22
Key Statistics* for 2018 are presented. For further details on Drivers Passengers Motorcyclists Cyclists Pedestrians
road safety and national trends please see www.rsa.ie 22
1 2 2
19 26 9 10
Serious Injuries
64
288 54 36 18 15 10
Motorway National Primary National Secondary
2018 national road serious injuries by month from K & SI collisions
2018 National Roads serious injuries by month
40
40
35
35
30
30
25
25 Secondary
20
20 National Secondary
Primary
15
15
National Primary
10
10 Motorway
55 Motorway
00
Jan
January Feb
February Mar
March Apr
April May
May Jun
June Jul
July Aug
August Sep
September Oct
October Nov
November Dec
December
*The RSA have noted in their recent reports the increase in reported serious injuries and have said the increase “is attributable in part to enhanced reporting and validation system” and they say
that “it will take around five years’ before any appreciable trends in the data can be confirmed. As a result this should be considered as a break in the time series for the data on the number Transport Infrastructure Ireland
of injuries and injury collisions”. The RSA and An Garda Síochána continue to use the historic definition of serious injuries: An injury for which the person is detained in hospital as an National Roads Network Indicators 2018
‘in-patient’ or any of the following injuries whether or not detained in hospital: fractures, concussion, internal injuries, crushing, severe cuts and lacerations, severe general shock
requiring medical treatment.FOUR | SAFETY 37
C: TRENDS ON NATIONAL ROADS
NETWORK
Trends in fatal collisions nationally by
road type and collision type* Total Fatal Collisions
Regional & Local Road Network
National Road Network (Non Motorway)
Total fatal collisions on National Roads: Long term trends in total fatal collisions Motorway
400
2014 350
66 300
250
200
2015 150
61 100
50
0
2016
72
2005
2006
2007
2008
2009
2010
2011
2012
2013
2014
2015
2016
2017
2018
Year
Recent trends in total fatalities* on National Roads:
2017
46 Pedestrians:
2018
Cyclists:
2018
All Other:
2018
17 -26% 0 -100% 35 -5%
-24% 2018
2014–2018
50 2013
23
2013
4
2013
37
Transport Infrastructure Ireland
National Roads Network Indicators 2018
* Fatal collisions 2015-2018: AGS data (not verified by RSA)FIVE: ACCESSIBILITY + ENVIRONMENT
39

A1: IMPACT OF ROAD INVESTMENT
ON EMPLOYMENT ACCESSIBILITY
Key milestones in the development of the
National Roads network

Building on the methodology put forward
within the TII Transport Research and
Information Note: Impact of Improvements
in the Road Network on the Accessibility
                                              2006                                            2010
& Economic Potential of Counties, Urban
Areas, Gateways & Hubs, 2012; TII has         In 2006, prior to the completion of the Major   By 2010 the development of the MIUs
plotted accessibility to jobs for a number    Inter Urban (MIU) corridors linking the         delivered significant improvements in terms
of key milestones in the development of the   capital to the other cities; accessibility to   of accessibility to jobs in some of the more
National Roads Network.                       jobs within peripheral regions was weak.        peripheral areas.

Employment Accessibility
Score by NTM Zone
  Low

                                              2016                                            2018

                                              Since 2016, there are only subtle changes in    The addition of the M17/M18 has enhanced
                                              accessibility, related to the reduced capital   accessibility in the West of Ireland since its
                                              spend on National Roads infrastructure          opening in 2017 but there has been no other
   High                                       during that time.                               major schemes completed in 2017 or 2018
                                                                                                                                  Transport Infrastructure Ireland
                                                                                                                                National Roads Network Indicators 2018
40
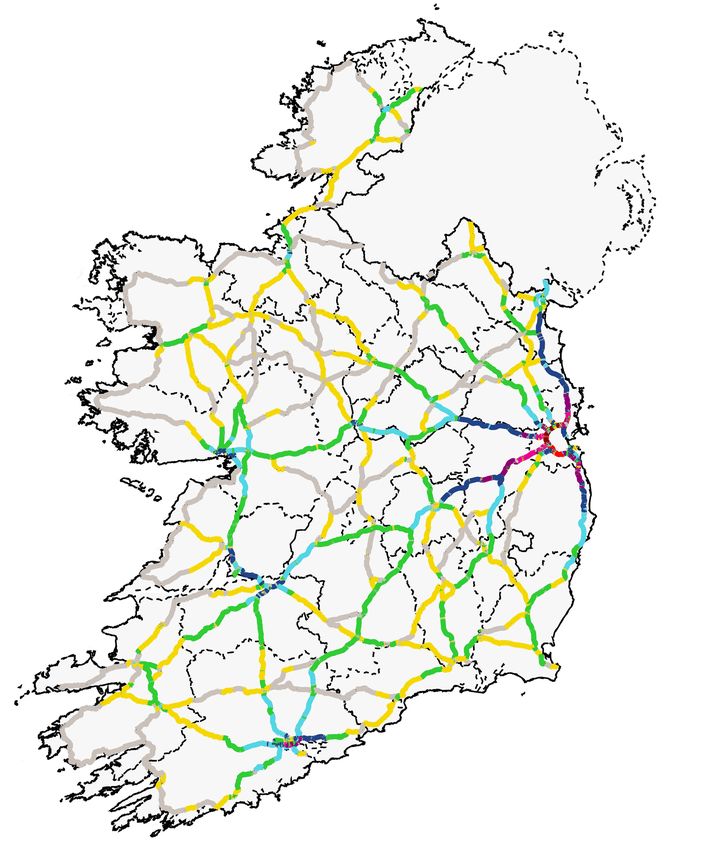
A2: IMPACT OF ROAD INVESTMENT
ON EMPLOYMENT ACCESSIBILITY
2016 versus 2018
A significant proportion The image compares accessibility to
jobs between 2016 and 2018 (relative
of the road capital spend percentage change), and effectively
from 2016 to 2018 was presents two stories:
within the west of the 1) An improvement in accessibility to
country and this has jobs in the West related to the recent
completion of the M17/M18.”
resulted in improved investments.
employment accessibility
2) Ongoing traffic growth in
for these areas. the east, particularly on the
routes into Dublin has contributed to
Difference in
Accessibility: increased journey times and
in turn slight reductions in
accessibility to jobs in the Greater
+10%
Dublin Area.
Despite the above, peripheral areas in
North-West, West and South-west and
South-East still tend to suffer from
poor accessibility to jobs as shown on
Accessibility + Environment - A1.
-2%
*Assessment based on the change in accessibility to employment only as a result of the network investment.
Employment levels have been held constant at 2016 levels as part of the assessment.
Transport Infrastructure Ireland
National Roads Network Indicators 2018Transport Infrastructure Ireland
Parkgate Business Centre
Parkgate Street, Dublin 8
D08 DK10
T: +353 1 6463600 W: www.tii.ie
Editorial and statistics: Cameron.McBain@aecom.com/ Shane.Dunny@aecom.com
Document updated by: Kevin.Carew@aecom.com
©TII 2019You can also read