Using Tree Modeling Applications and Game Design Software to Simulate Tree Growth, Mortality, and Community Interaction - gis.Point
←
→
Page content transcription
If your browser does not render page correctly, please read the page content below
Full Paper                                                                                             163

Using Tree Modeling Applications and Game Design
Software to Simulate Tree Growth, Mortality, and
Community Interaction
Aidan Ackerman1, Ashley Crespo2, John Auwaerter, Eliot Foulds4
1SUNY  College of Environmental Science and Forestry, Syracuse/USA · acackerm@esf.edu
2SUNY  College of Environmental Science and Forestry, Syracuse/USA · ascrespo@syr.edu
3SUNY College of Environmental Science and Forestry, Syracuse/USA · jeauwaer@esf.edu
4Olmsted Center for Landscape Preservation, Boston/USA · eliot_foulds@nps.gov

Abstract: This research involves the use of tree growth software and landscape visualization tools to
explore future landscape management possibilities at the Flight 93 National Memorial tree grove in
Stoystown, PA. The site's trees have experienced significant problems over the 10-year existence due
to compacted and degraded soils, leading to stunted tree growth and in many cases high rates of tree
mortality. Using a combination of a tree growth 3D modeling plugin and computer game development
software, we visualized several tree mortality scenarios which were used to inform landscape grove
management over the course of a 25-year maintenance plan. A pilot grove of 40 trees was selected for
initial growth simulation, with each tree modeled individually to represent species and documented
health characteristics. Real-time rendering game design software was used to develop photorealistic
renderings in order to visualize the changes in character that occurred as a result of various growth and
mortality scenarios.
Keywords: Growth, simulation, canopy, mortality, interaction

1      Introduction
The creation of three-dimensional landscape rendering typically relies on prefabricated tree
models to visualize trees in the landscape. These models sufficiently communicate the gen-
eral character of the tree, even incorporating differently-modeled instances of the same spe-
cies to give the appearance of natural variation. However, these tree models should not be
confused with simulations, those which integrate architectural and self-organizing compo-
nents of tree growth to create scientifically-informed tree models (PALUBICKI et al. 2009).
When attempting to manage a landscape to achieve an intended design character, and espe-
cially when a site-specific management strategy needs to be developed in response to site
conditions, a data-informed method to create vegetation that is faithful to botanical structure
and development is critical (DE REFFYE et al. 1988).
This research involves the use of tree growth software and landscape visualization tools to
explore future landscape management possibilities at the Flight 93 National Memorial in
Stoystown, PA. The memorial is located at the site of the crash of United Airlines Flight 93,
one of the hijacked flights in the September 11, 2001 attacks. The memorial was made to
honor the passengers and crew of Flight 93, who prevented the plane from reaching its in-
tended target by overtaking the hijackers. The memorial consists of a visitors center, Wall of
Names, Tower of Voices, and a memorial grove consisting of 40 individual groves which
contain 40 trees each, one tree for every victim of the plane crash (THOMPSON 2017). The
groves have experienced significant problems over the 10-year existence due to compacted

Journal of Digital Landscape Architecture, 6-2021, pp. 163-170. © Wichmann Verlag, VDE VERLAG GMBH ·
Berlin · Offenbach. ISBN 978-3-87907-705-2, ISSN 2367-4253, e-ISSN 2511-624X, doi:10.14627/537705013.
This article is an open access article distributed under the terms and conditions of the Creative Commons
Attribution license (http://creativecommons.org/licenses/by-nd/4.0/).
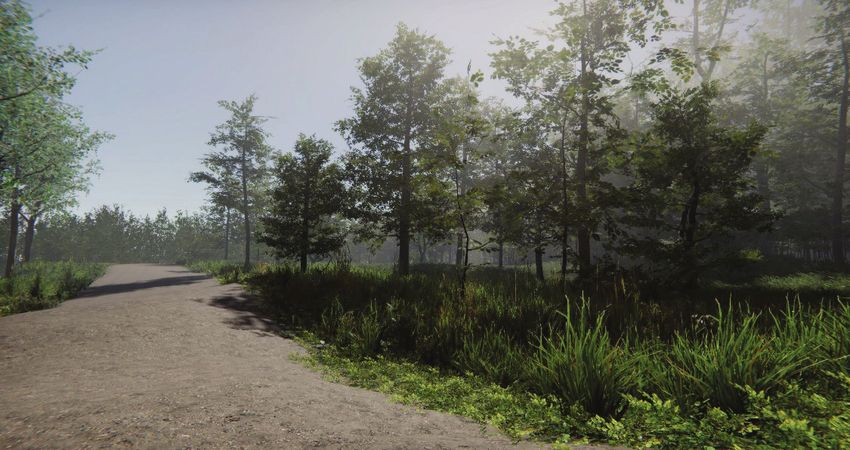
164                                            Journal of Digital Landscape Architecture · 6-2021

and degraded soils, leading to stunted tree growth and in many cases high rates of tree mor-
tality. This grove restoration and visualization project is interdisciplinary and collaborative,
with partnership between the National Parks Service Olmsted Center for Landscape Preser-
vation and the Center for Cultural Landscape Preservation at SUNY College of Environmen-
tal Science and Forestry. This research aims to visualize the visual impacts of tree mortality,
tree replacement, and ongoing maintenance on the intended design character of the memorial
groves in order to develop a tree management plan for the site.

2     Methods
Using a combination of a tree growth 3D modeling plugin and computer game development
software, we visualized several tree mortality scenarios which were used to inform landscape
grove management over the course of a 25-year maintenance plan. Many of the trees on the
site were dead or in extremely poor health due to poor soil and drainage on the site, which
was previously an active mine (EMILI et al. 2016). The severity of the tree health issues
throughout the site prohibit the use of standard tree 3D models to explore the stunted or
missing trees’ impact on the landscape character. In order to simulate interaction and com-
petition between trees, we needed to be able to grow 3D trees whose growth would respond
to sun and shade, compete for light with their neighbors, lose branches over time, and simu-
late a range of other tree growth factors (BELLA 1971). To accomplish this we used The
Grove, a Blender tree growing add-on, to simulate the growth behavior of each memorial
grove of 40 trees upon a base terrain developed using contours in AutoCAD and Rhino (Fig.
1). The initial use of the model heavily focused on the location and orientation of the 40
groves and the 40 individual trees within each grove. Each grove of 40 trees followed a tri-
angular planting pattern consisting of 5 columns of 8 trees. Trees were spaced 30’ apart in
each column, and 23’ apart diagonally between rows. The circular orientation of the 40
groves allows for a 32’ interior spacing along the inner pedestrian edge and 37’ spacing along
the vehicular approach road.

Fig. 1: Flight 93 National Memorial Aerial Photo (left) and 3D Model (right)

A test grove of 40 trees was developed for the pilot study. The goal for this test was to deter-
mine the methods for affecting tree growth on a per-species level based on the existing health
of each individual tree in a species group. There were 7 total species planted throughout the
40 groves. Four distinct health conditions were identified in research for this project, which
A. Ackerman et al.: Simulate Tree Growth, Mortality, and Community Interaction 165
was conducted by Cornell (BASSUK et al. 2020). While the criteria used to identify the four
health conditions were not outlined in the provided document, representative images of the
baseline conditions were present and used as a comparison. Currently, The Grove is unable
to translate traditional field measurements such as diameter at breast height (DBH) and
growth rate to the digital visualization of the tree. Therefore, the images provided in the Cor-
nell research were sufficient to begin this test. To achieve the most accurate visual appearance
of each health condition, manual adjustments were made to The Grove growth characteris-
tics. It is important to note that we did not find any information about whether the methods
used in the Cornell report are characteristic of a typical forest assessment.
To begin the growing process, the tree is selected from the pre-set list of available species in
The Grove. Each tree contains unique growth characteristics to best match the species se-
lected. These growth characteristics are present under 14 different categories that range in
the trees ability to add or drop branches to manipulating branch flexibility and leaf shading
area. A trial and error process was used to determine which of the 14 factors best reflected
the desired visual qualities.
Each growth characteristic is dependent on its own relative scale. A growth template was
developed to demonstrate the effects of the single growth characteristic at a time. For this
test, each individual tree was grown to the same age, and all other pre-set conditions re-
mained, except for the variable growth condition being tested. For each variable, 6 trees were
individually grown to test the minimum and maximum value, as well as 4 evenly spaced
values in between. This process was started for the five categories which we believed could
reach the desired effect based on the description text available through the program. These
included Canopy Density, Favor Bright, Favor Rising, Age Limit and Favor End.
Once the visual qualities were understood through this process, only three of the five previ-
ously selected characteristics were needed to reach the desired effect. These software controls
modified for this test were:
Canopy Density: Determined the addition or subtraction of side twigs to all branches
that were grown. A higher number in this category results in increased density tree foli-
age.
Favor Bright: Only maintained leaves that received the most direct sunlight. A higher
number in this category results in an exaggerated death of shaded leaves and exaggerated
growth of leaves in direct sun.
Favor Rising: Created a dense upright canopy that limited any outward spreading of
branches. A higher number in this category results in no horizontal competition for grow-
ing branches resulting in increasingly perpendicular growth.
The final combined values for these three characteristics were determined through a second-
ary trial and error process. Each iteration of the modified tree growth test was compared to
site photos and the sample images provided through the Cornell assessment until the combi-
nation of values matched the site conditions.
Initial experimentation was conducted to understand the impact of each of these conditions
on the resulting tree model, resulting in a baseline set of values that effectively generate the
4 distinct health conditions outlined by Cornell. This process was then used to generate a
model of a single grove, with each of the 40 trees modeled individually to represent each
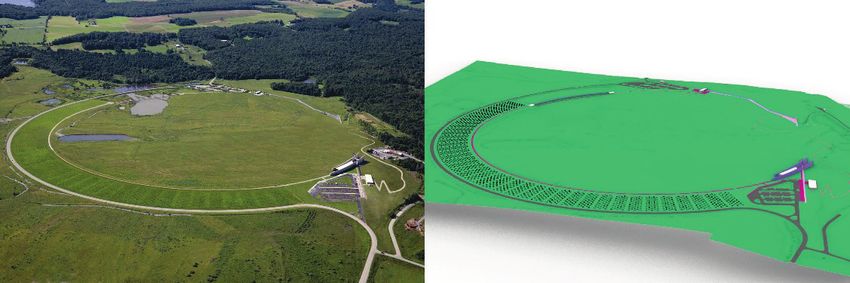
species and documented health (Fig. 2).166 Journal of Digital Landscape Architecture · 6-2021 Fig. 2: Software settings for each individual tree within one modelled memorial grove Each modification was recorded so that all instances of the same species-health interaction in all groves could be replicated with the same configuration. The single grove modeling was completed with all tree species represented at their current health, allowing us to determine the abilities of the software to visually capture healthy as well as unhealthy trees across sev- eral species (Fig. 3).
A. Ackerman et al.: Simulate Tree Growth, Mortality, and Community Interaction             167

Fig. 3: Completed model of existing grove conditions, perspective view (left), top view
        (mid) and documented tree health and species from field study (right)

The next step was to develop a mortality threshold study. The mortality threshold study was
necessary in order to determine the extent to which tree mortality would negatively impact
the character and identity of each of the 40 groves. Although the loss of a single tree in a
grove of 40 trees would be unlikely to cause visual fragmentation, our team theorized that
the loss of several trees could potentially disturb the visual cohesiveness of the grove. To
create the mortality study, 4 groves were selected. The timescales to be visualized were 10,
20, and 30 years, with the goal being to represent various moments during and slightly be-
yond a 25-year management plan. Using a randomized mortality pattern, five scenarios were
developed per grove; 0, 3, 6, 9, and 12 tree deaths. These represent a maximum of 30% tree
mortality per grove, a high mortality rate for a healthy tree community (HILBERT et al. 2019,
MORIN et al. 2015, NOWAK et al. 2004). Each grove was divided into three sections, with each
section receiving a varied proportion of tree mortality. The sections included: Viewshed
Edge, containing trees that interact with adjacent groves; Movement Edge, trees that face the
vehicular approach road or the inner pedestrian path; and Interior, all remaining trees with no
edge condition. Each mortality scenario was randomized per grove, per mortality scenario
and diagrammed in 2D in order to evaluate the study design (Fig. 4).
The Grove currently does not allow for the growth of different species within a single run
sequence. Each species much be grown independently of the other resulting in no generated
interaction between sets of grown trees. This was not particularly important for the health
study, as the goal was to demonstrate the varied health conditions on trees that are already
stunted and not physically interacting with the surrounding tree canopies. However, in visu-
alizing future growth conditions for the mortality study, in this case up to 30-year growths,
alterations were made to the growing process to allow The Grove to respond to interacting
tree canopies.
168 Journal of Digital Landscape Architecture · 6-2021
Fig. 4: Mortality study scenarios showing numbers of dead trees and percentage of dead
trees on edges + interior
For each mortality scenario, a single tree species was selected to represent the quantity of
trees needed for each mortality study. All pre-set growth characteristics were maintained to
best represent an ideal growth condition. The entire grove, up to 40 trees, were then grown
as a single sequence to the desired timescale. This process was repeated for each of the groves
independently as the individual groves did not yet interact with the adjacent grove.
After completing the mortality studies, we used photorealistic real-time rendering to visualize
the changes in character that occurred within each. Immersive realism was critical to the
project’s success, as it provided the highest level of precision (KULLMAN 2014). The ability
to differentiate both large and small-scale vegetation elements was essential to providing the
level of realism necessary to understand the visual impact of any changes to these elements
(KINGERY-PAGE & HAHN 2012). This level of realism would allow us to visually communi-
cate subtle changes in detail within the tree canopy in order to note the changes in landscape
character that occurred in each study. Although Blender and the Grove offered significant
computational power in simulating tree growth models, they lacked suitable environmental
rendering characteristics such as particle-driven atmospherics and real-time vegetation ren-
dering. Just as importantly, they lacked the ability to handle thousands of polygons necessary
to create a large-scale realistic site model. We exported each Blender model as an FBX file
and imported them into Unity as scene assets.
A primary visualization goal of ours was to achieve fast real-time rendering with a high de-
gree of realism, a challenging task given the large site dimensions and number of trees to be
modeled (BAO et al. 2011, COLDITZ et al. 2005). In order to accomplish this goal, we elected
to use Unity 3D, a game design and virtual reality platform. Unity’s ability to continually
adjust each scene object’s Level of Detail (LOD) proximal to the viewpoint allowed us to
develop the site’s meadow condition along with enabling us to quickly place each Blender
tree model and quickly apply bark and leaf materials specific to each species. The completed
grove models were then exported as still image renders (Fig. 5). Unity’s ability to createA. Ackerman et al.: Simulate Tree Growth, Mortality, and Community Interaction 169 standalone scene packages also allowed us to create walkthrough models that could be con- trolled by the user, allowing project partners to self-navigate through the groves and explore changes to the canopy. This was a critical factor in making decisions about tree canopy threshold, as we could understand the impact of missing trees from both a fixed and moving point of view. Fig. 5: Still image render of Grove mortality study in Unity 3D 3 Discussion and Conclusion The ability of Blender and the Grove to simulate tree growth characteristics and environmen- tal interaction provided a valuable tool for confidently attempting to visualize a future con- dition. The ability of Unity3D to create fast, highly realistic real-time renderings and WALK- THROUGH STUDIES OF TREE MORTALITY ENABLED US TO IMMERSIVELY STUDY AND EVALUATE THE IMpacts of tree mortality rates on the character of the groves as a whole. It is crucial to acknowledge that these tools do not provide us with absolute certainty about future tree growth and loss. Rather, they provide a method of testing a range of possibilities with the understanding that the outcome is likely to exist somewhere within that range. Acknowledg- ing this fundamental truth will enable us to use these tools to communicate potential land- scape futures, with visualizations which provide data-informed input for management and design decision making. Within the geodesign framework established by CARL STEINITZ (2012), this represents a way of working that has the potential for vast growth. Algorithmic approaches to geodesign have the potential to analyze the complexity of ecological relationships within the landscape (ROLF & PETERS 2020). As adaptive, performance-driven ecological landscape approaches become increasingly complex, this ability to computationally play out future vegetation growth sce- narios can offer new forms of visual feedback and design iteration.
170                                         Journal of Digital Landscape Architecture · 6-2021

References
BAO, G., LI, H., ZHANG, X., CHE, W. & JAEGER, M. (2011), Realistic Real-Time Rendering
   For Large-Scale Forest Scenes. In: 2011 IEEE International Symposium On Vr Innovation
   (Pp. 217-223). IEEE, Piscataway, NJ.
BASSUK, N., TROWBRIDGE, P. & DENIG, B. (2020), Evaluation of the 40 Memorial Groves at
   the Flight 93 National Memorial, Cornell University, Ithaca, NY.
BELLA, I. E. (1971), A New Competition Model For Individual Trees. Forest Science, 17 (3),
   364-372.
COLDITZ, C., COCONU, L., DEUSSEN, O. & HEGE, H. C. (2005), Real-Time Rendering of Com-
   plex Photorealistic Landscapes Using Hybrid Level-Of-Detail Approaches. In: Infor-
   mation Technologies in Landscape Architecture.
DE REFFYE, P., EDELIN, C., FRANÇON, J., JAEGER, M. & PUECH, C. (1988), Plant Models
   Faithful To Botanical Structure And Development. ACM Siggraph Computer Graphics,
   22 (4), 151-158.
EMILI, L. A., PIZARCHIK, J. & MAHAN, C. G. (2016), Sustainable Remediation Of Legacy
   Mine Drainage: A Case Study Of The Flight 93 National Memorial. Environmental Man-
   agement, 57 (3), 660-670.
HILBERT, D. R., ROMAN, L. A., KOESER, A. K., VOGT, J. & VAN DOORN, N. S. (2019), Urban
   Tree Mortality: A Literature Review. Arboriculture & Urban Forestry, 45 (5), 167-200.
KINGERY-PAGE, K. & HAHN, H. (2012), The Aesthetics Of Digital Representation: Realism,
   Abstraction And Kitsch. Journal of Landscape Architecture, 7 (2), 68-75.
KULLMANN, K. (2014), Hyper-Realism And Loose-Reality: The Limitations Of Digital Re-
   alism And Alternative Principles In Landscape Design Visualization. Journal of Land-
   scape Architecture, 9 (3), 20-31.
MORIN, R. S., RANDOLPH, K. C. & STEINMAN, J. (2015), Mortality Rates Associated With
   Crown Health For Eastern Forest Tree Species. Environmental Monitoring And Assess-
   ment, 187 (3), 87.
NOWAK, D. J., KURODA, M. & CRANE, D. E. (2004), Tree Mortality Rates and Tree Population
   Projections In Baltimore, Maryland, USA. Urban Forestry & Urban Greening, 2 (3), 139-
   147.
PALUBICKI, W., HOREL, K., LONGAY, S., RUNIONS, A., LANE, B., MĚCH, R. & PRUSINKIE-
   WICZ, P. (2009), SElf-Organizing Tree Models For Image Synthesis. ACM Transactions
   On Graphics (TOG), 28 (3), 1-10.
ROLF, W. & PETERS, D. G. (2020), Algorithmic Landscapes Meet Geodesign for Effective
   Green Infrastructure Planning: Ideas and Perspectives. Journal of Digital Landscape Ar-
   chitecture, 5-2020, 476-485.
STEINITZ, C. (2012), A Framework for Geodesign: Changing Geography by Design. Esri
   Press, Redlands, CA.
THOMPSON, J. W. (2017), From Memory to Memorial: Shanksville, America, and Flight 93.
   Penn State Press.
You can also read