Q1 2021 Earnings Presentation
←
→
Page content transcription
If your browser does not render page correctly, please read the page content below

Q1 2021 Earnings
Presentation
May 13, 2021
Disclaimer
General
You are advised to read this disclaimer carefully before reading, accessing or making any      should not be considered an alternative to IFRS financial measures, such as net income.
other use of the information included herewith. These materials are not an offer or the        As non-IFRS financial measures do not have standardized definitions prescribed by IFRS,
solicitation of an offer to purchase any securities or make any investment. This               they are less likely to be comparable with other issuers or peer companies. A description
presentation includes information about Tricon Residential Inc. and its subsidiaries and       of the non-IFRS measures used by the Company in measuring its performance is included
investees (together, the “Company”) as of March 31, 2021, unless otherwise stated. These       in its Management Discussion and Analysis available on the Company’s website at
materials should be reviewed in conjunction with the Company’s Financial Statements and        www.triconresidential.com and on SEDAR at www.sedar.com.
Management Discussion and Analysis for the periods ending March 31, 2021 and are
subject to the detailed information and disclaimers contained therein. All dollar amounts      This presentation may contain information and statistics regarding the markets in which
are expressed in U.S. Dollars unless otherwise stated.                                         the Company and its investees operate. Some of this information has been obtained from
                                                                                               market research, publicly available information and industry publications. This information
The Company measures the success of its business in part by employing several key              has been obtained from sources believed to be reliable, but the accuracy or completeness
performance indicators that are not recognized under IFRS including net operating income       of such information has not been independently verified by the Company and cannot be
(“NOI”), funds from operations (“FFO”), core funds from operations (“core FFO”), adjusted      guaranteed. Disclosure of past performance is not indicative of future results.
funds from operations (“AFFO”), and assets under management (“AUM”). These indicators

Forward-Looking Statements
This presentation may contain forward-looking statements and information relating to            In regards to the strategic goals and targets presented herein, these are based on the
expected future events and the Company’s financial and operating results and projections,       assumed impact of the growth drivers, proposed transactions, and sources of cash flow
including statements regarding the Company’s growth and performance goals and                   described and on the assumption that other drivers of performance will not deteriorate
expectations, including, in particular, targeted returns, expected future performance, and      over the relevant period. There can be no assurance that such growth drivers, transactions
growth projections, that involve risks and uncertainties. Such forward-looking information is   or cash flow will occur, be realized, or have their anticipated impact and therefore no
typically indicated by the use of words such as “will”, “may”, “expects” or “intends”. The      assurance that actual performance will align with the Company’s targets.
forward-looking statements and information contained in this presentation include
statements regarding the Company’s strategic priorities; expected or targeted financial and     Projected returns and financial performance are based in part on projected cash flows for
operating performance including project timing, projected cash flow; projected NOI and          incomplete projects as well as future company plans. Numerous factors, many of which
other projected performance metrics; the ability of the Company to extend debt maturities       are not in the Company’s control, and including known and unknown risks, general and
and refinance debt; the ability to attract third-party investment and the current private       local market conditions and general economic conditions (such as prevailing interest rates
fundraising pipeline FFO growth and the potential drivers of that growth; expectations for      and rates of inflation) may cause actual performance and income to differ from current
the growth in the business; the availability and quantum of debt reduction opportunities        projections. Accordingly, although we believe that our anticipated future results,
and the Company’s ability to avail itself of them; improvements to the Company’s financial      performance or achievements expressed or implied by the forward-looking statements and
reporting, the acquisition and development plan of the Queen & Ontario project; the             information are based upon reasonable assumptions and expectations, the reader should
Company's future balance sheet composition; the anticipated quantum and availability of         not place undue reliance on forward-looking statements and information. If known or
leverage to facility home acquisitions; the anticipated value of the Company's assets and       unknown risks materialize, or if any of the assumptions underlying the forward-looking
managed portfolios; the potential up-size of the Homebuilder Direct JV; the Company's           statements prove incorrect, actual results may differ materially from management
acquisition program and the anticipated pace and number of home acquisitions; Tricon’s          expectations as projected in such forward-looking statements. Examples of such risks are
growth strategies and projections for its single-family rental business; and the Company’s      described in the Company’s continuous disclosure materials from time-to-time, as
capital raising targets and anticipated future investment vehicles. These statements reflect    available on SEDAR at www.sedar.com. The Company disclaims any intention or
the Company’s current intentions and strategic plans however, the items noted may not           obligation to update or revise any forward-looking statements, whether as a result of new
occur in line with the Company’ expectations or at all. These statements are based on           information, future events or otherwise, unless required by applicable law.
management’s current expectations, intentions and assumptions which management
believes to be reasonable having regard to its understanding of prevailing market
conditions and the current terms on which investment opportunities may be available
                                                                                      Jacksonville, FL
                                                                                          1
Q1/21 Key Takeaways

•   Long-term tailwinds support our Sun Belt
    middle-market strategy
•   Core single-family rental business
    continues to deliver solid operating
    performance
•   U.S. multi-family rental business showing
    sequential improvement
•   Growth initiatives in place across all
    rental strategies, supported by $1 billion
    of third-party capital commitments
    announced year-to-date
•   Achieved de-leveraging target ahead of
    schedule

                                                 2
Summary of Results
All dollar amounts are expressed in U.S. Dollars throughout the presentation unless otherwise stated

                                                             Headline Results

 • Core FFO per Diluted Share of $0.13 (C$0.16), +30% year-over-year

 • Earnings per Diluted Share (from Continuing Operations) of $0.21, compared to ($0.24) in the prior year

 • Consolidated NOI of $66.2M, +14% year-over-year

 • Closed 80% syndication of $1.3B U.S. multi-family portfolio, raising $432M in gross proceeds

 • Formed $1.1B (C$1.4B) Toronto multi-family build-to-core Joint Venture with CPP Investments1

 • Launched $1.5B Homebuilder Direct Joint Venture subsequent to quarter end

 • Reduced net debt to assets to 49.1% on a consolidated basis (vs. 56.6% in Q4/20) and 45.6% on a
   proportionate basis (vs. 55.3% in Q4/20)

1.   Expected total development cost of the JV's projects.

                                                                     3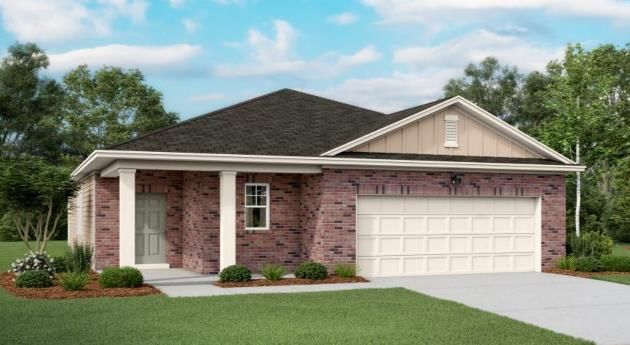
Summary of Results
All dollar amounts are expressed in U.S. Dollars throughout the presentation unless otherwise stated

                                                        Single-Family Rental

• Continued to grow single-family rental portfolio, with 762 homes acquired in Q1/21

• Increased Tricon’s proportionate NOI by 8.3%, to $51.6M

• Same home metrics include 4.1% NOI growth (4.9% without Texas storm impact), 66.7% NOI margin
  (67.1% without Texas storm impact), 97.3% occupancy, 20.6% annualized turnover and 6.6%
  blended rent growth

                                                    Other Business Segments

• For-sale housing: distributed $12.9M of cash to Tricon in the quarter (including performance fees)

• U.S. multi-family rental: operating metrics improved sequentially including 94.6% occupancy (+100
  bps), 43.8% annualized turnover (-270 bps) and 2.9% blended rent growth (+470 bps)

• Canadian multi-family development: construction continues at The Taylor, West Don Lands (Block 8)
  and The Ivy, and commenced at The James

                                                                     4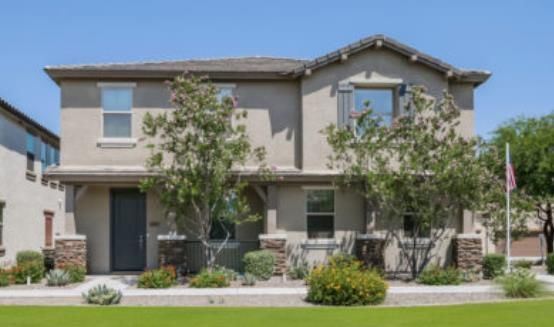
Long-term Trends Support Tricon’s Investment Strategy
                            Well-established migration trends support Tricon’s Sun Belt middle-market strategy.

        Sun Belt Migration                                                 Population Growth from 2010 to 2020 in
                                                                           Tricon’s Key Markets1
        • States where Tricon operates
          experienced population growth of 10%                                   Texas                               15%
          over the past decade on average, 400
          bps above the national average                                       Nevada                                15%

        • We expect these migration trends to                                   Florida                             14%
          continue as Americans move to
          markets with superior job growth, lower                              Arizona                        12%
          taxes, more affordable living options
          and better weather                                             South Carolina                 10%             21.7M people
                                                                                                                     moved to Tricon’s
                                                                               Georgia                  10%          key markets over
                                                                                                                      the past decade
                                                                         North Carolina              9%

                                                                            Tennessee              8%

                                                                     National Average           7%

                                                                              California      6%

1.   U.S. Census Data, April 26th, 2021

                                                                     5
Long-term Trends Support Tricon’s Investment Strategy
                                Demographic shifts are driving demand for Tricon’s single-family rental homes.

     Demographic Shifts                                                                 Family-age Millennials and Baby Boomers are
                                                                                        Driving Housing Demand1
     • The large Millennial and Baby
       Boomer demographic cohorts are                                              30
                                                                                                                                 ~72M Millennials are
                                                                                                                                 seeking single-family
       the key drivers of demand for                                                                                             homes as they form                                         …while ~69M
                                                                                                                                 families…                                                  Baby Boomers
       single-family housing                                                                                                                                                                are preferring
                                                                                                                                                                                            to age in place

        • Millennials are reaching the

                                                             U.S. Population (M)
                                                                                   20
          peak of their family-forming
          years from 2020 to 2030, and
          are seeking more space,
          proximity to schools and parks,
                                                                                   10
          and other lifestyle benefits of
          single-family homes

        • Baby Boomers are preferring to
                                                                                   0
          age in place, with occupancy

                                                                                                                                45 - 49
                                                                                        25 - 29

                                                                                                  30 - 34

                                                                                                            35 - 39

                                                                                                                      40 - 44

                                                                                                                                          50 - 54

                                                                                                                                                     55 - 59

                                                                                                                                                               60 - 64

                                                                                                                                                                                  70 - 74

                                                                                                                                                                                            75 - 79

                                                                                                                                                                                                      80 - 84
                                                                                                                                                                         65- 69

                                                                                                                                                                                                                85 >
          declining in seniors housing
          due to concerns related to
          COVID-19
                                                                                                                                          Population Age

                                                                                                                                              2020                  2030
1.   U.S. Census Data, April 26th, 2021

                                                                                        6
Tricon’s Balance Sheet Asset Composition
   Single-family rental is Tricon’s core balance sheet growth strategy and represents more than 90% of our assets
                            following the syndication of the U.S. multi-family rental portfolio.

                                                                                                                   Multi-family Rental (2%)
  Residential Development (5%)                                                                                     Reduced to 2% of assets as a result of
  Focused on Canadian multi-family                                                        2%                       the recent syndication transaction;
  and U.S. single-family rental build-                                               5%                            expected to remain below 5% of assets
  to-rent growth strategies, expected
  to remain near 5% of assets

                                                                                         $5.7B
                                                                                 of Real Estate
                                                                                    Assets1
                                                                                                             93%

                                                                                                                   Single-family Rental (93%)
                                                                                                                   Core balance sheet growth strategy
                                                                                                                   expected to account for over 90% of our
                                                                                                                   assets
Note: Refer to “General” and “Forward-Looking Statements” on Page 1
1. Total assets based on reported fair market value of consolidated assets as of Q1/21    Jacksonville, FL
                                                                                               7
SFR Acquisition Channels
Tricon has expanded its single-family rental acquisition program across multiple channels and formed
complementary joint ventures with third-party investors to scale faster.
Investment Vehicle
MLS Off Market SFR JV-1
Traditional resale home Includes emerging “iBuyer” Homebuilder Direct JV
channel direct sales channel which
allows sellers to bypass THPAS JV-1
MLS
Development of New Portfolios
Home Communities
Leverage Tricon’s
Development of industrywide relationships
dedicated single-family and strong operating
rental home communities platform to buy stabilized
homes in bulk
Existing New Home Scattered New Homes
Communities Acquisition of newly-built
Acquisition of dedicated homes
single-family rental home
communities
8SFR Growth Opportunity: Homebuilder Direct JV
The recently announced Homebuilder Direct JV leverages longstanding relationships with homebuilders to
expand our new home acquisition channels and provides a runway to grow our SFR portfolio beyond 30,000
homes.
Investment Vehicle Homebuilder Direct JV SFR JV-1 THPAS JV-1
Total Equity Capitalization $300 – 450M $750M $450M
Tricon Equity $100 – 150M $250M $50M
Tricon Co-Investment % 33% 33% 11%
% of Commitment Deployed 0% 88% 26%
Total Capitalization
$1.0 – 1.5B $2.0B $1.0B
(Including property-level debt)
Target # of Homes 3,500 – 5,000 10,000 ~2,500
Target # of Homes / Year 1,200 – 1,700 3,200 – 4,000 ~800
Acquisition of scattered new Acquisition of resale Development of dedicated
homes and existing single- homes and portfolios of single-family rental home
Primary Products /
family rental home existing homes communities
Acquisition Channel
communities (no investment in
development)
9SFR Growth Opportunity: Build-to-Rent Communities
Tricon intends to grow its portfolio of SFR build-to-rent communities by acquiring completed communities and
developing new communities in conjunction with third-party homebuilders.
Overview & Strategy Build-to-Rent Communities Pipeline (# Homes)
• Provides our residents with new, high-quality rental
homes and combines the privacy of single-family 5,000
housing with the community atmosphere of multi-
family, as well as shared amenities in some cases
4,000
• Currently own six communities (474 homes) in five
markets
# of Homes
3,000
• Under contract or in advanced due diligence for the
development or acquisition of ten new communities
Rosedale
• Projected to add 12-18 communities per year 2,000
(1,200-1,800 homes per year) by 2022+ across
Tricon’s various investment vehicles
1,000
• Leveraging third-party capital and Tricon’s network
of third-party developers / builders across the U.S.
-
• Provides Tricon with new, state-of-the-art homes 2020 2021E 2022E 2023E
with low cost to maintain 6 10 25 40
Actual/Projected # of Communities Developed or Acquired
10SFR Growth Opportunity: Build-to-Rent Communities
Build-to-rent communities are an incremental and growing source of acquisitions for our SFR business,
providing our residents with a new, affordable housing option
(~$1.00 rent per sq. ft. for existing communities compared to ~$1.30-$1.50 for multi-family rental).
Vistancia - Phoenix, AZ Palomino Ranch - Houston, TX
• 136 homes / 1,575 avg. sq. ft. / $1,544 avg. monthly rent ($0.98 per sq. ft.) • 120 homes / 1,709 avg. sq. ft. / $1,692 avg. monthly rent ($0.99 per sq. ft.)
Rosedale
Hickory Station - Nashville, TN Trails at Culebra - San Antonio, TX
• 67 homes / 1,560 avg. sq. ft. / $1,607 avg. monthly rent ($1.03 per sq. ft.) • 124 homes / 1,740 avg. sq. ft. / $1,860 avg. monthly rent ($1.07 per sq. ft.)
11Canadian Multi-Family Growth Vehicle: JV with CPP
Tricon’s $1.1B (C$1.4B1) JV with CPP Investments provides a path of growth to 7,000 units for our Canadian
multi-family portfolio which is projected to be valued close to C$4.00 per share upon stabilization.
~7,000
Units
WDL Down-
The WDL Remaining
The Selby The Ivy 7 Labatt The James Blocks 10, town East
Taylor Block 81 CPP JV
3/4/7, 201 (CPP)
1,200 to
Suites 500 286 231 770 558 120 1,755 870
2,000
Initial
Stabilized 2022 2022 2023 2024 2025 2024-2026 2025 2025+
Occupancy
Current IFRS Illustrative NAV per Share upon Illustrative NAV per Share upon
NAV per Share2 Stabilization of Existing Projects3 Stabilization of CPP JV Projects3
C$1.06 ~C$3.00 ~C$3.75
Note: this information is based on current project plans, which are subject to change.
1. The West Don Lands includes four developments with initial occupancy projected to commence in 2023 and continue through 2026.
2. Current IFRS NAV includes development properties and The Selby.
3. Assumes development yield of 4.75% on cost and market stabilized cap rate for downtown Class A multi-family assets. CPP Investments JV developments are projected at a total cost of C$1.4B. NAV per
share is based on 193M basic shares outstanding.
4. Expected total development cost of the JV's projects.
12Canadian Multi-Family Growth Vehicle: JV with CPP
1. xxxx
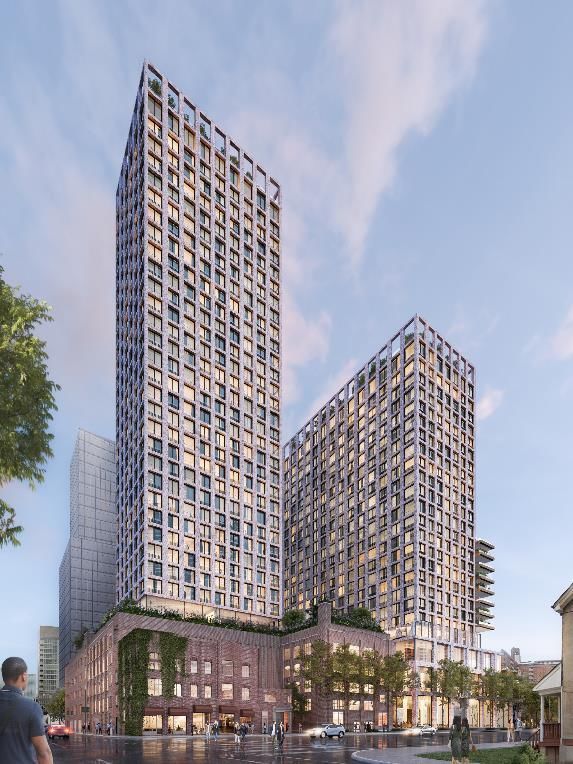
Tricon’s first project with CPP Investments is located in Toronto’s Downtown East neighbourhood. The planned
development consists of two towers totaling 870 rental suites.
• Fully entitled 1.8-acre site
• Two towers with 870 total units
• Mix of 1, 2, and 3-bedroom units
• Extensive amenities including:
– Half-acre onsite park
– Outdoor rooftop pool with skyline views
– Biosteel Performance Centre full-size commercial gym and studios
– Rooftop urban communal gardens
– Kids discovery room
– 24-hour concierge powered by Toronto Life
– Pet spa with grooming area
– Automated parcel system
– Secured bicycle storage
• Short walk to a future Ontario Line subway station and convenient
walking proximity to the downtown core
• Total development cost of ~C$600M including C$192M equity (~C$58M /
30% from Tricon)
• Construction starting early 2022 with completion expected in 2025
• Pioneering COVID-response technological features including touchless
technology, air filtration and ventilation, more open-plan spaces, and the
use of our mobile app to perform different functions remotely
13Our Key Priorities1
• Provide stable, predictable income for shareholders by focusing on defensive rental
Grow FFO housing
per Share
• Target 10%+ compounded annual growth rate in FFO per Share from 2019 to 2022
• Raise third-party capital in all our businesses to enhance scale, improve
Increase Third-Party operational efficiency, and drive return on equity with incremental fee income
AUM
• Add new third-party equity capital commitments of ~$1B from 2019 to 2022
Grow Book Value per • Build shareholder value by deploying our free cash flow into accretive growth
Share opportunities focused on rental housing
• Minimize corporate-level debt while maintaining prudent and largely non-recourse
Reduce Leverage leverage at the business segment or asset level
• Pursue consolidated leverage target of 50-55% net debt to assets
• Adopt financial disclosure practices that reduce complexity and improve
Improve Reporting comparability of results with real estate peers
1. Refer to the Forward-Looking Statements on Page 1
Jacksonville, FL
14Performance Dashboard1
Grow FFO per Share Increase Third-Party AUM Grow Book Value per Share
Target 10%+ compounded Tricon has met its target of raising $1B 17% annualized growth since entering
annual growth of fee-bearing equity capital ahead of SFR in 2012
schedule C$11.06
59% increase year-
over-year
$1.0B
$0.3B CA MF
$0.52 to C$3.01
$0.57 $1.0B
$0.4B U.S. MF
$0.463
$0.29 2012 2013 2014 2015 2016 2017 2018 2019 2020 Q1/21
$0.3B SFR
Book Value per Share does not fully capture the value
2019 2020 2022 Target 2021 YTD 2022 Target from embedded growth in underlying investments or the
Private Funds & Advisory business segment
Reduce Leverage2 Improve Reporting
Q1/21 Consolidated
2019 Consolidated
Leverage – Targeted
Leverage
Range Achieved Tricon has achieved its □
✓ Adopt consolidated accounting
leverage target of 50- □
55% net debt to assets
✓ Adopt more conventional company-
wide real estate performance metrics,
39% on a consolidated
51% 49% such as FFO / AFFO per share
basis, ahead of
61% schedule □
✓ Enhance financial disclosure practices
□
✓ Adopt comprehensive ESG plan
(46% proportionate
Equity Debt
leverage)
1. Refer to “General” and “Forward-Looking Statements” on Page 1, USD./CAD exchange rate used are 1.2660 at March 31, 2021
2. All debt figures are presented net of cash and exclude Tricon’s outstanding 5.75% convertible debentures
3. Jacksonville,
The comparative period results have been recast to present the consolidated results in conformity FLperiod presentation. Please refer to MD&A for further details.
with the current
15ESG Update – First Annual Sustainability Report
Tricon is proudly launching its first annual Sustainability Report in May 2021.
Our ESG Journey
ESG has always been ingrained in how we take care of our
employees and residents, how we manage and invest in our
real estate assets, and how we conduct our operations.
16Select Financial Metrics
For the three months ended March 31
(in thousands of U.S. dollars) 2021 20201 %Y/Y
Financial highlights on a consolidated basis
Net income (loss), from continuing operations $ 41,904 $ (46,533) 190%
Diluted earnings (loss) per share from continuing
$ 0.21 $ (0.24) 187%
operations
2021 20201 %Y/Y
Non-IFRS measures on a proportionate basis
Core funds from operations (Core FFO) $ 32,522 $ 21,493 51%
Adjusted funds from operations (AFFO) $ 25,817 $ 14,850 74%
Core FFO per share $ 0.13 $ 0.10 30%
AFFO per share $ 0.10 $ 0.07 43%
Core FFO payout ratio 33% 44% (25%)
AFFO payout ratio 42% 64% (34%)
1. The comparative period results have been recast to present the consolidated results in conformity with the current period presentation. Please refer to MD&A for further details.
Jacksonville, FL
17Core FFO per Share Growth
30%
Year-over-Year Growth
(+$0.03)
~$0.02 ~$0.00
~$0.01 • Lower interest
expense
• Increase in PF&A • Offset by higher
revenue corporate
• Strong for-sale overhead
housing FFO • … and higher $0.13
Driven by 8% • Slight increase in weighted average
increase in NOI on multi-family rental diluted shares
larger portfolio, rent FFO
$0.10 growth, and higher
occupancy
Q1/20 Core FFO per share Single-Family Other Business Corporate Q1/21 Core FFO per share
Rental Segments
18Consolidated Debt and Liquidity Profile
Tricon’s liquidity profile has continued to improve significantly compared to last year, and near-term debt
maturities present an opportunity to refinance at lower prevailing interest rates.
Debt Maturity Schedule Improved Liquidity Profile ($M)
(including Tricon’s extension options)
Q1/21 Q1/20
Credit Facility $500 $500
$1,400 Less: Amounts Drawn -$19 -$326
Corporate Plus: Unrestricted cash $295 $53
$1,197
$1,200 SFR Total $776 $227 +242%
Development y/y
$1,000 $886
$800
$600
$440
$373
$400 $313
$200 $143
$0
$0
2021 2022 2023 2024 2025 2026 2027
• $41M development debt – to be repaid or • $471M SFR Term Loan – to be partially
refinanced in 2021 repaid with cash on hand Blended rate of 2.97%
with potential to be
• $102M SFR subscription line – to be repaid • $459M 2017-1 SFR Securitization – to
refinanced at lower
jointly by Tricon and investors in JV-1 be refinanced
prevailing interest rates
• $236M SFR JV Warehouse Facilities –
to be refinanced
19Single-Family Rental – Q1/21 Same Home NOI Drivers
4.1%
Year-over-Year Same
Home NOI Growth
(4.9% excluding the Texas
storm impact)
+3.1% +0.9%
Revenue Growth Expense Growth
$0.4M increase in property
80 bps occupancy taxes as property values
increase (to 97.3%) appreciate, and $0.1M
5.1%
increase in property
increase
4.3% higher average insurance reflecting higher
in rental
monthly rent ($1,421 to premiums
revenue
$1,482)
$44.3M Partially offset by $0.3M $46.2M
Offset by a $0.9M reduction in repairs,
increase in bad debt maintenance and
expense (2.1% of total turnover costs attributable
revenue in Q1/21 vs. to a lower turnover rate
0.8% in Q1/20)
Includes $0.2M of Texas
storm repair expense
Q1/20 NOI Revenues Expenses Q1/21 NOI
20Single-Family Rental – Post Q1/21 Operational Update
Same Home Average Occupancy1 Same Home Average Rent Growth1
97.5%
16.3%
Average
97.3% 97.3% 97.3%
occupancy
for past 9 13.6%
quarters: New Move-In
12.4%
96.9%
10.6%
8.0%
7.4% Blended
6.2%
6.0%
Renewal
4.3% 4.4%
4.0% 3.9%
Jan-21 Feb-21 Mar-21 Apr-21 Jan-21 Feb-21 Mar-21 Apr-21
Re-leasing spreads driven by strong market demand,
Sustaining consistent near-record occupancy
limited supply of homes and loss-to-lease while continuing
throughout the pandemic
to self-govern on renewals
1. Metrics reflect Tricon’s proportionate share of the managed portfolio and exclude limited partners’ interests in the SFR JV-1 portfolio
Jacksonville, FL
21U.S. Multi-Family Rental – Q1/21 NOI Drivers
-5.0% $0.9M NOI decline offset by
Year-over-Year NOI decline lower interest expense =
$0.3M increase in FFO
(+4.4% y/y)
-1.3% y/y +4.3% y/y
Revenue Decrease
Expense Growth
2.6% lower average
monthly rent ($1,244 to
$1,212)
$0.2M increase in
$0.4M incremental bad utilities and other direct
$17.1M debt expense (3.6% of costs related to stay-at- $16.2M
total revenue in Q1/21 vs. home orders
1.9% in Q1/20)
$0.1M increase in
Offset by $0.4M increase property tax expense
in fees from ancillary Occupancy: 94.6%
services $0.1M increase in Turnover: 43.8%
marketing and leasing Blended Rent
Growth: 2.9%
Q1/20 NOI Revenues Expenses Q1/21 NOI
1. The comparative period results have been recast to present the results in conformity with the current period presentation. Please refer to MD&A for further details.
22Strong Private Fundraising Pipeline
2021 is poised to be the most prolific year of fundraising in Tricon’s history, with $1B of third-party equity
commitments already raised year-to-date. Tricon expects to earn over $10M of annual asset management fees
from fundraising vehicles closed this year.
Canadian
Strategy Single-family Rental U.S. Multi-family Rental
Multi-family Rental
• SFR JV-1 – $2B JV which is on • Recently announced • Investment partnerships across
Existing
track to be fully invested by mid- syndication of 80% of Tricon’s 10 development projects
Investment 2021 U.S. multi-family portfolio,
Vehicles raising $432M in equity • Recently announced $1.1B
• Homebuilder Direct – $1.0 to proceeds (C$1.4B) JV with CPP
$1.5B JV focused on buying Investments
new homes from homebuilders
Planned • SFR JV-2 – Successor vehicle • Launch of a growth vehicle to
Investment to existing SFR JV-1 acquire multi-family properties
in Tricon’s Sun Belt markets
Vehicles
Projected
Financial $1B of third-party equity commitments raised year-to-date with more to come
Impact for
Tricon
~$10M of projected annual asset management fees on investment vehicles raised in 2021
(as well as property management, acquisition, development/construction and leasing fees to offset associated
overhead expenses, and potential performance fees)
Refer to “General” and “Forward-Looking Statements” on Page 1
23Upcoming Catalysts1
Complete syndication of U.S. multi-family portfolio
Reduce leverage
Raise third-party capital across all residential strategies
Grow single-family rental portfolio
Generate cash from legacy for-sale housing assets
Construct and stabilize Canadian multi-family developments
1. Refer to the Forward-Looking Statements on Page 1
24Gary Berman Wissam Francis Wojtek Nowak
President and Executive Vice President Managing Director,
Chief Executive Officer and Chief Financial Officer Capital Markets
wfrancis@triconresidential.com wnowak@triconresidential.com
triconresidential.comYou can also read