SECURITYHOLDER REVIEW 2018 - Abacus Property Group
←
→
Page content transcription
If your browser does not render page correctly, please read the page content below

Abacus
Proper t y
Group
SECURITYHOLDER REVIEW 2018
C o n te n t s
01    About Abacus
04    Financial highlights
06    Chairman and Managing Director’s report
10    Group performance
12    Group performance – office
13    Group performance – self storage
14    Group performance – retail
15    Group performance – industrial and other
16    Group performance – residential developments and land
19	Investor relations
20    Contact us
20    Key events and securities exchange listing

                                   Glossary
                                   Abacus Property Group (or “Abacus” or “the Group”)
                                   Abacus Group Holdings Limited
                                   Abacus Group Projects Limited
                                   Abacus Storage Operations Limited
                                   Abacus Funds Management Limited –
                                   the Responsible entity of Abacus Trust and Abacus Income Trust
                                   Abacus Storage Funds Management Limited –
                                   the Responsible Entity of Abacus Storage Property Trust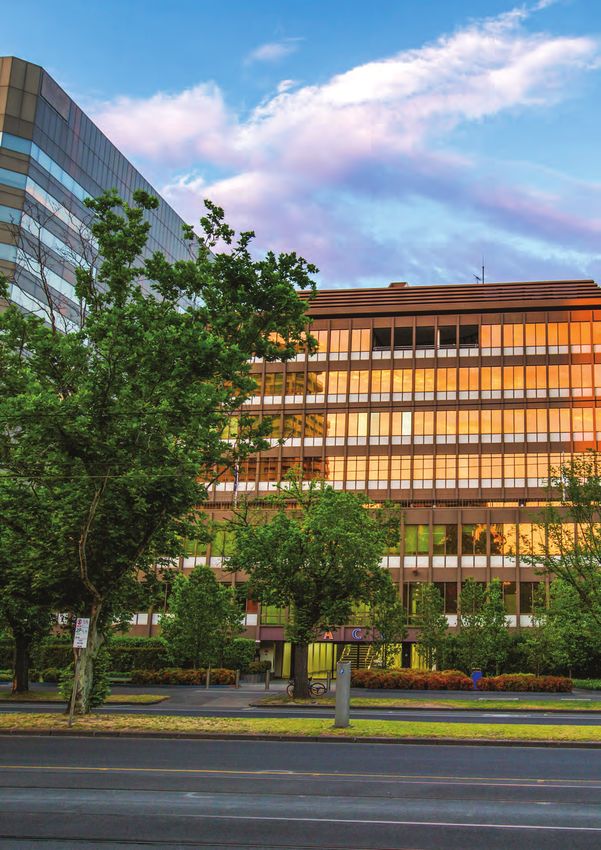
About
Abacus

Abacus Property Group is a leading       Abacus Property Group owns a
diversified Australian real estate       diversified core investment portfolio
investment trust that invests in real    of office, self storage, and super
estate opportunities across Australia    convenience retail properties. Rental
and New Zealand. Abacus was              income from these assets is the
established in 1996. We listed on the    largest contributor to the earnings
ASX in 2002 and are included in the      of the Group. Abacus’ disciplined
S&P/ASX 200 index.                       property selection process maintains
                                         a firm focus on fundamental real
Abacus’ overarching strategy is
                                         estate value.
to invest our capital in property
opportunities to drive long term total   Over time, Abacus has been
returns and maximise securityholder      successful in sourcing and investing
value. Our investment objective is       in assets. Through active asset
to provide our investors with reliable   and development management,
and increasing returns.                  Abacus has been able to drive
                                         transformational events with the
Abacus is an integrated property
                                         majority of these assets, that has
business, with a strong track
                                         enhanced income and capital value.
record of achieving returns, built
on our core expertise in accessing       As at 30 June 2018, Abacus Property
properties and projects and actively     Group had a total of $2.1 billion
managing them to realise their full      of property assets on the balance
value. Simply structured with a single   sheet. This total comprises the $1.5
office location in Sydney, Australia,    billion commercial portfolio and the
our flat corporate structure and         $666 million self storage portfolio.
business model supports strong           $650 million of Abacus’ $1.5 billion
synergies across our businesses and      commercial portfolio is its co-
contributes to the overall success of    investment ownership in a total of
the Group.                               $1.8 billion of assets managed on
                                         behalf of third party capital.

       ABACUS PROPERT Y GROUP | SECURIT YHOLDER REVIEW 2018
02— 03
Historically, Abacus Property               Following a review of current market       Image: St Peters
                                                                                       self storage facility NSW
Group has been involved in a                conditions, project status and
range of property development and           outlook, Abacus has refined its
finance activities, mostly involving        strategic direction giving prominence
commercial, retail, industrial and          to sectors where we have a clear
residential development opportunities       competitive advantage. Abacus’
in metropolitan eastern seaboard            future capital allocation framework
locations.                                  will focus heavily upon increasing
                                            our exposure to the self storage and
These opportunities have seen
                                            office markets while reducing our
Abacus participate in projects
                                            exposure to retail and residential
directly or together with experienced
                                            markets at this point in the cycle.
joint venture partners. We have
                                            This strategy will target longer
used the Group’s combination
                                            dated core plus office assets that
of capital and property expertise
                                            we can develop into core assets
or the regional or sector-specific
                                            that Abacus will hold for the longer
expertise of our joint venture
                                            term. Increasing exposure to these
partners to drive value. We have also
                                            asset classes will enhance our ability
provided finance solutions for real
                                            to grow recurring revenue sources
estate development, typically with
                                            to maintain the Group’s targeted
participation in project upside.
                                            distribution growth rate of 2-3% pa.
As at 30 June 2018, Abacus
                                            This investment strategy will continue
Property Group had a total of
                                            to be funded via the realisation of
$449 million in residential focused
                                            our residential developments over
development and financing projects
                                            the coming years and reducing
on our balance sheet.
                                            our exposure to two non-core retail
Strategy                                    assets at this point in the cycle.
                                            We have a successful track record
Evolving in line with
                                            of acquiring assets and actively
market cycles                               managing property assets to enhance
Going forward, Abacus’ overarching          income and capital growth. Our
strategy is to invest capital in property   capability and track record have
opportunities to drive long term total      facilitated joint ventures with a
returns and maximise securityholder         number of sophisticated global third
value. Our investment objective is          party capital providers. The strategy
to provide investors with reliable          for our third party capital business
and increasing returns. We look for         (and in line with the Abacus strategy)
property assets that are capable of         is to invest in assets, typically on the
providing strong and stable cash-           Eastern seaboard of Australia that we
backed distributions and provide            believe have the potential for income
genuine potential for enhanced capital      and capital growth.
and income growth as a result of our
active asset management.

                                                    ABACUS PROPERT Y GROUP | SECURIT YHOLDER REVIEW 2018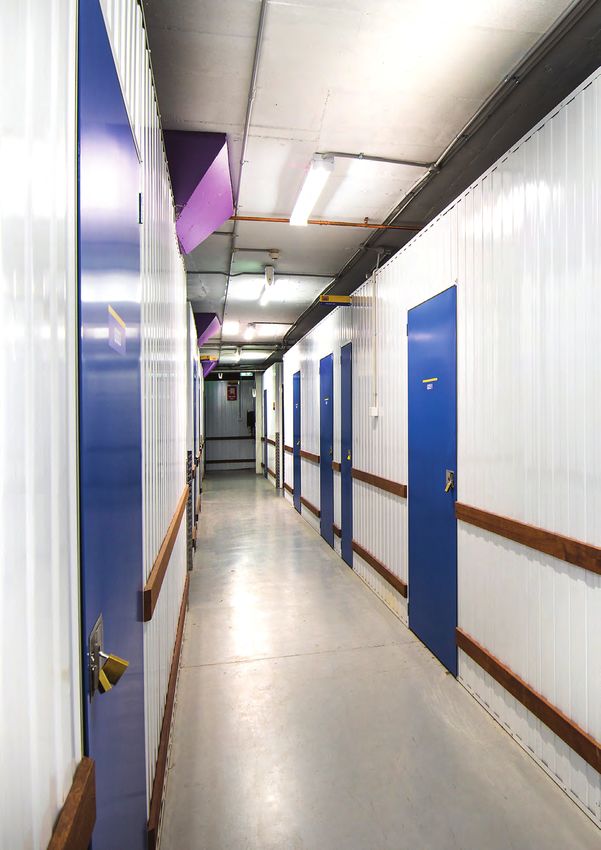
04—05

Financial
highlights
2018 FINANCIAL HIGHLIGHTS

9%                                 growth in funds from operations
                                   to $169.8 million

  3% growth in Distributions                                8.5%1 growth in net tangible
   per security to 18.0 cents                                 assets to $3.18 per security
  6.3% annual growth                                        23.3% gearing
   in underlying EPS to
   31.7 cents since FY10

Return on Equity of 14.7%
for 12 months to 30 June 2018
(Return on equity is calculated as the growth in NTA per security plus the
distribution paid/payable per security divided by the opening NTA per security1)

2018 PROPERTY HIGHLIGHTS

                    97 properties                                                     $1.5 billion commercial portfolio
                    $2.7 billion of total assets                                      91.3% commercial portfolio
                                                                                        occupancy
                    $666 million self storage portfolio                               4.1 year commercial portfolio WALE
                    89% occupancy across the self
                     storage portfolio

1 adjusted to include the distribution paid in August 2017
Underlying profit                                                Underlying earnings                                            Distribution per security
($ million)                                                      per security (cents)                                           (cents)
200                                                              35
                                                                                                                                      18.00c
       $183.3 $186.8                                                             32.7c                                          18
                                                                       31.7c
150
                                                                 30                                                                              17.50c
                                  $124.0   $128.3
                                                                 25                                   24.5c
                                                    $101.3                                  22.4c                                                          17.00c     17.00c
100                                                                                                             20.8c           17
                                                                 20                                                                                                            16.75c
 50
                                                                 15

  0                                                              10                                                             16
         FY18      FY17            FY16     FY15     FY14               FY18      FY17      FY16       FY15      FY14                   FY18      FY17      FY16       FY15     FY14

2018 Financial highlights

                                                              FY18              FY17                 FY16                FY15                  FY14

  Funds from operations1                                     $169.8m           $156.4m

  Consolidated statutory net profit2                         $243.7m           $285.1m              $185.9m             $133.5m           $108.3m

  Underlying profit       3
                                                             $183.3m           $186.8m              $124.0m             $128.3m           $101.3m

  Cash flow from operations                                  $168.4m           $168.5m              $85.7m              $119.3m            $90.3m

  Underlying profit per security                              31.7c             32.7c                22.4c               24.5c              20.8c

  Distributions per security                                 18.00c            17.50c               17.00c              17.00c             16.75c

  Interest cover ratio        4
                                                              8.7x              7.4x                 4.2x                5.1x                  4.8x

2018 Balance sheet metrics

                                                              FY18              FY17                 FY16                FY15                  FY14

  Total assets                                               $2.7bn            $2.4bn               $2.3bn              $2.0bn             $1.9bn

  Net tangible assets5                                       $1.8bn            $1.7bn               $1.5bn              $1.4bn             $1.2bn

  NTA per security5                                           $3.18             $3.02                $2.66               $2.49              $2.38

  Gearing   6
                                                              23.3%             20.5%                25.8%              18.2%              23.4%

  Look through gearing7                                       23.5%             25.1%                30.3%              22.6%              25.4%

  Total debt drawn                                           $695m             $514m                $629m               $388m              $500m

  Debt term to maturity                                       3.8yrs            3.4yrs               3.5yrs              4.3yrs             4.6yrs

  Average cost of debt             8
                                                              4.3%              5.2%                 5.4%                6.1%                  5.4%

1 Reported for the first time in FY18 with FY17 provided for comparison
2 Excludes non controlling interests.
3 Calculated in accordance with the AICD/Finsia principles for reporting underlying profit.
4 Calculated as underlying EBITDA divided by interest expense.
5E xcludes external non-controlling interests of $46.6 million for FY18. FY18 NTA includes a provision for distribution of $52.1 million declared on 21 June 2018.
6 Bank debt minus cash divided by total assets minus cash.
7 Includes joint venture and fund assets and debt consolidated proportionately with Abacus’ equity interest.
8 Weighted average base rate plus margin and line fees.

                                                                           ABACUS PROPERT Y GROUP | SECURIT YHOLDER REVIEW 2018
06 — 07

Chairman
and Managing
D i re c to r ’s
re p o r t

LEFT: John Thame, Chairman
RIGHT: Steven Sewell, Managing Director

Dear Securityholders                      in distributions per security of 3% to    the coming years. This strategy
                                          18.0 cents. Distributions are typically   is focussed on growing the
We include for your information and       paid out of recurring earnings, which     contribution to recurring earnings
review, the FY18 Securityholder           consists of revenue from recurring        to fund the Group’s targeted
Review for Abacus Property Group.         and passive activities such as rental     distribution growth of 2-3% pa.
Abacus Property Group                     income from our commercial and self
                                                                                    Pleasingly, Abacus also experienced
                                          storage properties, management fees
delivered a solid result                  and interest income from our loans.
                                                                                    strong growth in its balance sheet
for the 2018 financial                                                              assets during the year, driving net
year that highlighted                     Key to our strategy is to seek            tangible assets (NTA) per security
                                          to grow the revenue from these            growth of 8.5% from $2.931 to
impressive returns across                 activities so that we can support         $3.18 at 30 June 2018. This
the Abacus platform. Each                 our commitment to securityholders         contributed to a return on equity2
business unit contributed                 to grow distributions per security        for securityholders for the 12
positively to the financial               by 2-3% per annum. The Group’s            months to 30 June 2018 of 14.7%.
result with a large                       funds from operations per security
                                                                                    The Group’s annual financial report
volume of transactions,                   during FY18 was 29.4 cents. Surplus
                                                                                    includes our operating and financial
                                          earnings are re-invested into new
asset management and                      opportunities to grow our recurring
                                                                                    review (OFR). The objectives
development activities                                                              of the OFR are to provide our
                                          earnings and support the growth in
undertaken.                                                                         securityholders with a narrative and
                                          distributions to securityholders into
                                                                                    analysis to supplement the financial
The Group’s strategy historically,        the future.
                                                                                    report and assist in understanding
has proven resilient, and has seen        Abacus’ balance sheet continues           our operations, financial position,
us grow recurring earnings whilst         to maintain prudent levels of liquidity   business strategies and prospects.
delivering strong profits from            and gearing. Gearing remains low          It contains information you need to
transactional activities to boost         at 23.3%, well below our target           make an informed assessment of the
overall underlying profits. The result    maximum gearing limit of up to 35%.       Group. We encourage you to read
delivered growth of 9% in funds           Post balance date transactions will       the OFR.
from operations to $169.8 million.        reduce gearing to c.18% providing
This translated into underlying profit    for over $600 million of capacity for
of $183.3 million, down slightly from     acquisitions across the investment
$186.8 million in FY17 (a record year     portfolio. While gearing levels are
in terms of underlying profit).           low, we are committed to ensuring
Since FY10, the Group has                 we have a productive balance sheet
achieved a very commendable               and will endeavour to ensure the
underlying earnings growth of             Group is adequately invested in
13.9% per annum.                          income producing assets.

For the year to 30 June 2018,             During FY18 Abacus continued
we delivered an underlying earnings       to focus investment capital on
per security of 31.7c for the year with   acquisitions across the self storage
the Group now achieving almost a          and office sectors, in line with our
6% per annum compound growth              revised capital allocation strategy.
in underlying earnings per security       This activity was and will continue
                                                                                    1 Adjusted to include the distribution paid in August 2017.
to securityholders over eight financial   to be funded via a reduction in retail
                                                                                    2R  eturn on Equity is calculated as the growth in NTA
periods since FY10. Pleasingly our        investment and the realisation of            per security plus the distribution paid per security

strong result underwrote our growth       our residential developments over            divided by the opening NTA per security, adjusted
                                                                                       for distribution declared 3 July 2017.

                                                  ABACUS PROPERT Y GROUP | SECURIT YHOLDER REVIEW 2018
08—09
Sustainability away in April 2018, following a Abacus has had a successful start
short battle with cancer. Abacus to its revised strategy through
We are very proud of the was the culmination of Frank’s life project and asset realisations and
commitment and improvements work, and we extend sympathy acquisitions that have delivered its
to our sustainability protocol and to his wife and family. strong results through FY18.
strategies throughout the year.
Abacus is pleased to deliver on our Frank was succeeded by Steven Abacus is targeting a distribution of
commitment to our sustainability Sewell who joined the Group in 18.5 cps for FY19, a 3% increase
reporting journey by producing our October 2017, after previous on FY18 distributions per security
Sustainability Report in accordance roles with Macquarie Group and and at the higher end of our stated
with the Global Reporting Initiative Federation Centres. distribution growth target.
for a second year. Our FY18 Finally, we and the other members
Sustainability Report demonstrates
Outlook
of our Board would like to thank
our commitment to a range of We are proud of the Group’s
you, our investors and our other
functions including: resource efforts and results this financial year.
stakeholders, for your continuing
and financial management; The financial results are strong and
support. We are pleased with what
engagement with our stakeholders pleasingly, deliver on our revised
we have been able to achieve, and
(inclusive of our employees, strategy. This continues to highlight
are confident that we are positioning
tenants and communities); health our ability to grow returns across
Abacus to continue to deliver strong
and safety; and our governance our business as we move through
long term total returns. This would not
and risk frameworks. The report the differing cycles of each
be possible without the dedication
provides both an outline of our business sector.
and hard work of everyone at
sustainability footprint from the The business outlook remains Abacus. Therefore, on behalf of the
Group’s operations, along with key positive with expected growth in Board, we would like to thank our
performance indicators to assist us our recurring earnings base which executive team and all our staff.
in managing our sustainability into provides scope to deliver on our
the future. We encourage you to stated distribution policy to grow
read this report. distributions per security at c.2-3%
We will continue to improve on pa for securityholders. We see our
our reporting requirements to the distribution growth as sustainable
and stable despite any fluctuations in John Thame,
community and the sustainability Chairman
of our property portfolio through earnings per security due to higher or
active ongoing property lower levels of transactional profits.
management to incorporate more
Our revised strategy
efficient plant and equipment.
The environmentally focused will increase investment Steven Sewell,
management of our buildings allocated to both self Managing Director
contributes to capital appreciation storage and investment
of these assets over time. properties funded by
realisation of our residential
Transition of
development projects.
Managing Director Concurrently we are
It is with sadness that we note enhancing our investment
the passing of the founder and capacity utilising our third-
Managing Director of the Group, 1 Return on Equity is calculated as the growth in NTA
Dr Frank Wolf. Frank passed
party capital platform. per security plus the distribution paid/payable per
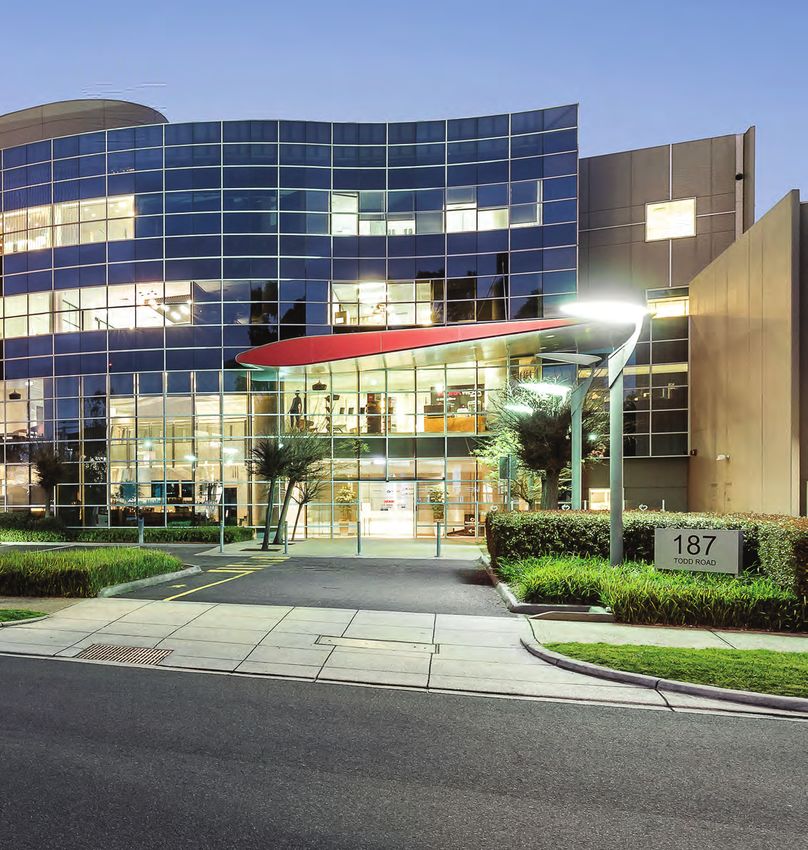
security divided by the opening NTA per security.Image: 187 Todd Road,
Port Melbourne NSW
ABACUS PROPERT Y GROUP | SECURIT YHOLDER REVIEW 201810 —11
G ro u p
p e r fo r m a n c e
FY18 financial results There are no debt expiries in FY19 platform for the Group. We are
and our average debt term to focused on expanding our investment
We have delivered a solid financial maturity is 3.8 years. We anticipate relationships and product offerings
result with contributions from all Abacus’ weighted average interest to meet the needs of our investment
of Abacus’ businesses delivering rate will remain relatively stable partners.
positive returns across the Group’s as current capacity is utilised and
main financial and capital metrics. Our investment portfolio delivered
anticipate it should be no greater
While underlying profit was $154 million EBITDA for the
than 5.00% over FY19.
$183.3 million (down 2% on FY17) financial year.
the Group delivered growth of The Group’s business is focused
9% in funds from operations to on driving recurring earnings while
$169.8 million. Abacus’ total assets producing strong capital returns.
increased to $2.7 billion at year end. This focus will underpin the
The Group’s net tangible asset per delivery of distribution growth to
security improved to $3.18, driven securityholders.
by strong earnings performance
across the Group and growth in asset
Overview of our
valuations following capitalisation rate operating divisions
compression across the portfolio.
Investment portfolio
The Abacus balance sheet was in a The Group has $2.1 billion of property
robust capital position at balance date assets in the investment portfolio,
with a low gearing level of 23.3%. spread across our commercial and
This followed strong realisations self storage portfolios. This includes
during the year across the investment $650 million invested alongside our
property and residential development investment partners in over $1.8
portfolios. Our low levels of gearing billion of mostly office and retail assets
provide significant liquidity levels under management through our third-
that provide for over $600 million of party capital platform. Abacus’ third-
acquisition capacity. party capital joint ventures remain
an integral strategic investment Image: 2 King Street,
Fortitude Valley QLDABACUS PROPERT Y GROUP | SECURIT YHOLDER REVIEW 2018
12—13

Office
Our office portfolio grew 41% through the year to an $879 million
portfolio. The office portfolio increased to a total of 20 properties
after a number of acquisitions were made.
Investments made in line with our city fringe investment thematic included:
– 187 Todd Road, Port Melbourne VIC for $43.5 million (Abacus interest 100%)
– 452 Johnston Street, Abbotsford VIC for $93.5 million (Abacus interest 100%)
– 464 St Kilda Road, Melbourne VIC for $47.7 million (Abacus interest 50%)
– 11 Bowden Street, Alexandria NSW for $48.9 million (Abacus interest 100%)
– 63 Ann Street, Surry Hills NSW for $27.5 million (Abacus interest 100%)
Abacus and its partners divested several properties during the year which delivered
some strong returns to the Group and included:
– 50% interest in 201 Pacific Highway, St Leonards NSW for $85.8 million
As a result of changes in the office portfolio from acquisitions and divestments and
a mixed leasing environment across regions, the portfolio occupancy increased from
81.5% at 30 June 2017 to 86.9% at 30 June 2018. Like for like rental growth remained
strong across our existing and stabilised portfolio to deliver growth of 3.1%. This was
largely due to the performance of the Group’s property management team, leasing of
developed assets and in-built annual rental increases.

 PORTFOLIO METRICS                    JUN 18                            OFFICE PORTFOLIO: $879 MILLION
                                                                                  TAS 1%
 Portfolio ($m)                       879                                  ACT 7%

 No. of assets                        20                            SA 10%                       NSW 23%
 Lettable area (sqm)
                   1
                                      118,284

 WACR (%)                             6.23

 Occupancy (% by area)
               1
                                      86.9

 Average rent ($ per sqm)             $469                                                          QLD 18%
 WALE (yrs by income)
        1
                                      3.6                          VIC 41%

 Rental growth         1,2
                             (%)      3.1

1 Excludes development assets
2 Like for like rent growth
Self storage
Our self storage portfolio grew in value, by 5.9% to $666 million
across 62 assets. This growth was derived from strong income
growth that delivered revaluation gains across the existing portfolio.
The portfolio has achieved compound annual growth in portfolio
value of 12.3% pa since FY13.
The self storage portfolio is considered a core holding within the Group. Self storage income is one of
the largest contributors to recurring earnings and cash flow and is therefore an essential cornerstone
to distributions paid to our securityholders.
The Group has continued with its stated strategy of allocating capital to grow its exposure to the
self storage sector. Abacus remains committed to growing the asset base while ensuring the portfolio
is operated in an efficient and profitable manner. After an evaluation of the portfolio during the year,
a portfolio of five assets was identified as non-core (due to regional concerns) and divested in
May 2018 for $26.5 million. The Group also acquired two sites during the year in Robina and
Stafford in QLD for development into self storage facilities in the medium term.
Post financial year end, the Group reached agreement with the private owners of the Storage King
operating platform, for Abacus to acquire a minority stake of 25% in the business. We are constantly
working with the Storage King team to continue to enhance performance going forward.
The self storage portfolio’s stabilised assets are the key contributor to underlying growth across
the portfolio. They continue to deliver improved operating performances across Australian and
New Zealand markets. The stabilised portfolio grew occupancy to 89.4% from 89.1% and average
rental rate increased to $276/m² from $262/m². The increased rental and occupancy improved
portfolio revenue per available metre (RevPAM1) to $247/m² from $234/m² in 2017, a 5.6% increase.
PORTFOLIO METRICS JUN 18 SELF STORAGE PORTFOLIO: $666 MILLION
Portfolio ($m) 666
NSW 21%
No. of assets 62 VIC 27%
Lettable area1 (sqm) 287,725
WACR (%) 7.45
Occupancy 1,2
(% by area) 89.4
QLD 18%
Average rent1,2 ($ per sqm) A$276 ACT 15%
RevPAM1,2 (per available sqm) A$247
1 Excludes development assets NZ 21%
2A verage over last 12 months (by area) of all stabilised assets
REGIONAL GEOGRAPHIC DIVERSITY BY NLA
Regional
Canberra
NZ 6%
12%
Auckland
15%
Regional
QLD 2% Sydney
Regional 21%
VIC 4%
Brisbane
16% Melbourne
1 RevPAM measures the profitability of the portfolio. 23%
ABACUS PROPERT Y GROUP | SECURIT YHOLDER REVIEW 201814—15
Retail
Our retail portfolio total value grew to $425 million from
$402 million during the year, although Abacus’ interest reduced
post year end as a result of our strategic partnership activity.
The number of assets in the portfolio remained at 5 shopping
centres. This is in line with our view to own ‘super convenience
retail’ assets.
Abacus’ retail portfolio is currently development focused, as all assets are at some stage
of redevelopment, with two (Ashfield and Lutwyche) satisfying our thematic of “super
convenience retail”. The thematic supports assets that incorporate up to three national
brand supermarkets with a heavy focus on food, services and minimal exposure to
discretionary retail tenancies. We are undertaking development to enhance or enable
our centres to control their catchment and limit the impact from shifting shopper trends,
highlighted by an increase in online shopping for discretionary retail.
Assets that are considered non-core to this strategic thesis, namely Oasis in QLD and
Liverpool Plaza in NSW, have been or will be sold. Abacus has formed joint venture /
capital partnership relationships with like-minded institutions that share our vision of
‘super convenience retail’ assets.
No additional assets were added to the portfolio during the year as we focused on our
redevelopment strategies within the existing portfolio as well as the divestment of part
shares of our centres to suitable capital partners. The portfolio delivered impressive
improvements in like for like rental growth of 4.6% for the financial year.
PORTFOLIO METRICS JUN 18 RETAIL PORTFOLIO: $425 MILLION
VIC 14%
Portfolio ($m) 4253
No. of assets 53
Lettable area1 (sqm) 56,488
WACR (%) 5.83 NSW 58%
Occupancy (% by area)
1
92.9
QLD 28%
Average rent ($ per sqm) $523
WALE1 (yrs by income) 5.1
Rental growth 1,2
(%) 4.6
1 Excludes development assets
2 Like for like rent growth
3 This has reduced post year end due to settlement of Bacchus Marsh Village Shopping Centre
and the sell down of Ashfield Mall and Lutwyche City Shopping CentreIndustrial and other
Our industrial and other portfolio reduced in value to
$160 million during the course of the year with the sale of the
Derrimut in VIC. Our industrial portfolio is largely focused on
assets with strong yields on sites that offer strategic value
through alternative use or expansion strategies.
PORTFOLIO METRICS JUN 18 INDUSTRIAL/OTHER PORTFOLIO: $160 MILLION
NSW 5%
Portfolio ($m) 160
No. of assets 10
Lettable area (sqm)
1
48,765
WACR (%) 8.31
VIC 42% QLD 53%
Occupancy (% by area)
1
100.0
Average rent ($ per sqm) $86
WALE (yrs by income)
1
2.6
Rental growth1,2 (%) 1.0
1 Excludes development assets
2 Like for like rent growth
ABACUS PROPERT Y GROUP | SECURIT YHOLDER REVIEW 201816—17
Residential delivered 476 apartments across Image: Joe & The Juice retailer
14 Martin Place, Sydney NSW
two buildings in the inner-city
developments and land suburb of South Brisbane. The
Now considered non-core, the project is a joint venture with
Group is committed to completing City Developments Limited, a
development projects and also Singaporean developer and
seeking to realise the value of our Kilcor Properties.
investments, some of which have – One A, Erskineville Sydney NSW
been held by the Group for delivered 175 apartments in the
many years. inner-city suburb of Sydney. The
The Developments business project is a joint venture with the
invests in projects and provides Linear Group.
finance solutions that focus on Further, Abacus also has a number
select residential and commercial of ventures that own land sites,
development opportunities in across the Metropolitan Sydney area,
core locations directly and with undergoing residential rezoning.
experienced local joint The timeframe to work through the
venture partners. rezoning of non-residential zoned
Abacus has total assets of $449 land is uncertain and complex. This
million invested across a number of is the reason it is possible to derive
residential developments in capital higher risk adjusted returns through
city markets across the eastern projects of this type. Timeframes can
seaboard of Australia. Abacus be disrupted through unpredictable
controls approximately 7,700 changes in local council and state
apartment units or land lots which governments and can affect Abacus’
equates to approximately $58,000 ability to correctly forecast when
cost base per unit/land lot. This low projects will be realised.
average price provides evidence
that the developments business has
prospects for strong returns.
Abacus completed four residential
joint venture development projects
during the last 12 months. As at 30
June 2018:
– The Eminence, Melbourne VIC
delivered 193 apartments in the
inner city suburb of Carlton. The
project is a 50/25/25 joint venture
with the Crema and Lechte Groups.
– Ashfield Central, Sydney NSW
delivered 101 apartments in the
inner-city suburb of Ashfield. The
project is 100% owned by Abacus.
– Ivy and Eve, Brisbane QLDABACUS PROPERT Y GROUP | SECURIT YHOLDER REVIEW 2018
18—19
I nve s to r
re l a t i o n s
Investor To receive your investor
communications electronically,
communications online including the Annual Report, please
Abacus is committed to long term go to www.investorserve.com.au
sustainable practices. As part of and register for online services.
our sustainability initiatives we
offer investor communications Manage your
via various electronic methods, securityholding online
including the Abacus website at
It is possible to access your
www.abacusproperty.com.au. We
investment online via access to
encourage securityholders to visit
the registry’s investor login facility
the website to view online versions
at www.investorserve.com.au,
of our reports including the 2018
signing in using your SRN/HIN,
Annual Financial Report and this
surname and postcode. Other
2018 Securityholder Review. The
functions allow you to update your
website also provides a wide
information online, including:
range of information, including
ASX announcements, investor –c hange of address details;
information and reports including our –u pdate bank account details for
sustainability reports. direct crediting of your distribution
payments;
We encourage securityholders
to opt to receive securityholder –p rovision of tax file numbers;
updates and communications –d istribution reinvestment plan
electronically. You will benefit from participation;
receiving prompt information and –a ccess PDFs of tax and
have the convenience and security distribution statements; and
associated with electronic delivery. –g eneral queries about your
There are also significant cost securityholding.
savings associated with this method
of communication delivery and
above all, this is a responsible and
environmentally friendly option.
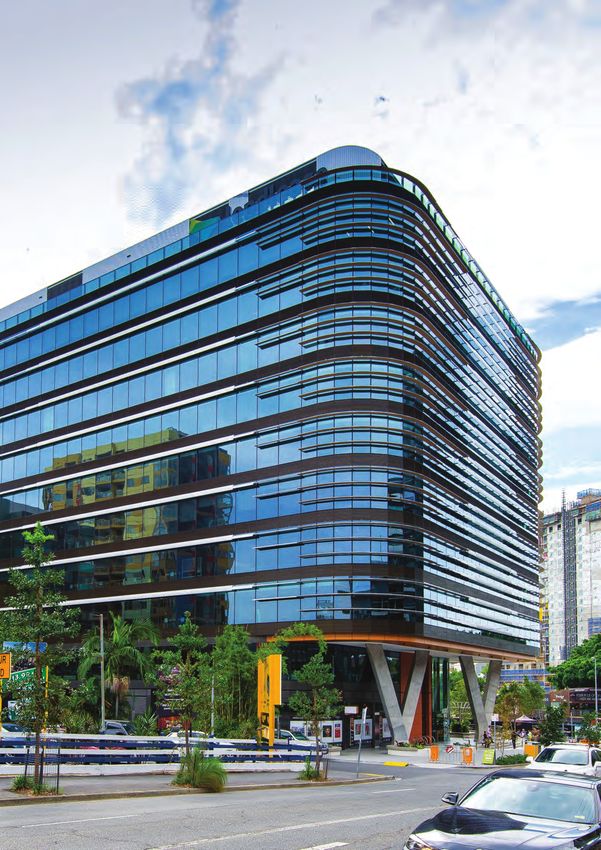
Image: 464 St Kilda Rd,
Melbourne VIC
ABACUS PROPERT Y GROUP | SECURIT YHOLDER REVIEW 201820 Contact us If you require any assistance with altering any of your investment details please contact the Abacus Registry on 1300 139 440 (free call) or via online enquiry at abacus@boardroomlimited.com.au. You can also mail correspondence to GPO Box 3993 Sydney NSW 2001. All other enquiries relating to Abacus Property Group, including any feedback, complaints or suggestions on how we can improve our service, can be directed to Investor Relations: Investor Relations Abacus Property Group Level 34 Australia Square 264 – 278 George Street, Sydney NSW 2000 enquiries@abacusproperty.com.au Phone number: 1800 253 860 (free call) or +612 9253 8600 (outside Australia) Key events 15 NOVEMBER 2018 2018 Annual General Meeting 28 DECEMBER 2018 FY19 half year distribution – ex-distribution date 31 DECEMBER 2018 FY19 half year distribution – record date 15 FEBRUARY 2019 HY19 results announcement 28 FEBRUARY 2019 Payment of FY19 half year distribution 27 JUNE 2019 FY19 full year distribution – ex-distribution date 28 JUNE 2019 FY19 full year distribution – record date 16 AUGUST 2019 FY19 results announcement 30 AUGUST 2019 Payment of FY19 full year distribution 15 NOVEMBER 2019 2019 Annual General Meeting Securities exchange listing Abacus is listed on the Australian Securities Exchange under the listing code ABP.
It is recommended that this securityholder review should be read in
conjunction with the Annual Financial Report of Abacus Trust, Abacus
Group Projects Limited, Abacus Income Trust, Abacus Storage
Property Trust and Abacus Storage Operations Limited as at 30 June
2018. It is also recommended that the review be considered together
with any public announcements made by the Abacus Property Group in
accordance with its continuous disclosure obligations arising under the
Corporations Act 2001.
Designed and produced by teamscope.com.au
Abacus Property Group
Level 34 Australia Square
264-278 George Street
Sydney NSW 2000
T +61 2 9253 8600
F +61 2 9253 8616
E enquiries@abacusproperty.com.au
www.abacusproperty.com.au
You can also read