Interact Connect Analyse - Quantifying the impact of interactivity in digital out-of-home advertising - Ultraleap
←
→
Page content transcription
If your browser does not render page correctly, please read the page content below
Interact
 Connect
 Analyse

Quantifying the impact
of interactivity in digital
out-of-home advertising
Executive
summary                                                                                                                                                       “Creative and engaging campaigns allow audiences
                                                                                                                                                              not only to observe but to interact, be entertained
                                                                                                                                                              and build relationships with brands in real life.“
In 2018, spend on digital out of home (DOOH) advertising overtook                                                                                             J C Decaux3
traditional out of home advertising.1 But with digital screens everywhere,
advertisers are now looking for new ways to connect with customers.

Almost every prediction points to interactive and experiential advertising
as a key trend in DOOH.² Given the dramatic effect interactivity has had in
other channels (such as mobile and TV advertising), it would be expected
that the impact of interactive digital signage would also be positive.

There are very few studies, however, that analyse the impact of interactive
versus static digital signage. Since interactive digital signage typically
involves additional hardware, software or creative development costs, this
is an important piece of information.

Our research into the impact of interactivity in a DOOH installation at
a major movie theater in downtown Los Angeles demonstrates that
interactive significantly outperforms static digital signage. This is true across
a range of measures, from dwell time all the way through to purchase
intent and ROI.

We also found that interactive DOOH generates a new form of audience
data. This is the length of time users’ hands are interacting with content,
which we term interaction time. It’s a near-field measurement that can
be used in conjunction with far-field measurements generated by other
audience measurement platforms (such as Quividi) to give a more nuanced
picture of audience engagement.

Millennials are digital natives looking for richer ways to connect with
brands. Our research shows that in DOOH, interactive and experiential
campaigns can be proven to translate into meaningful commercial results.

Saurabh Gupta
Director of Product, Ultraleap

1
    https://oohtoday.com/2019-ooh-trends-to-watch-out-for/
2
 See for example, https://www.dooh.com/dooh-updates/is-2019-the-year-for-digital-ooh/, https://oohtoday.com/2019-ooh-trends-to-watch-out-for/, https://www.
emcoutdoor.com/blog/2018/12/5-important-trends-out-of-home-2019/
3
    https://www.jcdecaux.com/brands/trends-out-home
Study
background
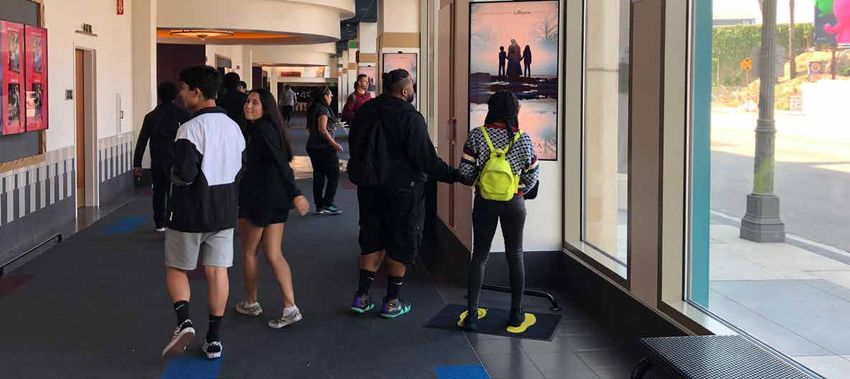
              The study took place in a top-tier, 14-screen multiplex
              cinema in downtown Los Angeles. Ultraleap installed
              two interactive digital signage installations and one
              static installation in one of the corridors leading to the
              auditoriums.
  2
      C
          1   The two test systems combined an LCD screen and an
              interactive STRATOSTM Inspire haptic module. The control
              screen (C on the image to left) displayed a static version of
              the content that users could not interact with.

              Traffic volumes varied. There were times of high traffic but
              also times when there was no one in the corridor at all.
              It is important to consider this when comparing the data
              to other contexts such as malls.

                                                                                   STRATOS Inspire haptic module
                                                       Screen 2
                                                      Interactive
                                                                                   STRATOS Inspire incorporates both hand tracking and
                                                                                   mid-air haptics. Mid-air haptics is a “virtual touch”
                                                                                   technology that uses ultrasound to create the sensation of
                                                                                   touch in mid-air.

                                                                                   The haptic module transforms 2D digital screens into 3D
                                                             Control screen
                                                              Static Digital       interactive canvases by creating tactile interaction zones
                                                                                   in mid-air. Customers can use 3D gestures to interact
                                                                                   with content and experience haptics on their bare hands.
                                                                                   No handheld devices or wearables are required and
                                                                                   customers do not need to be in contact with any surface.

                                                                      Screen 1
                                                                     Interactive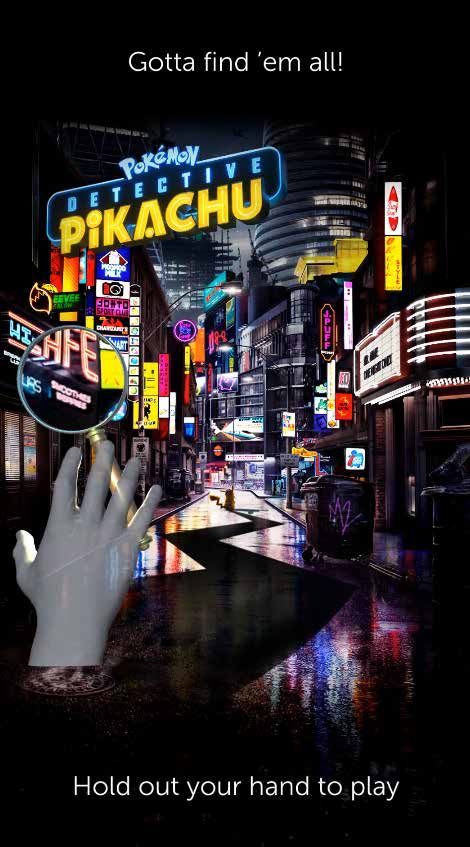
Audience
data
During the 2 months of the study over 150,000 moviegoers had the chance to
experience interactive digital signage advertising the live releases Shazam!, The Curse
of La Llorona and Pokémon: Detective Pikachu. Each had approximately a 3-week run
(2 weeks pre-release plus 1 week post-release).

The audience was diverse, with a roughly 50-50 split between genders and a mix of
individuals, groups of friends and families. Around 65% of the audience was under 35.⁴

            Data on audience engagement was collected through:

            • Quividi’s Audience Measurement Platform measuring views and
              attention time⁵

            • Bespoke analytics software built into the experience that measured
              interaction starts/stops and the duration of interactions with the
              content

            • Survey of 316 moviegoers conducted by independent research
              company ERm Research. This compared the engagement of a test
              group (who were exposed to interactive digital signage) to a control
              group (who were only exposed to static digital signage). It also
              explored the reactions of those who recalled interacting with the
              interactive digital signage installations in greater depth. N.B. The ERm
                                                                                                                                                                                                          153,000
              survey investigated Detective Pikachu and Shazam! only.⁶                                                                                                                           The number of moviegoers exposed to our
                                                                                                                                                                                                interactive movie posters over the 2 months
            • User observation and intercept interviews by the Ultraleap team on                                                                                                                               of the study.
              the ground

Gender split, age distribution and demographic profile based on ERm survey (see below). Mix of individuals, groups and families based on user observation and intercept interviews by the
4

Ultraleap team on the ground.

5
    See https://quividi.com/.

6
 ERm Research (see http://www.ermkt.com/) collected contact information from moviegoers at the multiplex cinema on Thursday, May 2 and Saturday, May 4, 2019. Based on the movie/
showtime that each moviegoer attended, they were determined to be test sample (those seeing movies in auditoriums 2-7, who walked past the Ultraleap displays to get to their movie) or
control sample (those in auditoriums 8–14 or 1, who did not). The next day, moviegoers received an invitation by email to complete a follow-up survey in exchange for a $10 Amazon gift card.
The small group of moviegoers who were in the control sample but reported seeing the Ultrahaptics displays were excluded from the sample entirely. In all, 316 moviegoers completed the
survey (129 test and 182 control). Data in the test and control conditions were balanced to ensure the groups were demographically and psychographically equivalent.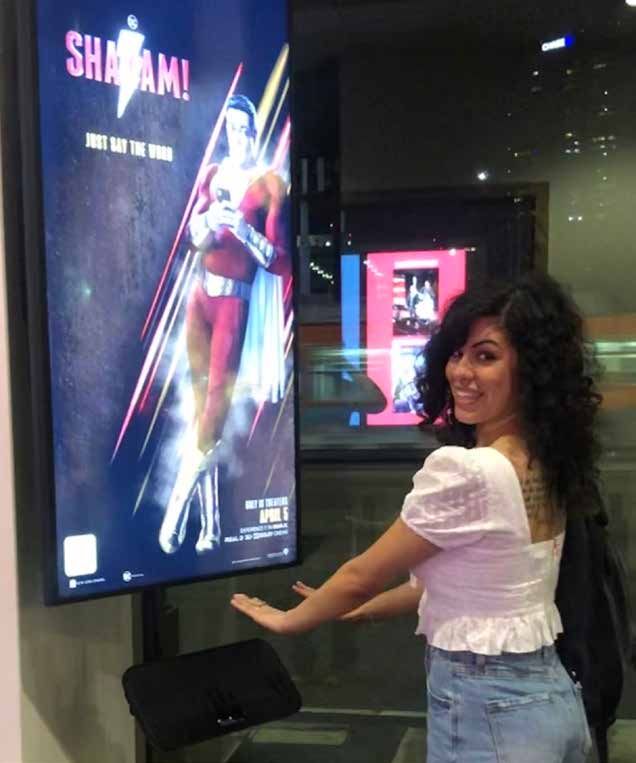
Detective Pikachu
Pokémon: Audience
Audience analytics analytics
Detective Pikachu
Conversion ratio
Detective Pikachu Audience analytics37%
Static poster
Conversion ratio
Interactive posters 68%
Static poster 37% Interactive posters 68%
1.9x
Detective Pikachu is part of the Pokémon franchise. Pokémon is the highest-grossing
1.9x
Average OTS per day: 1906 Average OTS per day: 1227
Average watchers per day: 699 Average watchers per day: 839
entertainment franchise of all time,⁷ and characters such as Pikachu are known and loved
worldwide.
Dwell time
Average OTS per day: 1906 AttentionAverage
time OTS per day: 1227
Average watchers per day: 839
Attraction ratio
In Ultraleap’s interactive digital signage, users were tasked to use the onscreen magnifying glass Average watchers per day: 699
to discover objects in a Ryme City streetscape. The magnifying glass tracked the user’s hand as
Static poster 5.6s Static poster 2.0s Static poster 37%
they searched for clues. An electric haptic sensation (mimicking Pikachu’s electric attack in the
Dwell time Attention time Attraction ratio
franchise) signified success. Interactive posters 6.2s Interactive posters 2.9s Interactive posters 46%
+11 %
5.6s
+45%
Static poster
2.0s
+24 %
The aim was to find three objects and complete the experience as quickly as possible. The final Static poster Static poster 37%
screen showed how long it took the user to find all the objects and congratulated them on Interactive posters 6.2s Interactive posters 2.9s Interactive posters 46%
completing the experience. Data measured using Quividi’s Anonymous Video Analytics Platform comparing data between the static and interactive posters installed by Ultraleap.
OTS = opportunity to see
+11 % results
Survey +45% +24 %
Survey results
The control group walked past static DOOH advertising Detective Pikachu to get to their movie.
Data measured using Quividi’s Anonymous Video Analytics Platform comparing data between the static and interactive posters installed by Ultraleap.
The test
OTS group walked
= opportunity to see past interactive DOOH advertising Detective Pikachu to get to their movie.
Survey results
Unaided "top-of-mind" Purchase intent for Impact of interactive DOOH
The control group walked past static DOOH advertising
Q2 Detective Pikachu to get to their movie.
awareness
The of Pikachu
test group walked
Q1
Pikachu
past interactive DOOH advertising Detective Pikachu to get toon positive
their movie.
Q5
feelings about the
brand
31% 46%
+43
Control group Control group
Unaided "top-of-mind" Purchase intent for Impact %
of interactive DOOH
awareness
Test group 47%Q1
of Pikachu Pikachu
Test group Q2
63% 18%the
on positive feelings about
Q5
brand said it made
+37%
them feel much
+52 %
more positive
31% 46%
+43 %
Control group Control group about the brand
5
Test group Q3 47% Test group
Q4 63% 18%
Unaided ad recall Aided ad recall said it made
+37%
them feel much
+52 %16%
more positive
6 about the brand
5
Control group Control group 34%
Q3 Q4
Unaided ad recall Aided ad recall 25%
Test group
36% Test group 44% 6
said it made them
feel somewhat
more positive about
the brand
Control group 16% Control group 34%
2.25 x
Test group
36%
+29 % Test group 44%
25%
said it made them
feel somewhat
more positive about
the brand
Data from ERm Research independent study measuring 316 moviegoers’ response.
2.25 x +29 %
Q1: Please list some movies that you know are currently playing (or will be playing soon) in theaters near you. Q2: How interested are you in seeing each of these films in a theater? If you have already
seen a particular movie, please tell how interested you are in seeing that movie again. (“Definitely interested” + “Probably interested”). Q3: To the best of your memory, what movies were featured as
part of the advertising you saw in the lobby/common areas of the theater? Q4: Below is a list of movies you may or may not have seen advertised at the theater. To the best of your memory, which of the
following did you see an advertisement for in the lobby/common areas of the theater? Q5: How did the Detective Pikachu haptic display impact your feelings about the people behind Detective Pikachu
(The Pokémon Company and Warner Bros)?
Data from ERm Research independent study measuring 316 moviegoers’ response.
Q1: Please list some movies that you know are currently playing (or will be playing soon) in theaters near you. Q2: How interested are you in seeing each of these films in a theater? If you have already
seen a particular movie, please tell how interested you are in seeing that movie again. (“Definitely interested” + “Probably interested”). Q3: To the best of your memory, what movies were featured as
part of the advertising you saw in the lobby/common areas of the theater? Q4: Below is a list of movies you may or may not have seen advertised at the theater. To the best of your memory, which of the
following did you see an advertisement for in the lobby/common areas of the theater? Q5: How did the Detective Pikachu haptic display impact your feelings about the people behind Detective Pikachu
(The Pokémon Company and Warner Bros)?
https://movieweb.com/pokemon-franchise-highest-grossing-all-time/
7
Interaction and engagment                                                                                                                                       friends searched for hidden objects together. There was an 11% increase in dwell time and a
                                                                                                                                                                45% increase in attention time over the static display. This led to a 24% increase in attraction
The interactive digital signage had almost double the conversion rate (i.e. the number of                                                                       ratio.
passers-by who glanced at the content) of the static digital signage. These conversion rates are
also significantly higher than the industry benchmark of 35%.⁸                                                                                                  Brand Impact

This was partly down to effective and innovative methods to draw users in and communicate                                                                       Getting users engaged with content is key for any advertising campaign but the main aim is, of
that the digital signage display was interactive. These included footprints on the floor and a                                                                  course, for users to take away the key messages.
designed on-screen “call to interact” that displayed animated “ghost” hands to communicate
and entice the moviegoer to interact with content.                                                                                                              The interactive Detective Pikachu poster dramatically increased brand awareness (+52%),
                                                                                                                                                                advertisement recall (2.25x) and purchase intent (+37%). Among those who interacted,
Our qualitative research also suggested the “honeypot” effect had an impact. This effect occurs                                                                 interactive digital signage increased positive feelings about the Pokémon brand by 43%.
when some users are interacting with interactive digital signage, which catches the attention of
observers. Curiosity then leads to further interactions.                                                                                                        Visitors commented, in particular, on the appeal of being able to “feel” Pikachu’s lightning
                                                                                                                                                                attacks and connect with a loved character in a new and tangible way.
The gamification was easily understood and effective at creating engagement. It was observed
to be a very social experience, with crowds forming around the interactive digital signage as

                                                                                                                                                                                                                    “It … felt more realistic, like
                                                                                                                                                                                                                    I was feeling something real
                                                                                                                                                                                                                    while making the action.”

                                                                                                                                                                                                                    “It feels like Pikachu!”
                                                                                                                                                                                                                    Visitor quotes

https://www.researchgate.net/publication/251231398_Audience_Measurement_of_Digital_Signage_Quantitative_Study_in_Real-World_Environment_Using_Computer_Vision
8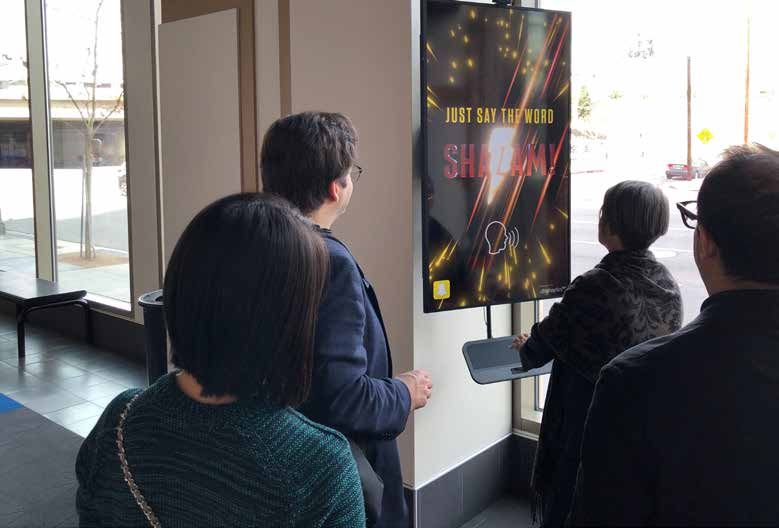
Shazam!
The second DOOH installation advertised Shazam!, a superhero movie based on DC Comics
character Shazam. The interactive digital signage made users feel as though they themselves
had Shazam’s superpowers by enabling them to shoot electricity from their fingertips.
                                                                                                    4.8x
                                                                                                    increase in advertisement recall
When the user placed their hand into the interaction zone they saw a virtual hand on-screen         for Shazam! interactive DOOH
tracking their hand movements. Electricity fired out of the virtual hand and destroyed objects
(the Shazam logo) on screen. At the same time, users felt an “electric” sensation on their actual
                                                                                                    compared to static DOOH
hands.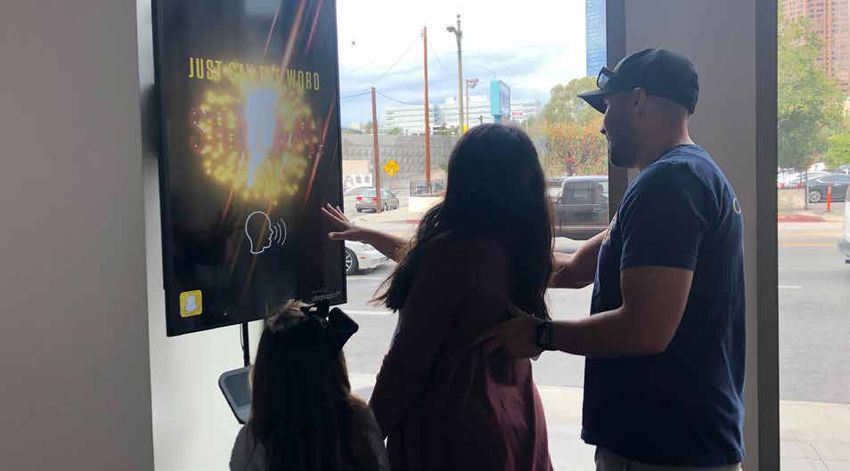
+33 % +74% +27 %
Shazam!
Audience analytics Survey
Survey results results
Data measured using Quividi’s Anonymous Video Analytics Platform comparing data between the static and interactive posters installed by Ultraleap.
OTS = opportunity to see
Audience analytics
The control group walked past static DOOH advertising Shazam! to get to their movie.
Conversion ratio The test group walked past our interactive DOOH advertising Shazam! to get to their movie.
Static poster 35% Interactive posters 69% Unaided "top-of-mind"Q1 Purchase intent for Impact of interactive DOOH
awareness of Shazam! Shazam! Q2 on positive feelings about the
1.9x 25% 54%
brand Q5
+43 %
Control group Control group
Test group 40% Test group 62% 25%
Average OTS per day: 2089 Average OTS per day: 1236 said it made
+15 %
them feel much
+60 %
Average watchers per day: 744 Average watchers per day: 853 more positive
about the brand
Q4
Dwell time Attention time Attraction ratio Unaided ad recall
Q3
Aided ad recall
Static poster 5.1s Static poster 1.9s Static poster 37% Control group 6% Control group 19%
18%
Interactive posters 6.8s Interactive posters 3.3s Interactive posters 47% Test group
29% Test group 36% said it made them
feel somewhat
more positive about
the brand
+33 % +74% +27 % 4.8x +89 %
Data measured using Quividi’s Anonymous Video Analytics Platform comparing data between the static and interactive posters installed by Ultraleap.
OTS = opportunity to see
Data from ERm Research independent study measuring 316 moviegoers’ response.
Q1: Please list some movies that you know are currently playing (or will be playing soon) in theaters near you. Q2: How interested are you in seeing each of these films in a theater? If you have already
Survey results seen a particular movie, please tell how interested you are in seeing that movie again. (“Definitely interested” + “Probably interested”). Q3: To the best of your memory, what movies were featured as
part of the advertising you saw in the lobby/common areas of the theater? Q4: Below is a list of movies you may or may not have seen advertised at the theater. To the best of your memory, which of the
following did you see an advertisement for in the lobby/common areas of the theater? Q5: How did the Shazam! haptic display impact your feelings about the people behind Shazam! (DC Comics and
The control group walked past static DOOH advertising Shazam! to get to their movie. Warner Bros)?
The test group walked past our interactive DOOH advertising Shazam! to get to their movie.
Unaided "top-of-mind"Q1 Purchase intent for Impact of interactive DOOH
awareness of Shazam! Shazam! Q2 on positive feelings about the
brand Q5
25% 54%
+43 %
Control group Control group
Test group 40% Test group 62% 25%
said it made
+15 %
them feel much
+60 %
more positive
about the brand
Q3 Q4
Unaided ad recall Aided ad recall
Control group 6% Control group 19%
18%
Test group
29% Test group 36% said it made them
feel somewhat
more positive about
the brand
4.8x +89 %
Data from ERm Research independent study measuring 316 moviegoers’ response.
Q1: Please list some movies that you know are currently playing (or will be playing soon) in theaters near you. Q2: How interested are you in seeing each of these films in a theater? If you have already
seen a particular movie, please tell how interested you are in seeing that movie again. (“Definitely interested” + “Probably interested”). Q3: To the best of your memory, what movies were featured as
part of the advertising you saw in the lobby/common areas of the theater? Q4: Below is a list of movies you may or may not have seen advertised at the theater. To the best of your memory, which of the
following did you see an advertisement for in the lobby/common areas of the theater? Q5: How did the Shazam! haptic display impact your feelings about the people behind Shazam! (DC Comics and
Warner Bros)?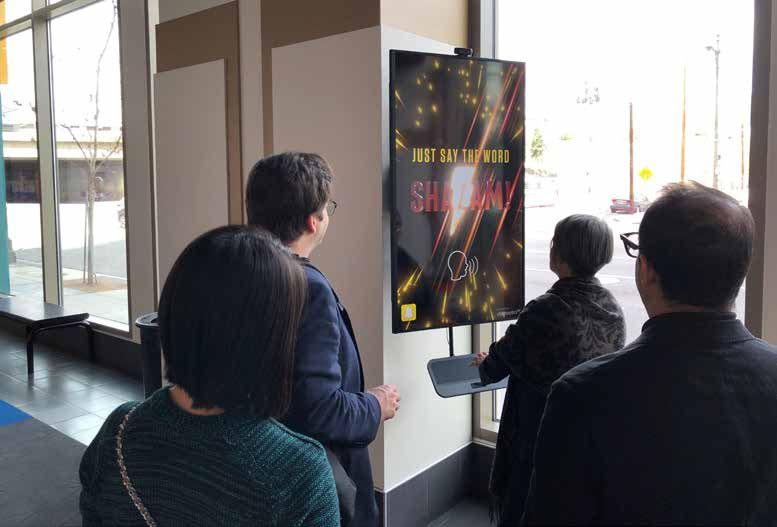
Interaction and Engagement                                                                          It was noticeable that the uplift in purchase intent for Shazam! attributable to interactive digital
                                                                                                    signage was less pronounced than for Detective Pikachu (+15% compared to +37%).
The impact of interactivity was significant, with twice as many people looking at the interactive
digital signage compared to the static version. Dwell time increased by 33%, leading to a 74%       We attribute this to the timing of the ERm study, which took place shortly before the Detective
increase in attention time and a 27% increased attraction ratio.                                    Pikachu opening but some time after the Shazam! opening. By the time of the ERm study other
                                                                                                    marketing activity, reviews and word-of-mouth recommendations had already raised purchase
Users were observed convincing friends and family to try the experience after enjoying it           intent for Shazam!, whereas with Detective Pikachu much of this was yet to happen.
themselves. Sometimes this effect was so strong that queues formed. Young children would
often continue to engage repeatedly until their parents (sometimes physically!) pulled them         This meant that for the ERm survey group, the Shazam! interactive digital signage had less
away.                                                                                               opportunity to make an impact on purchase intent than Detective Pikachu did.

Brand Impact

Similarly to Detective Pikachu, the Shazam! interactive poster increased brand awareness
(+60%), advertisement recall (4.8x) and purchase intent (+15%).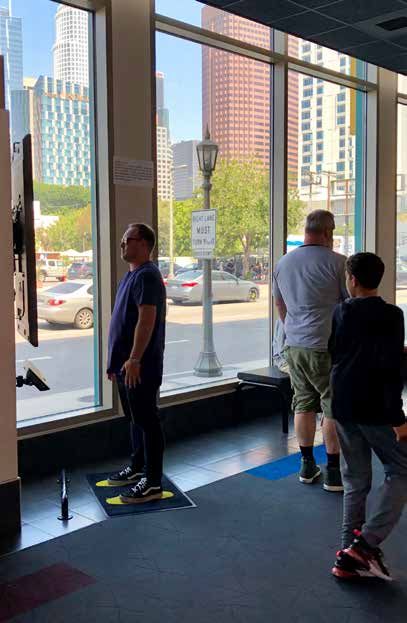
The Curse of
La Llorona
The final installation advertised horror movie The Curse of La Llorona (the “weeping woman”).
The movie is based on a famous Latin American folk story.
                                                                                                “It was cool and creepy, it gave me
When users placed their hand into the interaction zone they saw a virtual hand on-screen                  goosebumps.”
tracking their hand movements. They could move “their” hand through water on-screen.                 Quote from child visitor telling his mum to try it

The water was visibly disturbed by their hand movements and we simulated the sensation of
feeling water on your hands. The sound of the water was also audible. After 20 seconds a jump
scare appeared – the face of the “weeping woman” alongside a loud scream.

In comparison to the fully gamified Detective Pikachu poster, The Curse of La Llorona was an
open-ended experience that users could dive in and out of. They did not have to play for a
specified amount of time before gaining from the experience.
Curse of La Llorona
Audience analytics
Interaction and Engagement
Audience analytics
The La Llorona experience had a different type of interaction to either Detective Pikachu or
Conversion ratio Shazam!. Despite the fact that the interaction design was relatively simple, the data was still
strong with 1.8 times as many people glancing at the interactive digital signage compared to
Static poster 38% Interactive posters 67% the static digital signage, and increases of 21% in dwell time, 42% in attention time and 19% in
attraction ratio.
1.8 x We observed users interacting with the DOOH installation together, making hand gestures to
each other. The content of the interactive poster also sparked conversation about the folklore
Average OTS per day: 2258 Average OTS per day: 1421
Average watchers per day: 960
of La Llorona and demonstrably generated excitement around the film.
Average watchers per day: 863
Dwell time Attention time Attraction ratio
Static poster 5.2s Static poster 1.9s Static poster 37%
Interactive posters 6.3s Interactive posters 2.7s Interactive posters 44%
+21 % +42 % +19 %
Data measured using Quividi’s Anonymous Video Analytics Platform comparing data between the static and interactive posters installed by Ultraleap. (N.B The ERm survey into
brand recall, ad recall, purchase intent and brand favourability did not include The Curse of La Llorona.)
OTS = opportunity to seedigital signage
What audiences
Recall of interactive compared Rating of the interactive DOOH
to static digital advertising Q1 experience Q2
Static DOOH 2% 3%
95 %
thought of our
(control group)
2%
Fair
Poor
38%
Interactive DOOH
(test group)
36% Positive
Excellent
18x
interactive DOOH 34%
Good Very good
23%
Very good
The majority of moviegoers found interactive DOOH engaging, unique and modern. Most
Likelihood of selecting a movie Q3 Improvement of experience
theatre with interactive DOOH with interactive DOOH Q4
enjoyed the element of surprise, with some people describing the installations as being “from
14% 16%
the future”. They appreciated how family-friendly the interactive posters were and even those
+45 % +54 %
Greatly
Much more improved
who did not interact themselves recalled seeing kids having fun with the installations. likely
5
When asked what movies featured as part of the digital displays at the cinema, 36% of the test 6
group (who had been exposed to our interactive digital signage) specifically recalled Detective
Pikachu and/or Shazam!. 30% 1
38%
Somewhat more Somewhat
likely improved
In comparison, only 2% of the control group (only exposed to static digital signage) recalled
these movies—a dramatic 18-fold increase in recall.⁹ Those who interacted with the interactive DOOH agreed
or somewhat agreed: Q5
“It was very entertaining and
a fun, interactive way to pass
the time before the movie.”
Visitor quote
91 % 85 % 63% 82%
They're engaging They're unique They improve the They're modern/
experience of going cutting-edge
to the movies
61 % 57% 64 % 48 %
They make me They make me They make me
more likely to talk They're immersive more likely to see a
more likely to want
to find out about a to friends about a movie
movie movie
Data from independent study conducted by ERm Research measuring 316 moviegoers’ response to the interactive posters. Based on the movie/showtime that each moviegoer
attended, they were determined to be test sample (those seeing movies in auditoriums 2-7, who walked past the interactive posters to get to their movie) or control sample (those
in auditoriums 8–14 or 1, who did not). Data in the test and control groups were balanced to ensure the groups were demographically and psychographically equivalent.
Participants in the test group who recalled the interactive displays and had interacted with them were then asked further questions about their impact.
Q1: To the best of your knowledge what movies were featured as part of the digital displays? Q2: Based on your experience/based on watching others, how would you rate the haptic
display(s)? Q3: When selecting a movie theater in the future, would you be more likely to select a movie theater that featured haptic display(s)? Q4: What impact would you say the haptic
display(s) had on your experience at the theater overall? Q5: How much do you agree with the following statements about haptic displays?
All data from ERm Research survey measuring 316 moviegoers’ response.
9Interaction time Validating the impact of mid-air haptics
A new way of measuring how actionable STRATOS Inspire includes both hand tracking and mid-air haptics. While the majority
of the pilot explored the value of the two technologies working together, we also
a campaign is used the interaction time metric to evaluate mid-air haptics over and above the use
of hand tracking alone.
Measuring the impact of DOOH is a challenge, and the data story has to solve three key metrics This was tested by operating the interactive DOOH experiences with and without
(the 3As): mid-air tactile effects. Users could still move their hands around on-screen and
interact with the DOOH experience. However, they only received visual feedback and
1. Addressable: Are the right messages being shown to the right audiences? no haptic feedback on their hands.
2. Actionable: Are they noticing and reacting to this message?
3. Attributable: Did the message lead to a downstream sale or action? A previous study had strongly suggested that mid-air haptics adds significant value
to hand tracking in interactive digital signage.10 This was validated by the pilot, which
When audiences are interacting with rather than passively observing digital signage, it becomes found a 23% increase in average interaction time for The Curse of La Llorona when
possible to measure more accurately how actionable a campaign was. haptic feedback was included (7.9 seconds versus 6.4 seconds) and a 20% increase in
interaction time for Detective Pikachu (24 seconds versus 20 seconds).
Our interactive posters had bespoke analytics software built into the experience that measured
interaction starts/stops and the duration of interactions with the content. Significantly, the
23%
interaction times measured were consistently longer than the attention time audience data
analytics captured using the Quividi Audience Measurement Platform (as outlined earlier in the
whitepaper).
increase in
This suggests that for interactive digital signage installations, a near-field measurement of
interaction time can be usefully deployed in conjunction with far-field measurements such as interaction time
attention time to give a richer and more nuanced picture of audience engagement. for The Curse of La
Llorona when users
Attention time metric compared to interaction time metric
experienced haptic
feedback
See https://www.ultraleap.com/company/news/blog/boost-customer-engagement-study/
10ROI analysis
Over their three-week run this equates to the following directional estimate of sales uplift for
Shazam! and Detective Pikachu, attributable to interactive compared to static digital signage.
Directional estimate of sales uplift attributable to interactive
DOOH over 3-week campaign
Detective Pikachu
Screen 1 (7,940 watchers total) $12,297
Accurately calculating ROI for digital out-of-home campaigns is notoriously hard.11 Obviously
the most robust way to measure impact is actual sales uplift, but even then it can be difficult to Screen 2 (11,488 watchers total) $17,791
attribute an uplift to a specific DOOH campaign. Detective Pikachu average $15,044
In the ERm portion of our study, we measured the uplift in purchase intent attributable to Shazam!
interactive DOOH by comparing purchase intent between: Screen 1 (5,742 watchers total) $4,185
Screen 2 (13,875 watchers total) $10,112
1. The control group (only exposed to static DOOH)
Shazam! average $7,148
2. The test group (exposed to interactive DOOH)
There was a 37% increase in purchase intent within the test group for Detective Pikachu (63%
test vs 46% control), and a 15% increase in purchase intent in the test group for Shazam!
compared to the control group (62% test versus 54% control).
Using these figures, we can make a directional estimate of the sales uplift attributable to
interactive digital signage versus static digital signage.
~$15,000
Directional estimate of sales
Uplift in Average
uplift per interactive screen
purchase X
Number of
X cinema ticket =
Directional estimate over three-week Detective
impressions of sales uplift
intent price ($9.1112)
Pikachu campaign.
% who Directional estimate of sales (if all those who
expressed expressed a purchase intent went on to buy tickets)
purchase @1,000 @5,000 @10,000 @15,000
intent impressions impressions impressions impressions
Detective Pikachu
Control (not exposed to interactive DOOH) 46.0% $4,191 $20,953 $41,906 $62,859
Test (exposed to interactive DOOH) 63.0% $5,739 $28,697 $57,393 $86,090
Uplift (+36%) 17.0% $1,549 £7,744 $15,487 $23,231
Shazam!
Control (not exposed to interactive DOOH) 54.0% $4,919 $24,597 $49,194 $73,791
Test (exposed to interactive DOOH) 62.0% $5,648 $28,241 $56,482 $84,723
Uplift (+15%) 8.0% $729 $3,644 $7,288 $10,932
Average
Control (not exposed to interactive DOOH) 50.0% $4,555 $22,775 $45,550 $68,325
Test (exposed to interactive DOOH) 62.5% $5,694 $28,469 $56,938 $85,406
Uplift (+25%) 12.5% $1,139 $5,694 $11,388 $17,081
https://www.digitalsignagetoday.com/articles/ikea-measures-dooh-effectiveness-with-russ-outdoor/?utm_source=DST&utm_medium=email&utm_campaign=EMNA&utm_con-
11
tent=2019-10-22.
12
https://www.hollywoodreporter.com/news/average-price-a-movie-ticket-soars-911-2018-1178410Conclusion
Our pilot showed that
The findings from our pilot are among the first to demonstrate a clear impact on
ROI for interactive digital signage compared to static digital signage.
Until now, use of digital technology in out-of-home advertising has largely been
limited to the transition from paper posters to static digital displays. However,
interactivity makes
customer expectations and behaviours are constantly changing. Brands are now
searching for new ways to connect and engage more effectively with customers. digital out-of home
Interactivity is critical in enabling dialogue and emotional engagement, and
represents huge untapped potential for DOOH.
marketing:
There are practical reasons why DOOH has lagged behind other channels in its
implementation of interactivity. However, technological innovation means this
no longer needs to be the case. Technologies such as hand and body tracking,
haptics, face recognition, AI, IOT, voice UI, mobile integration and NFC all create
opportunities to transform DOOH installations from static and unresponsive
displays into engaging interactive experiences. More addressable
The companies who succeed in capitalizing on these opportunities will be the • ~2x increase in conversion rate
ones who leverage new technologies to evolve and create the next wave of the
• Up to 33% increase in dwell time
DOOH revolution.
More actionable
• Up to 74% increase in attention time
• 20-30% increase in attraction ratio
• 2.25-4.8x increase in advertisement recall
• 50-60% lift in brand awareness
More attributable
• 43% lift in brand favorability
• 45% were more likely to select a movie theater with
interactive digital signage
• $5,694 sales uplift per 5,000 impressions (directional
estimate)About Ultraleap The power of natural
interaction.
Shaped to your needs.
The future is a place where infinite worlds are at your fingertips. One where you interact
naturally and in 3D. One where you don’t need controllers.
Ultraleap was formed when Leap Motion and Ultrahaptics came together in 2019. We’ve united
the world’s most advanced hand tracking with the only haptic technology that creates the
sensation of touch in mid-air. We offer different levels of support depending on your needs and your
use-case.
We have a team of more than 150 spread across the world, with locations in Silicon Valley,
US and Bristol, UK. Our team includes world-leading experts in interface design, acoustics,
machine learning and computer vision. Hardware and software
Groundbreaking hand tracking and virtual touch hardware, SDKs/APIs and
detailed documentation.
Use-case development
Exploration, development and testing of use-cases for your application.
3D interaction design
Access to our in-house UX expertise in the unique challenges and
opportunities of spatial interaction.
Design tools and custom
integration support
Access to design tools and support from our engineering team in practical
integration and custom hardware design.https://www.ultraleap.com | info@ultraleap.com
UK: +44 117 325 9002 | US: +1 650 600 9916
Distributor (Worldwide): ARROW | www.arrow.com
Distributor (Japan): Cornes | ctl-comm@cornes.jp
Ultraleap gives no warranties in relation to the information disclosed hereunder and in particular (but without
limiting the foregoing) no warranty or representation, express or implied, is given by Ultraleap to you as to the
accuracy, efficacy, completeness, capabilities or safety of any information provided within this document.
Pokémon: Detective Pikachu is © 2020 Legendary and WBEI © 2020 Pokémon
Shazam! is © 2020 WBEI TM & © DC Comics
The Curse of La Llorona is © 2020 WBEI
UL-003064-WP Issue 3You can also read


