Accuracy of CAD/CAM Digital Impressions with Different Intraoral Scanner Parameters - MDPI
←
→
Page content transcription
If your browser does not render page correctly, please read the page content below
sensors
Article
Accuracy of CAD/CAM Digital Impressions with
Different Intraoral Scanner Parameters
Asher Chiu, Yen-Wei Chen *, Juri Hayashi and Alireza Sadr
 Department of Restorative Dentistry, University of Washington School of Dentistry, Seattle, WA 98195,
 USA; asherccc@uw.edu (A.C.); jurih@uw.edu (J.H.); arsadr@uw.edu (A.S.)
 * Correspondence: ywchen@uw.edu

 Received: 22 January 2020; Accepted: 17 February 2020; Published: 20 February 2020

 Abstract: The advancement of intraoral scanners has allowed for more efficient workflow in the
 dental clinical setting. However, limited data exist regarding the accuracy of the digital impressions
 produced with various scanner settings and scanning approaches. The purpose of this in vitro
 study was to compare the accuracy of digital impressions at the crown preparation margin using
 different scanning resolutions of a specific intraoral scanner system. An all-ceramic crown preparation
 of a mandibular first molar was constructed in a typodont, and a scan (n = 3) was created with
 an industrial-grade laboratory scanner (3Shape D2000) as the control. Digital impressions were
 obtained with an intraoral scanner (3Shape TRIOS 3) under three settings—high resolution (HR),
 standard resolution (SR), and combined resolution (SHR). Comparative 3D analysis of scans was
 performed with Geomagic Control X software to measure the discrepancy between intraoral scans
 and the control scan along the preparation finish line. The scan time and number of images captured
 per scan were recorded. Statistical analysis was performed by one-way ANOVA, two-way repeated
 measures ANOVA, Pearson’s correlation, and Dunnett’s T3 test (α = 0.05). Significant differences
 were observed for scan time and for number of images captured among scan resolution settings
 (α < 0.05). The scan time for the SR group was, on average, 34.2 s less than the SHR group and
 46.5 s less than the HR group. For discrepancy on the finish line, no significant differences were
 observed among scanning resolutions (HR: 31.5 ± 5.5 µm, SHR: 33.2 ± 3.7 µm, SR: 33.6 ± 3.1 µm).
 Significant differences in discrepancy were observed among tooth surfaces, with the distal surface
 showing the highest discrepancies. In conclusion, the resolution of the intra-oral scanner is primarily
 defined by the system hardware and optimized for default scans. A software high-resolution mode
 that obtains more data over a longer time may not necessarily benefit the scan accuracy, while the
 tooth preparation and surface parameters do affect the accuracy.

 Keywords: digital impression; CAD/CAM; accuracy; intraoral scanner; high resolution

1. Introduction
      Computer-aided design and computer-aided manufacturing (CAD/CAM) technology has
drastically changed the face of dentistry since it was introduced to the field in the 1980s [1]. In the early
stages of the application of CAD/CAM to dentistry, desktop scanners were used in dental laboratories to
digitize gypsum models before the milling and manufacturing of dental prosthetics [2]. Most recently,
the advancement of chairside CAD/CAM systems has provided a more efficient digital workflow in the
clinical setting [3]. In the last two decades, many commercially available intraoral scanners (IOS) have
been developed [4], and both in vivo and in vitro studies have examined the accuracy and precision
of various intraoral scanners compared to conventional impression materials and techniques [5].
The use of intraoral scanners as an alternative to conventional impression reduces patient discomfort,
is more environmentally friendly, and is easier for clinicians to manipulate without the risk of

Sensors 2020, 20, 1157; doi:10.3390/s20041157                                    www.mdpi.com/journal/sensors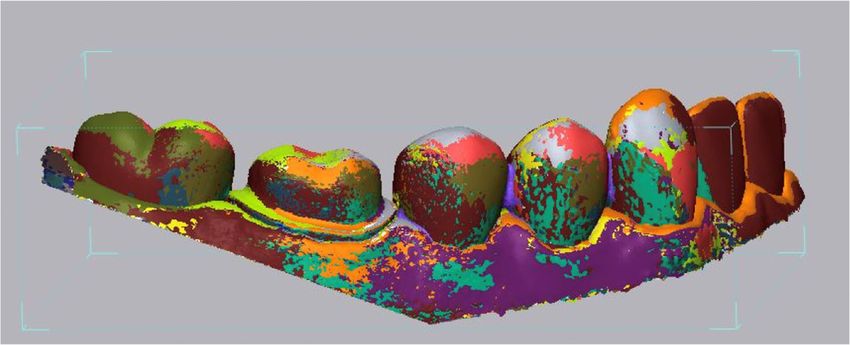
Sensors 2020, 20, 1157 2 of 9
damage or distortion [6]. Other advantages of intraoral scanning include real-time visualization and
magnification,
Sensors 2020, 20, automatic color-scanning for esthetic shade selection, and better patient compliance.
x FOR PEER REVIEW 2 of 10
Along with improved reliability and reproducibility in the technology, these advantages have increased
thevisualization
acceptance and andpopularity of digital
magnification, impression
automatic [7].
color-scanning for esthetic shade selection, and better
patient compliance.
The success of anyAlong
dentalwith improved
restoration reliability
in the and depends
long term reproducibility in the technology,
on its marginal adaptationthese
to the
advantages
existing tooth have increased
structure. the acceptance
Complications andaspopularity
such caries may of digital impression
arise around [7].
the margins as a result of
bacterialThe success of into
penetration any dental
leakingrestoration in theand
open margins longbiofilm
term depends on its marginal
accumulation on marginaladaptation to the
discrepancies.
existing tooth structure. Complications such as caries may arise around the
Therefore, obtaining an accurate impression from the tooth is critical in the fabrication process margins as a result of of
bacterial penetration
a dental restoration [8]. into leaking open margins and biofilm accumulation on marginal discrepancies.
Therefore,
Given that obtaining an accurate
intraoral scanningimpression
is the firstfrom
andthe tooth is foundational
therefore critical in the fabrication processdigital
step in chairside of a
dental restoration
workflow, the accuracy[8]. of intraoral scanners must be evaluated critically. To this end, we examined
Given that intraoral scanning is the first and therefore foundational step in chairside digital
the 3Shape TRIOS 3 intraoral scanner (3Shape, Copenhagen, Denmark) because it is one of the major
workflow, the accuracy of intraoral scanners must be evaluated critically. To this end, we examined
intraoral scanning systems currently on the market and has gained widespread use in restorative
the 3Shape TRIOS 3 intraoral scanner (3Shape, Copenhagen, Denmark) because it is one of the major
dentistry. In addition, several recent studies have shown that the TRIOS 3 is one of the most accurate
intraoral scanning systems currently on the market and has gained widespread use in restorative
intraoral scanners, in comparison to other intraoral scanning systems [9–11]. However, different scan
dentistry. In addition, several recent studies have shown that the TRIOS 3 is one of the most accurate
settings have
intraoral been suggested
scanners, by the
in comparison manufacturer
to other and a variety
intraoral scanning systems of [9–11].
scanning techniques
However, havescan
different been
applied depending on operator preferences. More specifically, the 3Shape TRIOS
settings have been suggested by the manufacturer and a variety of scanning techniques have been 3 user manual (ver.
2017) recommends the use of High Resolution (High res; also known as Zoom in
applied depending on operator preferences. More specifically, the 3Shape TRIOS 3 user manual (ver.some software versions)
when
2017)scanning
recommendscriticalthe
surfaces
use ofsuch
HighasResolution
crown preparation
(High res;margins
also knownin order to “capture
as Zoom in some areas that are
software
difficult to scan with higher amounts of details” (Figure 1). Data on the accuracy
versions) when scanning critical surfaces such as crown preparation margins in order to “capture of digital impressions
made
areasunder
that different scanning
are difficult to scanresolution
with highersettings
amountsare insufficient, however.
of details” (Figure 1).Theoretically, the Highofres
Data on the accuracy
function
digitalwould allow for
impressions madesuperior
underfinish line scanning
different accuracy to minimize
resolution marginal
settings arediscrepancy
insufficient, between
however.the
Theoretically,
preparation and the restoration.
High res function would
Clinically, allow for
however, superior
using the High finish
res line accuracy
function to minimize
requires additional
marginal discrepancy between the preparation
chair-time and can be disruptive to the provider’s workflow. and the restoration. Clinically, however, using the
High res function requires additional chair-time and can be disruptive to the provider’s workflow.
Figure 1. Depiction of the digital interface using the 3Shape TRIOS 3 scanner and software,
Figure 1. Depiction of the digital interface using the 3Shape TRIOS 3 scanner and software,
highlighting the High Resolution (High res) feature.
highlighting the High Resolution (High res) feature.
The purpose of this study was to investigate the difference in accuracy between digital
The purpose of this study was to investigate the difference in accuracy between digital impressions
impressions obtained using various scan resolution settings on the 3Shape TRIOS 3 scanner. These
obtained using various scan resolution settings on the 3Shape TRIOS 3 scanner. These data allowed
data allowed evaluation of the necessity of the TRIOS 3 scanner High res function as an essential step
evaluation of the necessity of the TRIOS 3 scanner High res function as an essential step in taking
in taking digital impressions for single unit fixed dental prostheses. Furthermore, we were most
digital impressions for single unit fixed dental prostheses. Furthermore, we were most interested in
interested in the accuracy of the scans at the cavosurface finish line on the prepared tooth, where
therestoration
accuracy ofmargin
the scans at the cavosurface finish line on the prepared tooth, where restoration margin
integrity is critical to the success and longevity of the restoration. The null
integrity is critical to the success and
hypothesis was that no significant longevity
difference of the restoration.
in discrepancy The null
was expected hypothesis
among differentwas that no
intraoral
significant
scanningdifference
resolutions.in discrepancy was expected among different intraoral scanning resolutions.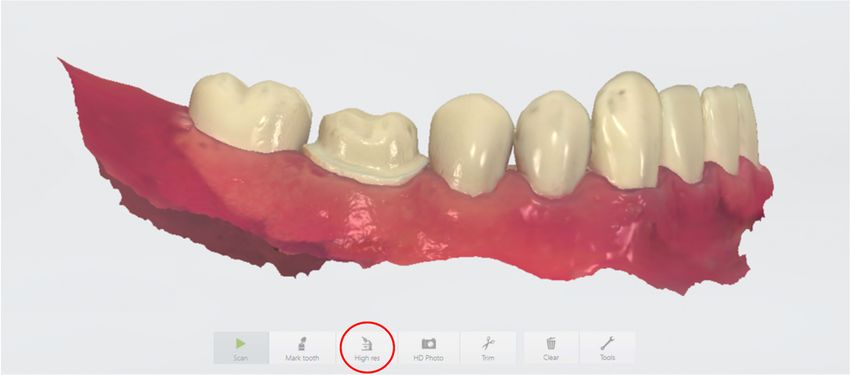
Sensors 2020, 20, 1157 3 of 9
2. Materials and Methods
2.1. Control Scan Preparation
A mandibular right first molar was prepared for an all-ceramic crown on a typodont (Columbia
Sensors 2020, 20, x FOR PEER REVIEW 3 of 10
Dentoform, Long Island City, NY, USA) according to conventional preparation guidelines (occlusal
reduction of at least ◦ ◦
1.5 mm, 4 to 8 taper, 1.5 mm axial reduction, 1.0 mm chamfer margin).
2. Materials and Methods
An industrial-grade laboratory scanner (D2000; 3Shape, Copenhagen, Denmark) with an accuracy of
2.1. 12836)
5 µm (ISO Control was
Scan Preparation
used to scan the typodont three times. The scan files were imported into a digital
inspection software, Geomagic
A mandibular Control
right first X by
molar was 3D Systems
prepared for an (Rock Hill,crown
all-ceramic SC, USA), and a master
on a typodont control file
(Columbia
Dentoform, Long Island City, NY, USA) according to conventional preparation
was created by taking the average of the three scans. The master scan was compared to the guidelines (occlusal
IOS scans to
measurereduction
dimensional of at least 1.5 mm, 4° to 8° taper, 1.5 mm axial reduction, 1.0 mm chamfer margin). An
differences between the default standard-resolution scan and the high-resolution
industrial-grade laboratory scanner (D2000; 3Shape, Copenhagen, Denmark) with an accuracy of 5
scan as μm
obtained using the High res function.
(ISO 12836) was used to scan the typodont three times. The scan files were imported into a digital
inspection software, Geomagic Control X by 3D Systems (Rock Hill, SC, USA), and a master control
2.2. Digital Impression Scan Preparation
file was created by taking the average of the three scans. The master scan was compared to the IOS
scans to measure
A 3Shape TRIOS 3dimensional differences
intraoral scanner was between
used to theproduce
default standard-resolution
digital impressions scan and the
under high-different
three
resolution scan as obtained using the High res function.
resolution settings (n = 20 for each group): half lower-arch scan under standard resolution (SR group),
half lower-arch
2.2. Digitalscan under
Impression Scanhigh resolution (HR group), and half lower-arch scan under standard
Preparation
resolution stitched with a high-resolution scan around the crown preparation margin (SHR group).
A 3Shape TRIOS 3 intraoral scanner was used to produce digital impressions under three
Calibration of the
different scannersettings
resolution was performed
(n = 20 for prior to scanning
each group): according
half lower-arch scantounder
the manufacturer’s guidelines.
standard resolution
Scanning with the TRIOS 3 scanner was performed according to the procedures
(SR group), half lower-arch scan under high resolution (HR group), and half lower-arch scan under recommended by
the user manual. The scans were performed by the same investigator on the same day to ensure
standard resolution stitched with a high-resolution scan around the crown preparation margin (SHR
group).The
consistency. Calibration
scan timeof the scanner
for each was performed
individual priorand
scan to scanning according
the number to the manufacturer’s
of images captured per scan
guidelines. Scanning with the TRIOS 3 scanner was performed according to the procedures
were recorded. All 60 scans were imported into Geomagic Control X as stereolithography (STL) files,
recommended by the user manual. The scans were performed by the same investigator on the same
and initial alignment was applied to superimpose the IOS scans onto the master scan (Figure 2).
day to ensure consistency. The scan time for each individual scan and the number of images captured
Following initial
per scan were alignment,
recorded. allAllscans
60 scanswere
were cropped
importedtointotheGeomagic
same size to eliminate
Control artifacts and further
X as stereolithography
optimize the uniformity of the scans. To measure the accuracy of scans
(STL) files, and initial alignment was applied to superimpose the IOS scans onto the master around the preparation
scan
margin,(Figure 2). Following
the finish line wasinitial alignment,
manually all scans
defined onwere cropped scan
the master to theusing
same size
theto“Curve”
eliminatefunction
artifacts of the
software.andA further
best-fitoptimize the uniformity
algorithm was applied of thetoscans. To measure
overlay each IOS the scan
accuracy of scans
to the masteraround
scan,theand the
preparation margin, the finish line was manually defined on the master scan using the “Curve”
3D Compared tool was used to measure deviation at 100 evenly spaced locations on the previously
function of the software. A best-fit algorithm was applied to overlay each IOS scan to the master scan,
definedandfinish
the line (Figure 3).
3D Compared toolIn addition,
was the finish
used to measure line was
deviation divided
at 100 evenlyinto four
spaced segments
locations based on
on the
tooth surface: mesial, distal, buccal, and lingual. The buccal and lingual surfaces
previously defined finish line (Figure 3). In addition, the finish line was divided into four segments each accounted for
29 of thebased
100 points
on toothonsurface:
the finish line,
mesial, and buccal,
distal, the mesial and distal
and lingual. The surfaces
buccal and each accounted
lingual surfaces for
each21 of the
accounted
100 points. for 29 of the 100for
The discrepancy points
each ontooth
the finish line, and
surface was thecalculated
mesial and distal
as thesurfaces
mean each accounted of each
discrepancy
for 21 ofsegment.
corresponding the 100 points. The discrepancy for each tooth surface was calculated as the mean
discrepancy of each corresponding segment.
Figure
Figure 2. 2. Superimposition
Superimposition of aofmaster
a masterscan
scanobtained
obtained from
fromthe 3Shape
the D2000
3Shape desktop
D2000 scannerscanner
desktop and and
intraoral scans from the 3Shape TRIOS 3 scanner using the Geomagic Control X software.
intraoral scans from the 3Shape TRIOS 3 scanner using the Geomagic Control X software. The imagesThe images
were aligned using both the Initial Alignment and Best-Fit Alignment functions. The colors depict
were aligned using both the Initial Alignment and Best-Fit Alignment functions. The colors depict
overlays of multiple scans.
overlays of multiple scans.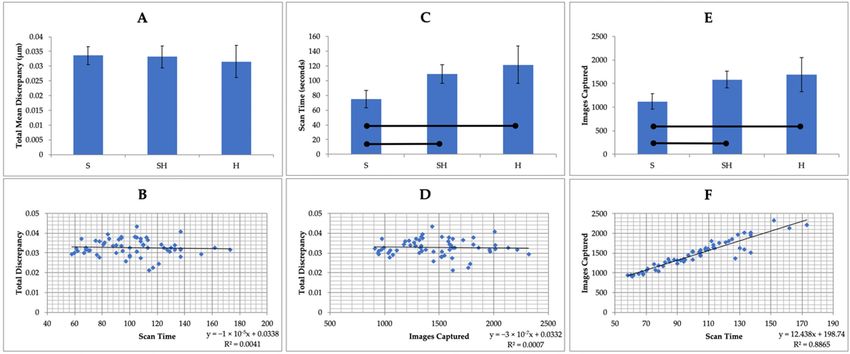
Sensors 2020, 20, 1157 4 of 9
Sensors 2020, 20, x FOR PEER REVIEW 4 of 10
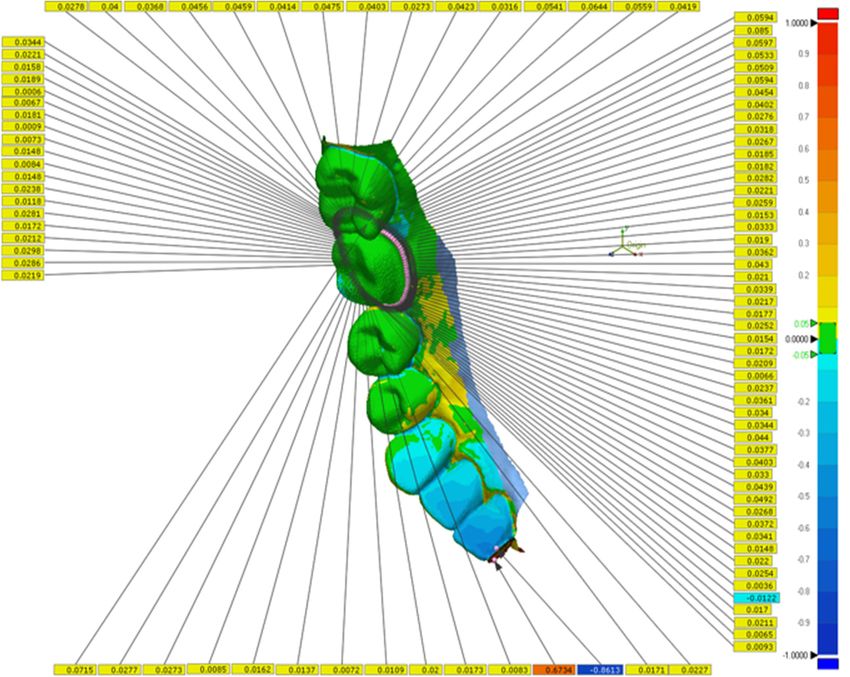
Figure3.3. Deviation
Figure Deviation between
between master
master scan
scan and
and intraoral
intraoral scan
scan measured
measured atat 100
100 evenly
evenly spaced
spaced points
points
along
along the
the preparation
preparation finish
finish line.
line. The
The specific
specific values
values of
of deviation
deviation along
along the
the finish
finish line
line are
are given
given in
in
yellow legends. The range of deviation across the entire half-arch scan is color graded
yellow legends. The range of deviation across the entire half-arch scan is color graded from −1 mm from −1 mm
(blue) to+1
(blue)to +1 mm
mm (red).
(red).
2.3. Statistical Analysis
2.3. Statistical Analysis
The number of samples to collect per group was determined by power analysis assuming a normal
The number of samples to collect per group was determined by power analysis assuming a
distribution and using data published for the closest set of 3Shape TRIOS 3 digital impressions by
normal distribution and using data published for the closest set of 3Shape TRIOS 3 digital
Ender et al. (2016) [12]. The total discrepancy, scan time, and number of images captured per scan
impressions by Ender et al. (2016) [12]. The total discrepancy, scan time, and number of images
were analyzed by one-way analysis of variance followed by multiple comparisons using Dunnett’s
captured per scan were analyzed by one-way analysis of variance followed by multiple comparisons
T3 test. Pearson correlations were calculated to correlate the total discrepancy with the scan time
using Dunnett’s T3 test. Pearson correlations were calculated to correlate the total discrepancy with
and number of images captured per scan. Discrepancies by tooth surface were analyzed by two-way
the scan time and number of images captured per scan. Discrepancies by tooth surface were analyzed
repeated-measure analysis of variance with scan resolution and tooth surface as factors, followed by
by two-way repeated-measure analysis of variance with scan resolution and tooth surface as factors,
pairwise comparisons using the Bonferroni correction. All analyses were performed using the Statistical
followed by pairwise comparisons using the Bonferroni correction. All analyses were performed
Package for Social Science (SPSS, Inc.) with the significance level set at α = 0.05.
using the Statistical Package for Social Science (SPSS, Inc.) with the significance level set at α = 0.05.
3. Results
3. Results
On average, the scan times for the SHR group and the HR group were 34.2 s and 46.5 s longer
On average,
compared to the SRthe scan times
group, for the The
respectively. SHRmean
groupnumber
and theofHR group
images were 34.2
captured persscan
and was
46.5 1124
s longer
for
compared to the SR group, respectively. The mean number of images captured per scan was
the SR group, 1584 for the SHR group, and 1692 for the HR group (Table 1). Scanning in high resolution 1124 for
the SR group, 1584 for the SHR group, and 1692 for the HR group (Table 1). Scanning
in both the SHR and HR groups took significantly longer (p < 0.05) and required that more images be in high
resolution
taken in boththe
to complete thescan
SHRthan
andfor
HRscanning
groups took significantly
in standard longer
resolution (p < (Figure
alone 0.05) and required
4C,E). that more
No correlation
images
was be taken
observed to complete
between the scan than
total discrepancy andfor scanning
scan time orinnumber
standard of resolution alone (Figure
images captured (Figure 4C, E).
4B,D).
No correlation was observed between total discrepancy and scan time or number
Scan time and number of images captured showed a strong linear correlation (Figure 4F). of images captured
(Figure 4B, D). Scan time and number of images captured showed a strong linear correlation (Figure
4F). Table 1. Mean scan time (seconds) and average number of images captured per scan.
Group Scan Time (s) Images Captured
SR 75.05 ± 11.7 1124 ± 161
SHR 109.25 ± 12.6 1584 ± 179
HR 121.5 ± 25.5 1692 ± 358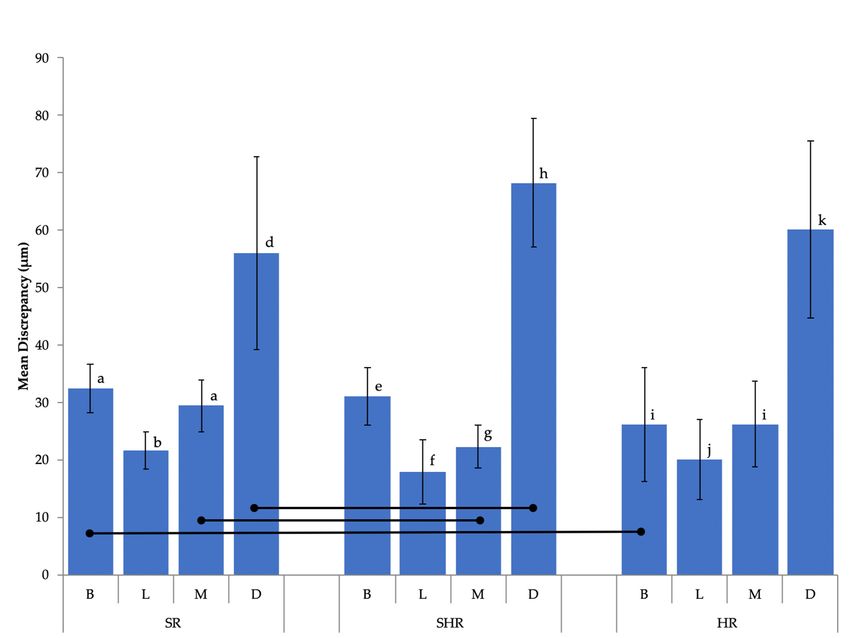
Group Total Discrepancy (μm)
SR 31.5 ± 5.5
SHR 33.2 ± 3.7
Sensors 2020, 20, 1157 5 of 9
HR 33.6 ± 3.1
Figure
Figure 4. 4.Comparison
Comparison of of total
total discrepancy, scan time,
discrepancy, scan time, and
andnumber
numberofofimages
imagescaptured
captured perper scan
scan
between
between scan resolutions:
scan resolutions:standard
standard resolution
resolution(SR),
(SR),standard
standardresolution
resolutionwith
withhigh
highresolution
resolutionaround
aroundthe
preparation marginmargin
the preparation (SHR),(SHR),
and high andresolution (HR). Statistical
high resolution analysis
(HR). Statistical was performed
analysis using one-way
was performed using
analysis
one-way of variance followed
analysis of variancebyfollowed
multiplebycomparisons using Dunnett’s
multiple comparisons T3 test. Pearson
using Dunnett’s T3 test.correlations
Pearson
were used to correlate
correlations were used total discrepancy
to correlate with scan time
total discrepancy withand
scannumber
time andof number
images captured. Horizontal
of images captured.
bars show significant differences (p < 0.05). (A): total discrepancy by scan resolution:
Horizontal bars show significant differences (p < 0.05). (A): total discrepancy by scan resolution: no no statistically
significant
statisticallydifference was
significant observed
difference wasin the overall
observed in thecomparison (p > 0.05).
overall comparison (B): (B):
(p > 0.05). no correlation
no correlation was
observed between
was observed total discrepancy
between and scan
total discrepancy andtime.
scan(C):
time.a significant difference
(C): a significant was observed
difference between
was observed
between
scan scan resolutions
resolutions in regard to in scan
regard to scan
time, withtime,
the HRwithgroup
the HR groupthe
having having the mean
longest longest mean
scan scan
time. (D):
notime. (D): no was
correlation correlation
observed wasbetween
observedtotalbetween total discrepancy
discrepancy and numbersand numbers
of images of images
captured captured
per scan.
(E):per scan. (E): a difference
a significant significant difference
was observed was observed
between between scan resolutions
scan resolutions in regardin regard to numbers
to numbers of
of images
images captured per scan, with the HR group showing the highest number. (F):
captured per scan, with the HR group showing the highest number. (F): a positive correlation was seena positive correlation
between scan time and number of images captured per scan; the longer the scan time, the more images
captured per scan.
In total, 60 scans from three experimental groups were evaluated. Their accuracy was defined
by measuring the discrepancy between the master scan and the IOS scans for the three scan groups.
Discrepancy at the preparation finish line was calculated as the average distance between the master
scan and the IOS scan at each of 100 points. For total discrepancy along the finish line, the HR group
showed the lowest discrepancy value of 31.5 ± 5.5 µm, followed by the SHR group (33.2 ± 3.7 µm) and
the SR group (33.6 ± 3.1 µm) (Table 2). These scanning discrepancies along the finish line were not
significantly different among the three groups (p > 0.05; Figure 4A).
Table 2. Total mean discrepancy (µm) by scan resolution.
Group Total Discrepancy (µm)
SR 31.5 ± 5.5
SHR 33.2 ± 3.7
HR 33.6 ± 3.1
Additional statistical analysis by two-way repeated-measures ANOVA suggested that while scan
resolution was not a significant factor (p > 0.05), significant differences were observed in discrepancy
among tooth surfaces (p < 0.05) (Figure 5). Digital scanning of the distal surface was significantly
less accurate when compared to that for the other three tooth surfaces in all three groups, with the
discrepancy ranging from 56.1 ± 16.8 µm (SR group) to 68.2 ± 11.3 µm (SHR group) (Table 3).scan resolution was not a significant factor (p > 0.05), significant differences were observed in
discrepancy among tooth surfaces (p < 0.05) (Figure 5). Digital scanning of the distal surface was
significantly less accurate when compared to that for the other three tooth surfaces in all three groups,
with the discrepancy ranging from 56.1 ± 16.8 μm (SR group) to 68.2 ± 11.3 μm (SHR group) (Table
3).
Sensors 2020, 20, 1157 6 of 9
Figure
Figure 5.
5. Mean
Mean discrepancy
discrepancy (μm)
(µm) along
along the
the preparation
preparation finish
finish line
line by
by tooth
tooth surface.
surface. Horizontal
Horizontal bars
bars
indicate
indicatesignificant
significantdifferences
differences(p(pSensors 2020, 20, 1157 7 of 9
scanning modes as well as the time needed to trim the margin, which would have further increased
the total amount of time required for scanning when using the combination resolution technique.
Our results also revealed that the tooth surface plays a significant role in the accuracy of
intraoral scans at the finish line. The lower accuracy observed for the distal surface suggests that
interproximal regions where distances between adjacent teeth are small may be challenging for
the current scanner, regardless of the scanning mode. A similar pattern was not observed for the
mesial surface, however. The distance between the cavosurface margin of the prepared tooth and the
adjacent tooth might impact the scanning accuracy. The absolute value of this distance on both mesial
and distal surfaces should be measured in the future to evaluate the role that the distance between
adjacent teeth surfaces plays in scanning accuracy. Another study reported that the crown preparation
quality as measured by the tooth surface smoothness had a profound effect on the marginal fit of
CAD/CAM-fabricated crowns, while the scanner type itself did not [13]. Furthermore, a previous
in vivo study found that digital impression systems in general displayed increased distortion towards
the distal end when full-arch impressions were taken [12]. This distortion pattern is consistent with
the findings in this study.
Moreover, the occlusal plane slope and anatomy of the dental arch at the molar region could affect
the distance of the scanner from the scanned margin, and therefore the focus of the obtained images.
Additional studies should be conducted to examine the difference in scanning accuracy between
surfaces of a single tooth at various positions in a dental arch.
The longevity and success of fixed dental prostheses depend heavily on marginal integrity between
the preparation and the restoration. A systematic review conducted by Ahlholm et al. concluded
that in their current state, digital impression techniques are clinically acceptable and comparable
to conventional impression techniques in terms of accuracy for single crowns and short-span fixed
partial dentures, but that their accuracy for complete dental arch treatment is lower [14]. The clinically
acceptable value for marginal discrepancy of CAD/CAM-generated restorations has been described as
between 50 and 100 µm [2,15]. This means that the accuracy of digital impression as the first step in
any digital workflow should fall below that range in terms of marginal discrepancy. The results of
this study showed that the accuracy of the 3Shape TRIOS 3 scanner, regardless of scanning resolution,
falls within clinically accepted limits and is comparable to previously published data that showed
a discrepancy that ranged from 6.9 ± 0.9 µm to 119 ± 48 µm [4,9,16–20]. The variation in observed
discrepancy values could be due to differences in software and hardware versions, different materials
scanned, operator discrepancies, differences in scanning strategies, or the span length of the scan.
Although numerous studies have compared the differences in scanning accuracy between various
IOS, fewer studies have investigated the discrepancy in accuracy as a result of different scanning
strategies. A common comparison between scanning protocols involves evaluating the difference
in accuracy between strategies that differ in directional sequence. In an in vitro study, Müller et al.
found that changing the directional sequence of scanning did not impact the accuracy of a full-arch
digital impression using the 3Shape TRIOS Pod scanner [21]. Furthermore, Medina-Sotomayor et al.
explored how differences in scanning direction affected the accuracy of digital impressions using four
different IOS and found no significant difference among scanning systems [16]. It is important to note,
however, that scanning strategies based on the sequence in which a tooth surface is scanned could be
utilized by other intraoral scanning systems, thus allowing for a comparison between scanners to be
made. Conversely, it is to the best of the authors’ knowledge that the high-resolution scanning tool
investigated in this study is a unique feature of the 3Shape TRIOS scanning interface, and a scanning
protocol combining different optical resolutions has not been recommended by other manufacturers.
In addition, 3Shape has recently released a new scanner model, the TRIOS 4 scanner, with a Zoom
function that appears to be similar in functionality to the TRIOS 3 High res/Zoom setting. As intraoral
scanners and associated software are developed, it is possible that the accuracy and precision of
impressions can improve substantially. Further studies are needed to fairly evaluate the TRIOS 4
scanner and its optical resolution. The authors plan to utilize the methodology developed in theSensors 2020, 20, 1157 8 of 9
current study to further examine the TRIOS 4 scanner, as well as scanning parameters recommended
by other major intraoral scanners comprehensively in the near future.
Previous studies have been performed to examine the difference in accuracy according to multiple
scan strategies within a single scanning system. Motel et al. compared the difference in accuracy
between two strategies for implant impression using the TRIOS 3 scanner in an in vitro study [22].
The first strategy involved a one-step approach by scanning both the scan bodies and surrounding
structures together, whereas the second strategy combined an initial scan without the scan bodies and
a final scan with the scan bodies in place. These authors concluded that the one-step scanning strategy
achieved significantly higher accuracy compared to the two-step approach. This finding is consistent
with our recommendation of a one-step scanning approach for optimal scanning efficiency.
The 3Shape TRIOS 3 intraoral scanner was selected for this study due to its popularity and proven
superior accuracy. Accordingly, a limitation of our study is that it was designed specifically for the
TRIOS 3 scanner and other IOS were not included for comparison. Therefore, our conclusion of no
significant difference in digital impression accuracy between default resolution and high resolution
using TRIOS 3 should not be considered applicable for other IOS without further evaluation. While the
scope of this study limits its direct application to users of TRIOS 3, the results of this study highlight the
importance of evaluating different parameters within a single scanning system when making digital
impressions for the fabrication of dental prostheses.
Given that this was an in vitro study, factors that could influence the scanning accuracy when
digital impressions are taken in vivo, such as the presence of saliva and blood, soft tissue movement,
and the limited space that the oral cavity allows for maneuvering of the camera, were not considered.
The notion that the High res function could yield superior accuracy when such in vivo artifacts are
present is plausible. Further study goals include the investigation of the impact of intraoral variables
and margin design on scanning accuracy under different optical resolutions in clinical settings.
5. Conclusions
Within the limitations of this in vitro study, the following conclusions were made:
1. Significant differences in terms of scan time and number of images captured per scan were
observed among the three groups with different scanning resolution settings.
2. No significant difference was observed between default resolution and high resolution in
terms of accuracy on the crown preparation cavosurface finish line using the 3Shape TRIOS 3
intraoral scanner.
3. Scanning accuracy was significantly affected by tooth surface, with the distal surface demonstrating
the lowest accuracy.
Author Contributions: Conceptualization, A.S. and Y.C.; Methodology, A.C., Y.-W.C., and A.S.; Software, A.C.
and J.H.; Validation, A.S. and Y.-W.C.; Formal Analysis, J.H.; Resources, A.S. and Y.-W.C.; Writing—Original Draft
Preparation, A.C.; Writing—Review and Editing, A.S., Y.-W.C., J.H., and A.C. All authors have read and agreed to
the published version of the manuscript.
Funding: This research was supported by the University of Washington Dental Alumni Association Fund.
Acknowledgments: Special thanks to 3D BioCAD for their technical support.
Conflicts of Interest: The authors declare no conflict of interest with regard to the authorship of this manuscript.
References
1. Miyazaki, T.; Hotta, Y.; Kunii, J.; Kuriyama, S.; Tamaki, Y. A review of dental CAD/CAM: Current status and
future perspectives from 20 years of experience. Dent. Mater. J. 2009, 28, 44–56. [CrossRef] [PubMed]
2. Persson, A.; Odén, A.; Andersson, M.; Englund, G.S. Digitization of simulated clinical dental impressions:
Virtual three-dimensional analysis of exactness. Dent. Mater. 2009, 25, 929–936. [CrossRef] [PubMed]
3. Moörmann, W.H.; Mörmann, W.H. The evolution of the CEREC system. J. Am. Dent. Assoc. 2006, 137,
7S–13S. [CrossRef] [PubMed]Sensors 2020, 20, 1157 9 of 9
4. Renne, W.; Ludlow, M.; Fryml, J.; Schurch, Z.; Mennito, A.; Kessler, R.; Lauer, A. Evaluation of the accuracy
of 7 digital scanners: An in vitro analysis based on 3-dimensional comparisons. J. Prosthet. Dent. 2017, 118,
36–42. [CrossRef] [PubMed]
5. Nedelcu, R.; Olsson, P.; Nyström, I.; Ryden, J.; Thor, A. Accuracy and precision of 3 intraoral scanners
and accuracy of conventional impressions: A novel in vivo analysis method. J. Dent. 2018, 69, 110–118.
[CrossRef]
6. Yuzbasioglu, E.; Kurt, H.; Turunc, R.; Bilir, H. Comparison of digital and conventional impression techniques:
Evaluation of patients’ perception, treatment comfort, effectiveness and clinical outcomes. BMC Oral Health
2014, 14, 10. [CrossRef]
7. Punj, A.; Bompolaki, D.; Garaicoa, J. Dental Impression Materials and Techniques. Dent. Clin. N. Am. 2017,
61, 779–796. [CrossRef]
8. Turkistani, A.; Nakashima, S.; Shimada, Y.; Tagami, J.; Sadr, A. Microgaps and Demineralization Progress
around Composite Restorations. J. Dent. Res. 2015, 94, 1070–1077. [CrossRef]
9. Hack, G.D.; Patzelt, S.B.M. Evaluation of the Accuracy of Six Intraoral Scanning Devices: An in-vitro
Investigation. ADA Prof. Prod. Rev. 2015, 10, 1–5.
10. Zimmermann, M.; Ender, A.; Mehl, A. Local accuracy of actual intraoral scanning systems for single-tooth
preparations in vitro. J. Am. Dent. Assoc. 2019, 151, 127–135. [CrossRef]
11. Boeddinghaus, M.; Breloer, E.S.; Rehmann, P.; Wöstmann, B. Accuracy of single-tooth restorations based on
intraoral digital and conventional impressions in patients. Clin. Oral Investig. 2015, 19, 2027–2034. [CrossRef]
[PubMed]
12. Ender, A.; Attin, R.; Mehl, A. In vivo precision of conventional and digital methods of obtaining complete-arch
dental impressions. J. Prosthet. Dent. 2016, 115, 313–320. [CrossRef] [PubMed]
13. Renne, W.; Wolf, B.; Kessler, R.; McPherson, K.; Mennito, A. Evaluation of the Marginal Fit of CAD/CAM
Crowns Fabricated Using Two Different Chairside CAD/CAM Systems on Preparations of Varying Quality.
J. Esthet. Restor. Dent. 2015, 27, 194–202. [CrossRef] [PubMed]
14. Ahlholm, P.; Sipilä, K.; Vallittu, P.; Jakonen, M.; Kotiranta, U. Digital Versus Conventional Impressions in
Fixed Prosthodontics: A Review. J. Prosthodont. 2016, 27, 35–41. [CrossRef] [PubMed]
15. Att, W.; Komine, F.; Gerds, T.; Strub, J.R. Marginal adaptation of three different zirconium dioxide three-unit
fixed dental prostheses. J. Prosthet. Dent. 2009, 101, 239–247. [CrossRef]
16. Medina-Sotomayor, P.; Pascual, A.; Camps, I. Accuracy of four digital scanners according to scanning strategy
in complete-arch impressions. PLoS ONE 2018, 13, e0202916. [CrossRef]
17. Medina-Sotomayor, P.; Pascual-Moscardo, A.; A, I.C. Accuracy of 4 digital scanning systems on prepared
teeth digitally isolated from a complete dental arch. J. Prosthet. Dent. 2019, 121, 811–820. [CrossRef]
18. Albdour, E.A.; Shaheen, E.; Vranckx, M.; Mangano, F.; Politis, C.; Jacobs, R. A novel in vivo method to
evaluate trueness of digital impressions. BMC Oral Health 2018, 18, 117. [CrossRef]
19. Chun, J.-H.; Tahk, J.H.; Chun, Y.-S.; Park, J.-M.; Kim, M. Analysis on the Accuracy of Intraoral Scanners: The
Effects of Mandibular Anterior Interdental Space. Appl. Sci. 2017, 7, 719. [CrossRef]
20. Mangano, F.G.; Veronesi, G.; Hauschild, U.; Mijiritsky, E.; Mangano, F. Trueness and Precision of Four
Intraoral Scanners in Oral Implantology: A Comparative in Vitro Study. PLoS ONE 2016, 11, e0163107.
[CrossRef]
21. Müller, P.; Ender, A.; Joda, T.; Katsoulis, J. Impact of digital intraoral scan strategies on the impression
accuracy using the TRIOS Pod scanner. Quintessence Int. 2016, 47, 343–349. [CrossRef] [PubMed]
22. Motel, C.; Kirchner, E.; Adler, W.; Wichmann, M.; Matta, R.E. Impact of Different Scan Bodies and Scan
Strategies on the Accuracy of Digital Implant Impressions Assessed with an Intraoral Scanner: An In Vitro
Study. J. Prosthodont. 2019. [CrossRef] [PubMed]
© 2020 by the authors. Licensee MDPI, Basel, Switzerland. This article is an open access
article distributed under the terms and conditions of the Creative Commons Attribution
(CC BY) license (http://creativecommons.org/licenses/by/4.0/).You can also read