GUIDANCE G Yield Estimation - Version 1 - Rainforest Alliance
←
→
Page content transcription
If your browser does not render page correctly, please read the page content below
GUIDANCE G
Yield Estimation
Version 1

© 2021 Rainforest Alliance. All rights reserved.
Translation Disclaimer
For any question related to the precise meaning of the information contained in the
translation, please refer to the English official version for clarification. Any discrepancies or
differences in meaning due to translation are not binding and have no effect for auditing or
certification purposes.

More information?
For more information about the Rainforest Alliance, visit www.rainforest-alliance.org or
contact info@ra.org

        Document Name:                                 Document Code: Version:
        Guidance G: Yield Estimation                   SA-G-SD-8-V1            1
        Date of first          Date of revision:       Valid From:             Expires by:
        publication:
        March 31, 2021         N/A                     March 31, 2021          Until further notice

        Developed by:                                  Approved by:
        Rainforest Alliance Department Standards Director of Standards and Assurance
        and Assurance
        Linked to:
        SA-S-SD-1-V1.1 Rainforest Alliance 2020 Sustainable Agriculture Standard, Farm
        requirements (1.2.10, 2.1.1, 2.1.2)
        Replaces:
        N/A

        Applicable to:
        Farm Certificate Holders

        Country/Region:
        All
        Crop:                                          Type of Certification:
        All crops in the scope of the Rainforest       Farm Certification
        Alliance certification system; please see
        Certification Rules.

                                                                                                      2
SA-G-SD-8-V1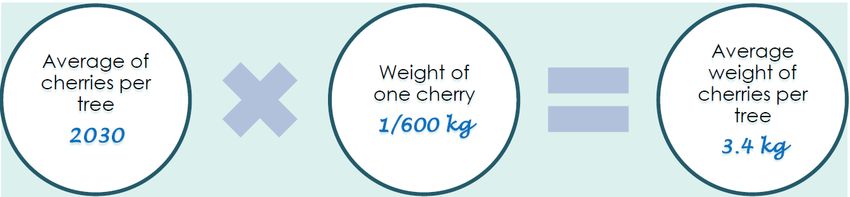
TABLE OF CONTENTS
1.   Introduction .................................................................................................................................... 4
2.   Selecting a good sample to estimate yield ............................................................................... 5
3.   Accurate yield estimation ............................................................................................................ 7
4.   How to improve your certified volume estimates ...................................................................... 8
5.   Accurate yield estimates for cocoa ......................................................................................... 10
1.   Accurate yield estimates for coffee ......................................................................................... 15
2.   Accurate yield estimates for tea ............................................................................................... 18

                                                                                                                                                           3
SA-G-SD-8-V1
1. INTRODUCTION
Accurate estimation of crop yields is important for the agronomic, entrepreneurial, and
environmental benefits of the farm. Reliable harvest estimation enables producers and group
managers to become better farm managers, helps guide in adopting sound agricultural
practices, and brings transparency to the supply chain. In addition, having accurate
numbers on certified volumes is essential for the credibility of Rainforest Alliance’s certification
program and traceability system.
This guidance covers different commodity crops and production contexts. Basic principles
are described to enable more accurate yield estimates while acknowledging that different
and more detailed approaches (methodologies) are possible and currently being practiced
in some contexts.
Accurate volume estimates enable producers to:
Better manage production
• Estimate how much input (e.g. fertilizers, pesticide) is needed.
• Have a better understanding of the management of the farm.
• Observe the impact of better farming practices and optimization of productivity.
Better manage market relationships
• Estimate the supply of certified product for the coming year.
• Increase the trust between producer and buyer, by more accurately indicating how
much produce will be available for sale.
Better manage livelihoods
• Accurately estimate income to better management of household finances.
• Increase the possibility of access to loans/credits from financial institutions.
Requirement 2.1.1 states that The estimated volume for the upcoming certification year is
determined annually based on a credible methodology applied by group or farm
management. In addition, for group management, at every certification cycle internal
inspectors visit a representative sample of group members and estimate the crop yield
based on a credible methodology.
After the annual audit conducted by a Certification Body, which verifies the estimated crop
yield and volumes as well as the credibility of the methodology used, the group enters the
estimated volumes in the Rainforest Alliance traceability system, allowing groups to sell their
certified product to buyers.
After verification of the volumes during the external audit, the Group reports the total volume
harvested in the traceability system. The group compares the real harvest with the volume
estimates to check that the estimation methodology is realistic.
To ensure a credible methodology is used is it is always essential to:Test the methodology.
• Train the users.
• Verify that the estimation reflects what is observed in the field.
• Continuously monitor production and those factors affecting it (pests and diseases,
weather conditions).
• At the end of the certification year, compare the estimation with the real harvested
volume.
• For each new certification year, compare the estimated volume with previous
harvests.
• Measure using the metric system (kilograms or Kgs) or hectare (ha).
This yield estimation guidance refers to the implementation of standard requirements 1.2.10
as this indicates the production areas, and 2.1.1 and 2.1.2.
4
SA-G-SD-8-V12. SELECTING A GOOD SAMPLE TO ESTIMATE YIELD
The crop yield is the volume of crop grown per unit of land area or per plant in a year.
Depending on the crop, the yield can be determined using different product types (e.g.
green coffee/parchment, green leaves/made tea).
Sub-product in Rainforest Measurement
Commodity crop Field estimation
Alliance Traceability System unit
Coffee Cherries Cherries, parchment, green Kg
coffee
Cocoa Dry cocoa beans Dry cocoa beans Kg
Tea Green leaves Made tea Kg
Monoculture
In the case of crops grown in monoculture, the spacing between plants is generally the same
across the whole plot. In these cases, the volume estimation can be made by multiplying the
farmer’s certified crop area with an average yield estimate of the farmer’s plots:
Image of Calculation 1: Estimated Certfied Volume per Group Member with Monoculture
Diversified farming systems
In diversified farming systems, the total certified volume cannot be calculated by working
with the full production acreage. Therefore it is estimated based on the production per tree
or bush. The total certified volume is then calculated by multiplying the number of
trees/bushes with the average yield estimate per tree/bush.
Image of Calculation 2: Estimated Certfied Volume per Producer Group with number of Trees/Bushes
5
SA-G-SD-8-V1Whether the volume estimation per producer is done based on the production per tree/bush
or on the production per certified area (yield), the Group management can eventually
multiply the average certified volume of a representative sample of group members for the
total number of group members:
Image of Calculation 3: Estimated Certfied Volume per Producer Group by represeative sample
A key aspect of obtaining an accurate estimation at a group level is a good methodology to
select a representative sample of group members. Here you can find the basic steps to
select a good sample:
1. Choose the sample size.
The sample size may depend on the total production acreage and on its homogeneity. In
more diverse areas the sample size needs to be larger to have a proper representation of the
area. The sample size may cover 5% to 10% of the total area.
2. Choose the group members to be included.
When preparing a sample of group members, include the following elements at a minimum:
- Producers representing higher and lower yields per hectare in the group of farmers
based on previous yield estimates and actual volumes, if this information is available.
- Producers with smaller and larger areas.
- Producers covering the different geographical and climatic characteristics in the
certified area.
- If posssibe, select producers who made accurate yield estimations in earlier years,
provided their acreage is large enough to represent the whole area.
It is better not to include the following:
- Producers who recorded significant differences between estimated yield and
previous year harvest as this suggests their yield estimation was not accurate
- Producers who had non-conformities related to volume estimation as ttheir
information may not accurate or reliable.
These groups of producers should first be taught how to make an accurate yield estimation,
which is checked during the internal inspection.
3. Implement the yield estimation methodology with the sample of farmers.
This is done using the methods laid out in the chapters below.
6
SA-G-SD-8-V13. ACCURATE YIELD ESTIMATION
The accuracy of the certified volume relies on two parameters: the yield per area or per
tree/bush and the certified area. The basic factors determining the yield are the following:
• The number of all the farm plots,
• The location and size of the farm plots to determine the certified area of the farm
(often measured with GPS devices),
• The number and age of the plants,
• The plant spacing,
• The type of varieties/cultivars used.
When determining the certified area, use a GPS tool that is widely available and considered
a reliable method when used well (see Annex). It allows for more accurate and consistent
data collection than estimating locations or areas using paper maps or a compass and
distance measurements.
In several countries, governmental bodies issue official land titles indicating the size of the
farm. These officially recognized documents are also considered a reliable method to
determine the size of the certified area per producer. Group management should
nevertheless verify during the internal inspections that the farm has not been split or sold
since the official land title was issued.
The accuracy of the yield depends on many factors including environmental conditions and
agronomic practices implemented by the producers. Whichever methodology is used, the
final estimation should be adjusted based on the following information:
• If available, local average or potential yield of the area, for comparison purposes (e.g.
provided by departments of Agriculture, extension services et cetera)
• Integrated pest management (IPM) practices implemented.
• Soil fertility and soil nutrient management.
• Sanitary status of the crop (pest and disease pressure and their management).
• Cropping system (intercropping or monocropping – the density of the certified crop will
affect the yields).
• Agricultural practices (level of pruning, weed management, irrigation, etc.).
• Climate conditions and precipitation (rainfall) pattern.
• Labor input.
• Method of harvesting.
• Quality of the harvested product requirements, e.g. for tea: two leaves and a bud or
three leaves and a budetc For coffee or only ripe/mixed/dried cherries.
These aspects of crop production have a significant impact on crop yield. This is one of the
reasons explaining the substantial variation that occurs between countries, regions, farms, and
even within farms. A careful assessment of each of these parameters should eventually be
translated into better estimations of crop production.
For groups, to increase the accuracy of the estimates Rainforest Alliance encourages the
following methodologies to be used:
- Digitalized and centralized archive with all the relevant information (see later in this
guidance).
- Historical database of harvested volumes for each of the farm plots, possibly also in
digital format. Among other purposes, this is to triangulate a plantation’s records with
local crop yield estimations made by local research institutes and/or extensionists.
- Maps.
7
SA-G-SD-8-V14. HOW TO IMPROVE YOUR CERTIFIED VOLUME ESTIMATES
Although the process for estimating yield and volume may involve different persons within
the group or farm management, it is important for one person to have an overview of the
whole process to make sure the methodology is well implemented and that data,
observations, and learnings are not lost. This person should have a good understanding of
crop production, be literate and comfortable with numbers.
The person responsible for the yield and volume estimation process should be responsible for
implementing the steps shown in the image below.
Although this process can imply responsibilities for different persons within the Group or farm
management, it is important for one person to have an overview of the whole process to
make sure the methodology is well implemented and that data, observations, and learnings
are not lost. This person should have a good understanding of crop production, be literate
and comfortable with numbers.
Image 1: How to improve your certified volume estimates
8
SA-G-SD-8-V1The steps in image 1 are described in more detail here:
1. Establish a credible methodology to calculate the certified area and yield of each
producer
2. Perform the methodology:
a. Test the methodology
b. Train the person(s) responsible for estimating the volumes
c. Calculate the volume for a representative sample of farm units and farms
3. Compare the Data
Cross-check the certified volume of each producer with previous year(s) harvest,
total sales of the producer and internal inspection reports (requirement 1.4.1).Take
into account risks that might influence volume estimates. This can include supply
chain risks: risks that influence the accuracy of your data could be in the collection
centers in your supply chain or in multi-certification of your group members
1. Keep track of the real production
Set up a system to verify real production. This can be done for example by regular
checks with a representative number of producers to gather information on the status
of the crop and the quantities produced.
2. Analyse the data
After the harvest season, real production needs to be compared to the estimated
production. If discrepancies between the two are found:
• Identify the cause of the differences and, Put in place measures to prevent
such differences occurring. This can include improving your methodology
(step 1) and training your internal inspector (step 1)
• Modify the estimated certified volume on your list of group members (2.1.1) for
the new certification cycle.
9
SA-G-SD-8-V15. ACCURATE YIELD ESTIMATES FOR COCOA
The yield and volume estimation methodology explained below is time sensitive. Group/farm
management should first assess the best months to implement the methodology. Since this
method is based on pod counting, the best time is right before the beginning of the harvest
when the pods are not too small and may therefore never reach maturity as this would lead
to an inaccurate estimate.
After assessing the best months to carry out the methodology, and after determining the
certified area either with a GPS tool (polygon) or with recognized official documents, yield
and volumes estimates are calculated as follows:
Step 1: productive cocoa tree density on sampled farms
This first step of determining productive tree density (number of productive trees per hectare)
can be done on each group member’s farm. Alternatively it can be calculated for a
representative sample of farms (eg for the square root number of all group members). The
average number of productive trees per hectare for these sampled farms is then calculated
and applied to all group members. The explanations below are based on a sampled number
of farmers:
Productive tree density can be determined based on the sample area(s). For this, one or
more area of 10 meters by 10 meters (100m2) is defined on a representative part of each
sampled farm.
If the farm is not homogeneous, as a general guide the sample area should not be in areas
where there is no production such as:
a. Newly planted fields.
b. Abandoned fields
When calculating the overall yield, the area of fields with no production should be left out.
In each of the sample areas, the number of productive trees is then counted. If more than
one sample area is defined, the average number of productive trees per sample area is
calculated.
This counting will result in the number of productive trees per 100m 2. This figure then needs to
be multiplied by 100 to obtain the density of productive trees per hectare.
Image of Calculation 4: Productive tree density on sampled farms
Step 2: productive tree density for the whole group
Once the average number of productive trees per hectare is determined for each sampled
farm, the average of all these sampled farms can be calculated to obtain the average
productive tree density for the whole group.
10
SA-G-SD-8-V1Image of Calculation 5: Average number of productive trees for the whole group
N.B: The density range at which the productivity of the fields will be optimized is 800 to about
1,300 cocoa trees per hectare (assuming the farm is not intercropped with other crops).
Below this range, producers are not making the best use of the space in their fields and are
encouraged to renovate their fields. If above this range, the cocoa trees enter into
competition with each other for resources (light, nutrients, water), and the probability of
diseases increases. Producers are encouraged to remove some of their trees to fall back into
the best tree density range.
Steps 3 and 4: pod counting on productive trees for each group member
Once the tree density has been determined and applied to all group members, pods on
productive trees need to be counted to then determine the estimated yield and volume.
The pod count is done on the farm of each group member on a representative number of
adjacent productive trees. The number of trees on which to count the pods is based on the
productive tree density for the whole group divided by 100 (the result represents the number
of productive trees that would be found on a 10m by 10m sample area).
Image of Calculation 6: Productive trees to do the pod count on each farm
The pods on this number of sampled productive trees are then counted on the farm of each
group member:
Tree Number of pods per productive tree
Tree 1
Tree 2
Tree 3
Tree 4
Tree …
Tree …
TOTAL NUMBER OF PODS ON SAMPLED
PRODUCTIVE TREES:
It is not recommended to include very small pods (called cherelles – about 5cm long) in the
counting as their probability of reaching maturity is relatively low. If the pod counting is done
once most pods have reached maturity, it is important to ask the producer about the relative
quantity of cocoa harvested in the last few weeks to include this volume in the estimation.
11
SA-G-SD-8-V1Steps 5 and 6: calculating the estimated cocoa yield
Once the pods on the sampled productive trees have been counted, the cocoa yield can
be estimated.
The number of pods per tree is first determined based on the sum of the number of pods
counted on the sampled productive trees:
Image of Calculation 7: Average number of pods per productive tree
The average number of pods per tree is then used to calculate the average cocoa bean
production per tree, knowing that on average, one pod is equivalent to 0.04kg of cocoa
beans:
Image of Calculation 8: Average number of pods per productive tree
Finally, the cocoa bean production per tree is multiplied by the tree density per hectare to
obtain the yield:
Image of Calculation 9: Estimated yields
Step 7: calculating the estimated volume and adjusting for local conditions
As the last step, the yield per hectare is multiplied by the total certified area to obtain the
estimated volume and then adjusted based on the factors mentioned in chapter 3 of this
document.
Image of Calculation 10: Average number of cooca beans produced
12
SA-G-SD-8-V1For example, with no pest and disease control (such as little to no pruning and/or weeding,
or removal of infested pods), it can be expected that part of the pods will be lost, and
hence, need to be deducted from the overall annual estimated volume.
Image of Calculation 11: Final amount of cocoa beans produced
Steps 3 to 7 can also be done with a representative sample of producers (ideally, on the
same sample area used for estimating the tree density – Step 1), and then extrapolated to
other group members who have similar farming conditions. It is particularly important in this
case to compare and adjust the value of the extrapolated estimated volume based on the
field observations by the internal inspectors and the previous year’s production information.
Using an Adoption Observation-based methodology for yield estimation in
cocoa
For cocoa, a method of yield estimation is the method of Adoption Observation. Certificate
holders are encouraged to make use of this method when possible. The method is briefly
described below.
The method can result in a robust yield estimate but using it requires proper training first.
Further guidance on the use of this method will be available on the Rainforest Alliance
Learning Network through https://learn.ra.org/.
The development of Adoption Observations was supported by Mars Wrigley as a way to
observe farm practices and conditions which are correlated with prevailing yields.
This methodology involves two main steps:
Step 1: Plotting:
When starting to work with Adoption Observation for the first time, the farm is divided into
‘’homogeneous plots.’’ These are parts of a farm where the conditions of the trees are the
same and where the trees all need the same interventions to reach a high yield. A plot may
be indicated on a paper map or, better, on a digital map. Often digital maps for the whole
farm exist, in which case only the boundaries between plots within the farm need to be
added. If a whole farm is homogeneous only one plot is indicated for the whole area of the
farm.
Step 2: Collecting Adoption Observation information:
The observer visits a plot and makes 14 observations against specific criteria:
Plant material,
1. Plant Material, Genetics
2. Tree Age
3. Tree Density
4. Tree Health
5. Debilitating Disease
6. Pruning
7. Pest, Disease and Sanitation
13
SA-G-SD-8-V18. Weeding
9. Harvesting
10. Shade
11. Physical Condition of Farm Land
12. Soil Health
13. Formulations for Fertilizer and Organic Nutrient Replenishment
14. Fertilizer and Organic Nutrient Application
The 14 observations are categorized as Good/Bad or Good/Medium/Bad depending on the
observation. The system starts with an assumption that an ideal targeted yield potential of 1.5
or 2.0mt cocoa per year per hectare can be reached.
• Every observation that is rated Good will support the target yield potential to be
achieved.
• Observations rated Medium or Bad will reduce the potential by a certain percentage
depending on their severity.
The final estimated yield on a plot is derived from reducing the potential for every
intervention that scores less than Good and the yield for the whole plantation is determined
by adding up the volumes of all plots.
14
SA-G-SD-8-V11. ACCURATE YIELD ESTIMATES FOR COFFEE
After having mapped the area, Certificate Holders can make yield estimates by taking the
following steps per group member. This methodology can be used when cherries are present
in the field.
If there is more than one harvest per year, yield estimates take into account all harvests.
Step 1: Tree counting to calculate coffee plant density
Count the productive trees in one hectare. See Annex 1 for an example of the methodology.
In this example, there are 1500 trees/hectare.
Step 2: Make a sample
In one plot, draw a transect/imaginary line. This transect has to go through representative
areas of the farm in terms of variety and age of trees and soil quality. On this line, identify
three points where there is a good diversity of yields. At each point, choose five
representative trees in terms of yield and go through the next steps.
IMAGE OF TRANSECT LINE 1
15
SA-G-SD-8-V1Step 3: Count branches and cherries
Counting should take place during harvest time. For each tree, count the number of
branches and write it down. Afterward, choose four average size branches in four directions,
count all cherries on the branches and calculate the average. Once you have the number
of cherries per branch and the number of branches per tree, you can calculate the number
of cherries per tree. Complete the following table:
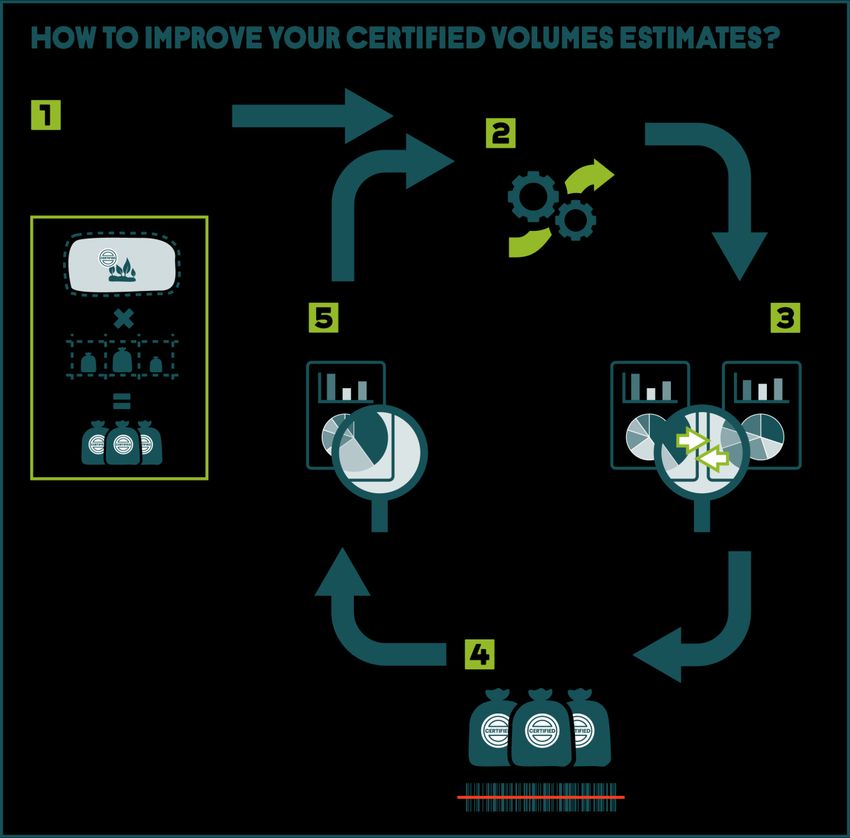
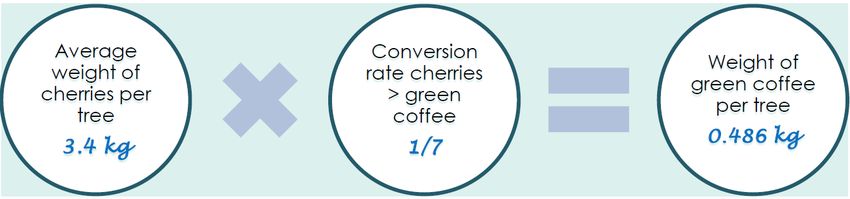
Step 4: Yield estimate
To determine the weight of green coffee per tree, do the following calculation.
The first step is to calculate the average weight of cherries per tree. This can be done by
weighing the counted cherries and dividing the weight by the number of cherries.
In this example we have taken 1/600kg as the weight of one cherry.
Image of Calculation 12: Average Weight of Cherries per tree
16
SA-G-SD-8-V1The second step is to calculate the weight of green coffee per tree by using a conversion
rate of 1 to 7.7. For this example: kg of green coffee per tree = 3.4/7.7 = 0.486kg of green
coffee per tree.
Image of Calculation 13: Weight of green coffee per tree
To have the yield estimate per hectare, multiply by the number of trees identified in Step 1:
Image of Calculation 14: Yield estimate per hectare
Step 5: Volume estimation
The last step is to multiply the yield estimate and the size of the certified area to get the
estimated volume.
17
SA-G-SD-8-V12. ACCURATE YIELD ESTIMATES FOR TEA
Unlike the other commodities mentioned, tea is a crop that is continuously (or almost
continuously) harvested throughout the year in most regions. It is also characterized by pruning
cycles of 3-to-5 years of length. Production of tea varies with the year of the pruning cycle the
plot is in.
The yield is calculated for the calendar year, from January to December or for 12 months
depending on the financial year of each of the producing organization, e.g.July-June/April-
March.
Commonly for plantations the yield is calculated in kilograms of made tea per hectare.
Small farms can also work with calculations in kilograms of green leaves per bush, which can
be converted into kilograms of green leaf per hectare or acre. This can then be converted to
made tea per hectare based on the conversion rates of the factory.
Yield estimations in tea are commonly based on historical data. The yield estimation is further
influenced by factors including:
- Harvesting method (mechanical or hand harvesting).
- The desired quality of the harvest, e.g. two leaves and a bud or three leaves and a
bud, and the number of plucking rounds/interval (varies from 1-to-4 plucking
rounds/month/bush).
- Age of the tea bushes.
- Stage of the pruning cycle of the harvested bushes, pruning height and other
husbandry practices including the tipping height allowed.
- Fertilization program (type and amounts of fertilizer applied, time and conditions during
fertilizer application, method of application, split applications or annual, etc.).
- Field coverage with bushes (Is the whole field covered or are there gaps, e.g. because
of missing bushes, shade trees, other elements within the tea field?)
- Types of clones.
- Plant spacing.
- Time between harvesting and weighing (the season also affects this, e.g. dry season
vs. rainy season).
Yield estimation can be conducted by taking the following steps:
Step 1:
The yield estimation starts from the map of the farm, as per Requirement 1.2.10. This map (for
small farms, also the group registry) can be used to identify areas where there might be
different characteristics influencing the yield based on the aspects mentioned above.
Step 2:
For larger farmers, the yield calculation is based on the area under plantation, which will be
clear from the GPS polygons, and on historical yields and further factors as mentioned
above.
In very small farms where there is no consolidated plot for which the area can be calculated,
yield calculation is based on the number of bushes. Count the bushes for each of the plots
identified and categorized based on relevant characteristics including the pruning cycle. This
is done for all established farms and plots.
Step 3:
Based on the records made at the factory level on the average productivity per bush, the
producer calculates the average kilograms of production per tea bush.
18
SA-G-SD-8-V1Step 4:
The volumes estimate for the current season is calculated by multiplying the average kg of
green leaves production per tree (Step 3) by the number of tea bushes counted in Step 2.
Step 5:
The yield estimated for each plot is added up to eventually obtain an overall volume in green
leaves.
Step 6:
Green leaves are converted into made tea by using the local conversion rate.
A table with example numbers:
Plot Area Number of Average yield per bush per Overall estimated volume
(ha) bushes pruning cycle per year for this plot
(#) (kg/bush/year) (kg)
Plot 1 0.3 1200 1.8 1200x 1.8 =2160
Plot 2 0.6 2000 1.7 2000 x 1.7 = 3400
Plot 3
Plot 4
Plot …
Plot …
In the plantation context
For mechanical harvesting or scissor harvesting there can be added residue to the harvested
produce. To take as clean as possible harvested volume data, it is suggested to weigh the
volume again after cleaning, or to use a method to calculate conversion rates. It is important
to note down the method for such conversion in the yield estimation methodology
document.
19
SA-G-SD-8-V1You can also read