US Roadshow Presentation - MNF Group Limited

Page created by Nicholas Frazier
 
CONTINUE READING
US Roadshow Presentation - MNF Group Limited
View the MNF Journey
                                                          Find out where it all began…
                                                      https://mnfgroup.limited/about

US Roadshow Presentation
Rene Sugo, Group CEO
6 May 2019

             This page intentionally left blank

                                                                                         1
US Roadshow Presentation - MNF Group Limited
Introduction to MNF Group
    MNF Group Limited (ASX:MNF) delivers cloud and software led solutions that
    enable voice communication services for its customers
    Develops and operates a global communications 'smart network' and innovative
    software suite enabling some of the world’s leading innovators to deliver new-
    generation communications solutions
    One of Asia-Pacific’s fastest growing technology companies and is headquartered
    in Sydney, Australia, with over 450 people located across Asia-Pacific, Europe and
    North America
    Growth leveraged to the “once in a generation” global shift to cloud based
    communications, and is a leader in the space in Asia-Pacific

3
                                                                                  © MNF Group Limited 2019

4
                                                                                  © MNF Group Limited 2019

                                                                                                             2
US Roadshow Presentation - MNF Group Limited
Evolution of communication
            Proliferation of communications methods, enabled                                                                               Existing telcos have not
            by new technology                                                                                                              invested in software and are
                                                                                                                                           unable to support UCaaS and
            Software companies have developed UCaaS and                                                                                    CPaaS vendors
            CPaaS products to enable interoperability of
            multiple communication channels
                                                                                                                                           Software vendors are unwilling
                                 Then                                       Now                           Future                           to invest capex to build telecom
                                                                                                                                           infrastructure and networks
Consumers                      Copper                                  Internet                             Mobile

                                                                                                            Software
                                                                       Live chat
                               Call centre                                                                  • SMS
Interaction                    Post
                                                                       Email
                                                                                                            • Text
                                                                                                                                           Software vendors depend on
                                                                       Portals                                                             next-generation providers like
                               In-store                                                                     • Voice
                                                                       Call centre
                                                                                                            • Video                        MNF to bridge the gap
                                                                                                                                           between software and
Business                       Premise-based                           Cloud                                App-based
                                                                                                                                           infrastructure to underpin their
   5                                                                                                                                       capabilities
                                                                                                                                                                © MNF Group Limited 2019

   The world is changing…
     “By 2021, 90% of IT leaders will not
      purchase new premises-based UC
    infrastructure — up from 50% today”
                                         – Gartner, 10 October 2018

        Most companies in the Gartner UCaaS Magic
        Quadrant are MNF customers today, or are
        working with MNF to plan deployments in the
        Asia Pacific region within the next 18 months
        MNF is developing additional capabilities and
        capacity to match this “once in a generation”
        cloud migration opportunity
        The potential growth for MNF is only limited by
        the number of countries we can deploy in over
        the next five years

   6   Sources:
       Magic Quadrant for Unified Communications as a Service, Worldwide,         The State of the Unified Communications Market in 2018
       Magic Quadrant for Contact Center as a Service, North America              Graph information source: Gartner, Inc                                        © MNF Group Limited 2019

                                                                                                                                                                                           3
US Roadshow Presentation - MNF Group Limited
How big is the market opportunity?
                                                                                                                         UCaaS & CPaaS growth set to accelerate in the
                800                                                                               40%        CAGR
                                                                                                                         region due to increasing awareness and
                                                                                                                         knowledge – structural tailwinds
$ US Millions

                                                                                              Over the next 4 years
                600
                                                                                                                         MNF is well placed in Australia and New Zealand
                400                                                                     cPaaS                            to leverage this growth, and soon Singapore
                                                                                        Revenue Asia Pacific
                200                                                                     excluding China &                UCaaS & CPaaS is a key driver for our regional
                           2018       2019      2020       2021      2022               India                            expansion strategy to cover more countries in
                                                                                        Source: Gartner, Inc
                                              Year
                                                                                                                         APAC in coming years
                                                                                                                         MNF estimates it can provide up to 30% of the
                3.0
                                                                                                  12%        CAGR
                                                                                                                         value stack on CPaaS
                2.5
                                                                                              Over the next 4 years      MNF estimates it can provide up to 80% of the
$ US Billions

                2.0                                                                                                      value stack on UCaaS, depending on the client
                1.5
                                                                                        UCaaS                           MNF is investing capital and human resources in
                                                                                        Revenue Asia Pacific
                1.0                                                                     excluding China &                realising the opportunities presented by its
                           2018       2019      2020       2021      2022               India                               customers and the market as a whole
                                                                                        Source: Gartner, Inc
                7                             Year
                                                                                                                                                                       © MNF Group Limited 2019

                Key trends are underpinned by MNF’s services

                                               CPaaS                                                      UCaaS                                       AI
                                                                                  20%                                          70%
                                                                          All customer service                         Customer interactions    may soon call &
                                          preferred over                                                 replacing      will involve chatbots
                                                                          interactions handled                                                  SMS more than
                                           calls & SMS                       by AI (by 2022)          on-premise PBX           (by 2022)
                                                                                                                                                   humans

                                                   API                                                         API                                    API

                                                         Mobile MVNO                                  SMS                   Compliance                  Porting
                                                           SIP Trunks                          Voice Termination               Billing               Emergency Calls
                                                        Virtual Numbers                            Analytics              Service Delivery            Geo-location

                8
                      Sources: OVUM 2018, Eastern Management Group 2016, Roy Morgan 2016, ACMA 2017                                                                    © MNF Group Limited 2019

                                                                                                                                                                                                  4
US Roadshow Presentation - MNF Group Limited
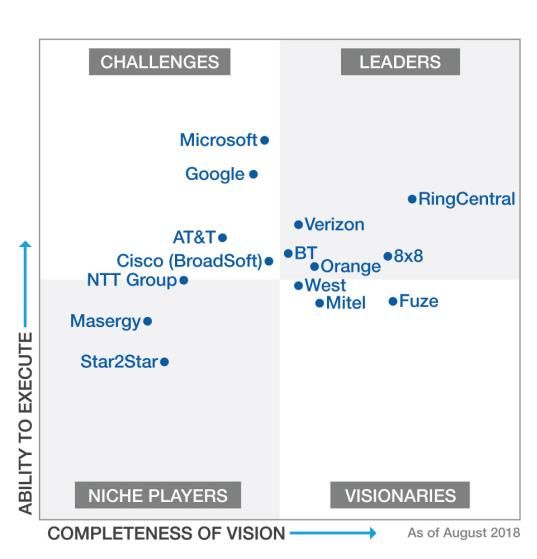
MNF is building the future of communications

  Our platform enables embedded          …that we sell to telcos and                …and use to power our own
            capabilities…                       disruptors….                                innovation
                Mobile                             MVNOs                               Industry technology
           Virtual numbers                    Emerging telcos                             Voice services
              SIP trunks                       Global Carriers                             Conferencing
             SMS and IM                       App developers                             Apps and portals
         Global termination                 Software companies                            Vertical brands
           Telco back-end                        Enterprise

          MNF solves for customer concerns over regulation, capacity, scalability, and reliability
          by providing APIs and a single point of connection to cloud and telco networks
          Customers highly value MNF’s result-driven solution comprising software, APIs,
          platform, global network and reliable operation
 9
                                                                                                               © MNF Group Limited 2019

 The MNF Platform

Regional CPaaS                 Delivered on our                 Used in mission-                   Underpinning
  capabilities                  infrastructure                  critical software                  huge markets

 Virtual Numbers

                                                                 Masked Numbers                      Marketplaces
      SIP Trunks

        SMS                                                            UCaaS                        Contact Centres

       Porting
                                                                   Call Analytics                     Advertising

     Geo-location

 10
                                                                                                               © MNF Group Limited 2019

                                                                                                                                          5
US Roadshow Presentation - MNF Group Limited
Underpinning: Ride share marketplaces

• Masked numbers protect
                                        Driver                                                                      Customer
  user privacy and mitigate off-
  market communication                       Personal mobile                                                               Personal mobile
• Global CPaaS delivers ‘mask’                         Local number                         SIP Trunk              Local number
  using MNF virtual numbers,
                                                 Virtual Number                                                                Virtual Number
  calls via SIP Trunks
• API and network quality are
  critical to user experience                                                             Global CPaaS

• MNF revenue model is                                                                             API

  predominantly high-margin
  recurring with a smaller
  variable transaction revenue
  (user voice calls)
                                                            Virtual       Voice Calling     2-Way SMS     Any-to-Any         Ephemeral
                                                           Numbers        (SIP Trunks)                    Connectivity

11
                                                                                                                                                 © MNF Group Limited 2019

Underpinning: Cloud contact centres

• UCaaS replaces end-of-life
  PBXs and phone networks in
  an enterprise
• Software vendors unable or                                                                                                   Local number
                                       Business numbers
  unwilling to build infra
                                   Contact centre                                            UCaaS         SIP Trunk
                                                                                                                                                Customer
• MNF provides critical local
  infra in a scalable way                                                                           API

• Telephony hardware
  replaced by apps and
  software
• MNF revenue model is
  predominantly high-margin
  recurring with a smaller              Numbers &
                                         Porting
                                                        Voice Calling
                                                        (SIP Trunks)
                                                                        Video Calling
                                                                        (SIP Trunks)
                                                                                            2-Way SMS      Conferencing
                                                                                                            (SIP Trunks)
                                                                                                                            Global PSTN
                                                                                                                              Access
                                                                                                                                           Any-to-Any
                                                                                                                                           Connectivity
  variable transaction revenue
  (user voice calls)
12
                                                                                                                                                 © MNF Group Limited 2019

                                                                                                                                                                            6
US Roadshow Presentation - MNF Group Limited
Underpinning: Advertising analytics

• Call Analytics prove the value
  of online advertising in
  driving customer calls                                               Toll free number
                                      Calls from search                                               SIP Trunk
• Ads displays a unique virtual                                Virtual number                                               Advertiser
  number, MNF connects the
  call, passes on geo-location
                                                                                         Call geo-location data
                                                          Ad Vendor
• Call location data is critical to
  ad vendor’s business                                                           API

• MNF revenue model is
  predominantly high-margin
  recurring with a smaller
                                                            0800
  variable transaction revenue
  (user voice calls)                        Virtual        Toll Free      Geo-Location    Call Analytics     Any-to-Any
                                           Numbers         Numbers           Data              Data          Connectivity

13
                                                                                                                                © MNF Group Limited 2019

Our global reach

14
                                                                                                                                © MNF Group Limited 2019

                                                                                                                                                           7
MNF’s network infrastructure
     MNF’s network infrastructure is comprised of its software, APIs, platform and
     operations processes, which have been developed over the last 17 years
        MNF’s network leverages existing physical infrastructure (datacentres,
        backhaul, etc), and MNF has SLAs with various physical infrastructure owners
        MNF has multiple service providers in each geography, with multiple levels of
        redundancy and backup
     MNF customers can access MNF’s entire network from a single datacentre
     access point, with simple handoff processes
        Legacy telco networks have not invested in software and platforms, and are
        unable to provide broad network access with a single point of connection

15
                                                                                                    © MNF Group Limited 2019

Key industry drivers
     Copper access network cease-sale in Australia, driving SMB/Enterprise
     to consider their telecom requirements and to migrate into the cloud
                                                                                 Growth in demand
     Ultra high speed broadband network rollout providing a generational       (more virtual numbers)
     migration opportunity

     Huge global focus on UCaaS evolution and CPaaS revolution               Capacity and rapid scalability
                                                                                      are critical
     Withdrawal of other industry participants from Voice & Wholesale
     segments
                                                                               Requires broad network
                                                                                      coverage
     Strong reputation for MNF quality, product capability and agility

     Global opportunity. Receiving strong interest from existing customers   Opportunity for geographic
     for NZ, Singapore and other APAC markets - urgently                      and acquisitive expansion
16
                                                                                                    © MNF Group Limited 2019

                                                                                                                               8
In Asia-Pacific

       The future is being built on capabilities
             that only MNF can deliver

     Lower cost   Flexible API              Reputation   Infrastructure

17
                                                                          © MNF Group Limited 2019

 Financials

                                                                                                     9
Key results summary
                                                                                    NPAT for the half is down on PCP due to
All organic Key Performance Indicators                                              investment activity and changing revenue
                                                                                    mix. Company is aiming to achieve a full year
are performing well on PCP                                                          NPAT of $11.0m to $12.0m

      25%                                 16%                                       FY19 H1 results primarily impacted by one-off items:
Number portability                   Wholesale customer
                                     growth                                                One-off acquisition costs of $800K, and
                                                                                           associated opportunity costs due acquisition of
                                                                                           Telco-In-A-Box business.
      10%                                 24%                                              Increase in depreciation due to New Zealand
                                                                                           and Singapore network assets coming on-line.
Virtual PBX                          Enterprise &
customer growth                      Government margin                                     Decrease in revenue for transaction revenues in
                                                                                           favour of monthly recurring revenues. Indicative
                                                                                           of changing revenue mix towards high-margin
                                                                                           monthly recurring revenue streams.

 19
                                                                                                                                            © MNF Group Limited 2019

 Financial summary FY19 H1
      Reported Result                                                                      FY19 H1            FY18 H1                 Δ

      Revenue                                                                               $98.1m             $116.7m              -16%

      Gross Margin                                                                          $35.8m             $34.1m                +5%

      Gross Margin %                                                                         36.5%              29.2%

      EBITDA^                                                                               $9.8m              $11.6m^              -16%

      NPAT                                                                                  $3.1m               $6.1m               -49%

      Earnings per share (cents)                                                             4.18                8.30               -50%

      Interim dividend per share - fully franked (cents)                                     2.10                4.30               -51%

             ^EBITDA excludes acquisition costs, net interest, non-cash option costs, tax, depreciation and amortisation. (FY18 H1 EBITDA
             restated to be consistent with this definition)

 20
                                                                                                                                            © MNF Group Limited 2019

                                                                                                                                                                       10
Revenue and Gross Margin
Revenue                                                                                                      Gross Margin
                              Consolidated group Revenue declined 16% due to                                                                        FY19 H1 Gross Margin increased by 5% to $35.8m (or
                              changing revenue mix away from Transaction Revenue                                                                    12% underlying growth when changing revenue mix
                              to higher-margin Recurring Revenue. Trend expected                                                                    eliminated). Gross margin percentage rose to 36%.
                              to continue delivering higher gross margin growth in                                                                  Guidance of $85m to $86m for FY19.
                              coming periods.

                     250                                                                                                                    90                                                                    Guidance          40%
                                                                                                  Guidance
                                                                                                                                            80                                                                                      35%
                     200                                                                                                                    70

                                                                                                                                                                                                                                           Gross Margin % of Revenue
                                                                                                                                                                                                                                    30%
                                                                                                                                            60
                                                                                                                                                                                                                                    25%
    Revenue ($m)

                                                                                                               Gross Margin ($m)
                     150
                                                                                                                                            50
                                                                                                                                                                                                                                    20%
                                                                                                                                            40
                     100
                                                                                                                                                                                                                                    15%
                                                                                                                                            30
                                                                                                                                                                                                                                    10%
                      50                                                                                                                    20

                                                                                                                                            10                                                                                      5%

                          -                                                                                                                     -                                                                                   -
                                   FY16                    FY17                 FY18                FY19E                                                 FY16                FY17              FY18                 FY19E

                                                       H1 Revenue     H2 Revenue                                                                           H1 Gross Margin           H2 Gross Margin            FY Gross Margin %

21
                                                                                                                                                                                                                                          © MNF Group Limited 2019

Gross Margin analysis
Gross Margin breakdown                                                                                       Gross Margin contributions
                              Group focused on growing recurring gross margin with                                                                  Recurring gross margin split of 61% expected for full
                              as-a-service business models.                                                                                         year including acquisitions, or 56% organically.
                                                                                                                                                    Represents an organic growth of 24% in recurring v’s
                              Recurring business models typically generate lower                                                                    transactional gross margin split during FY19.
                              gross revenue, but much higher gross margins and are
                              intrinsically stable.                                                                                                 Recurring margins grew 42% in FY19 H1 compared to
                                                                                                                                                    PCP.
                                                                                                                                                                                                                             Guidance
                                                                                                 Guidance
                     90                                                                                                                         100%

                     80                                                                                                                         90%

                     70                                                                                                                         80%
                                                                                                   33.5
                                                                                                                                                70%
                     60
                                                                                                                      Margin contribution (%)
 Gross Margin ($m)

                                                                                                                                                60%
                     50                                                       38.1
                                                                                                                                                50%
                                                         31.9
                     40
                                                                                                                                                40%
                                  29.5
                     30
                                                                                                   51.5                                         30%
                     20                                                                                                                         20%
                                                                              30.9
                                                         26.7
                     10           19.1                                                                                                          10%

                      -                                                                                                                              -
                                  FY16                   FY17                 FY18                FY19E                                                          FY16                FY17                FY18                  FY19E

                                         Recurring Gross Margin     Transactional Gross Margin                                                       Recurring Gross Margin Contribution      Transactional Gross Margin Contribution

22
                                                                                                                                                                                                                                          © MNF Group Limited 2019

                                                                                                                                                                                                                                                                       11
EBITDA and NPAT
  EBITDA                                                                                                                NPAT
                        EBITDA declined 16% to $9.8m attributable to                                                                       NPAT for the half is down on PCP due to one-off
                        accelerated investment in product development, and                                                                 acquisition cost, investment activity and changing
                        one-off impacts of acquisitions in H1. EBITDA guidance                                                             revenue mix. Company is aiming to achieve a full year
                        of $27m to $28m for FY19.                                                                                          NPAT Guidance of $11m to $12m for FY19.

                   30                                                                           14%                                  14                                                                          7%
                                                                                  Guidance

                                                                                                12%                                  12                                                             Guidance     6%
                   25

                                                                                                10%                                  10                                                                          5%
                   20
                                                                                                      EBITDA Margin %

                                                                                                                                                                                                                       NPAT Margin %
                                                                                                                         NPAT ($m)
     EBITDA ($m)

                                                                                                8%                                    8                                                                          4%
                   15
                                                                                                6%                                    6                                                                          3%

                   10
                                                                                                4%                                    4                                                                          2%

                   5
                                                                                                2%                                    2                                                                          1%

                    -                                                                           -                                      -                                                                         -
                            FY16               FY17               FY18              FY19E                                                        FY16                FY17             FY18            FY19E

                                   H1 EBITDA          H2 EBITDA          FY EBITDA Margin %                                                                H1 NPAT          H2 NPAT      FY NPAT Margin %

  23
                                                                                                                                                                                                                      © MNF Group Limited 2019

  Balance sheet (31 Dec. 2018)
Assets                                                                               A$’000                                          Liabilities                                                               A$’000
Current assets                                                                                                                       Current liabilities

Cash and cash equivalents                                                              10,487                                        Trade and other payables                                                  30,050

Trade and other receivables                                                            40,002                                        Loans and borrowings                                                      10,500

Income tax receivable                                                                    939                                         Customer deposits                                                          1,469

Inventory                                                                               1,350                                        Provisions                                                                 3,067

Total current assets                                                                   52,778                                        Total current liabilities                                                 45,086

Non-current assets                                                                                                                   Non-current liabilities

Property, plant and equipment                                                          29,070                                        Loans and borrowings                                                      43,875

Deferred income tax asset                                                               1,978                                        Financial instruments                                                      114

Goodwill and other intangibles                                                         87,657                                        Provisions                                                                 1,991

Total non-current assets                                                              118,705                                        Deferred tax liability                                                     2,804

Total assets                                                                          171,483                                        Total non-current liabilities                                             48,784

                                                                                                                                     Total liabilities                                                         93,870

  24                                                                                                                                 Net assets                                                                77,613
                                                                                                                                                                                                                      © MNF Group Limited 2019

                                                                                                                                                                                                                                                 12
Guidance
                                                                             FY18                   FY19                   FY20
                                                                            Actual                Guidance               Guidance

     Margin                                                                $69.0m             $85.0m - $86.0m        $100.0m - $105.0m

     EBITDA^                                                               $24.4m             $27.0m - $28.0m         $33.0m - $36.0m

     NPAT                                                                  $11.9m             $11.0m - $12.0m         $15.0m - $16.5m

     NPAT-A                                                                $13.9m             $14.5m - $15.5m         $19.5m - $21.0m

     Earnings Per Share (cps)                                               16.3c               15.0c - 16.4c          20.4c - 22.4c

        •     Guidance includes variables related to integration costs of acquisitions
        •     Combined FY19 Guidance includes 7 months contribution from acquisitions, and includes funding costs and estimated amortisation expense
        •     ^EBITDA excludes net interest, acquisition costs, non-cash option costs, depreciation & amortisation
        •     NPAT-A adds back all amortisation

25
                                                                                                                                         © MNF Group Limited 2019

Growth strategy

                    Geography                                                                Software
                    Expand infrastructure and presence                                       Expand our communications platform
                    throughout the Asia Pacific region                                       with new capabilities and products

                    Market share                                                             Wholesale partnerships
                    Acquire new customers with targeted                                      Build long term customer relationships
                    brands and tailored products                                             with steady margin growth

                                                        Acquisitions
                                                        Careful strategic addition of businesses that
                                                        compliment or expand our capabilities

26
                                                                                                                                         © MNF Group Limited 2019

                                                                                                                                                                    13
Appendix

Australian snapshot
     Australia is MNF’s home market where it is becoming a dominant player in the Wholesale
     Voice Telecommunications segment.

                 Population                             Telco carriage operators
                 24.8M                                  5   Telstra, Optus, Vocus,
                                                            TPG, Symbio (MNF)

                 Increase in data                       Mobile only users
                 allowance
                                                        6.7M
                     46%

                  NBN activations                                                             Businesses used cloud
                                                         NBN activations
                  56% in regional                                                             computing in 2016
                                                         1.1M > 2.4M
                  Australia                                                                   80%

28
                                                                                                         Sources: accc.gov.au | accc.gov.au
                                                                                                                                              © MNF Group Limited 2019

                                                                                                                                                                         14
New Zealand snapshot
 Symbio NZ is disrupting the local market. Our first wholesale
 customers have been onboarded, traffic is flowing.

                  Population                                Telco carriage operators
                  4.9M                                      5 Spark, Vodafone, Vocus,
                                                                2 degrees, Symbio (MNF)

                  Mobile                                     Mobile minutes
                  connections                                8.77B
                  6.4M

                  Fixed                                      Fixed voice
                  broadband                                  minutes
                  1.58M                                      3.44B
                  Fastest uptake of
                  fibre broadband in
                  the developed world
29
                                                                                            Sources: stats.govt.nz | Annual Telecommunications Report 2017
                                                                                                                                                               © MNF Group Limited 2019

Singapore snapshot
     Acquisition on Super Internet Access provides a regional foundation for growth, plus
     technical expertise that expands our Enterprise & Government capabilities.

                  Population                            Telco carriage operators
                  5.6M                                  4   Singtel, StarHub, M1, TPG,
                                                            Symbio (MNF)
                                                            (MVNO penetration is growing
                                                            rapidly, currently just 2 )

                  Business & Corporate                  Mobile subscriptions
                  line subscribers                      (2G+3G+4G)
                  700,000                               8,464,400
                                                                                                                               Dark fibre loops in CBD

                  Residential line                      Outgoing retail international
                                                                                                                               FBO license
                  subscribers                           telephone call minutes
                  1,300,100                              351,563,900
                                                                                                                               NBN coverage

30
                                                                                                                      Sources: imda.gov.sg | singstat.gov.sg
                                                                                                                                                               © MNF Group Limited 2019

                                                                                                                                                                                          15
Glossary
     API – A set of coding standards for developers wishing to connect different bits of software.
     Copper access network – Telephone wires, cables and physical equipment connecting subscribers to a local exchange.
     CPaaS – A framework for developers to add telecom capabilities to their software, without needing to build backend infrastructure.
     MVNO – A way to provide mobile services without need to build an independant mobile network.
     Porting – The process of transferring a phone number from one telecom carrier to another.
     PSTN – The global network of phone users, encompassing every phone number in the world.
     Recurring Revenue – Revenue that is billed every month regardless of user activity, typically high margin and stable.
     SLA – The agreed standard of service reliability between a customer and a service provider.
     SIP Trunk – A way for voice and video calls to travel over VoIP networks. It is the digital equivalent of a phone line.
     Termination – The process of routing a phone call, from one telecom provider to another, until it reaches the recipient.
     Transaction Revenue – Revenue that is billed when a user makes a phone call, typically low margin and variable.
     UCaaS – Software that enables users to call, conference and message from a single interface, delivered as-a-service via the cloud.
     Virtual Number – A phone number that is operated on a VoIP network without needing an underlying phone line service.
     Virtual PBX – A business phone service, typically connecting multiple business users, delivered as-a-service via the cloud.
     VoIP – A way of turning phone calls into data that can transmitted over the internet and routed to any recipient.

31
                                                                                                                                   © MNF Group Limited 2019

Thank you
      For further information please contact:
      Rene Sugo, Group CEO
      rene.sugo@mnfgroup.limited
      +61 (2) 9994 8590

      Visit website:
      http://mnfgroup.limited

32
                                                                                                                                   © MNF Group Limited 2019

                                                                                                                                                              16
Disclaimer
     This presentation and the accompanying oral presentation provide                This presentation and the accompanying oral presentation contain
     general background information about the activities of MNF Group                forward looking statements. All statements other than statements of
     Limited (MNF) current at 3 May 2019. The information is general in nature       historical fact in this presentation, including MNF’s expectation about
     only and does not claim to be a complete and accurate representation of         future performance of its business, future financial position and earnings,
     matters that an investor or potential investor should consider when             planned products and services, business strategy, market size, growth
     evaluating MNF. It should not be relied on as advice or recommendation          opportunities, competitive position and market and technology trends,
     to investors or potential investors and does not take account of the            are forward looking statements. MNF has no obligation to update any
     investment objectives, financial situation or needs of any particular           forward looking statements after the date of this presentation, except as
     investor, which should be considered when deciding whether to make an           required by applicable law.
     investment.
                                                                                     Forward looking statements involve known and unknown risks,
     To the full extent the law permits, MNF Group Limited, its related bodies       uncertainties, assumptions and other factors that may cause MNF’s actual
     corporate and their directors, officers and employees do not warrant the        results, performance and outcomes to differ materially from those
     accuracy, reliability or completeness of the information contained in this      expressed or implied in the statements. Many of the risks, uncertainties,
     presentation and the accompanying oral presentation and disclaim any            assumptions and other factors are outside MNF’s control. As well, MNF
     responsibility or liability flowing from anyone’s use of this information. To   operates in a very competitive and rapidly changing environment and new
     the full extent the law permits, MNF Group Limited, its related bodies          risks may emerge from time to time. It is not possible for MNF to predict
     corporate and their directors, officers and employees do not accept any         all risks or to assess the impact of all factors on its business or the extent
     liability to any person, organisation or entity for any loss or damage          to which any one or more factors may cause actual results or outcomes to
     suffered as a result of relying on this document or the accompanying oral       differ from forward looking statements. Forward looking statements are
     presentation.                                                                   not a guarantee of future performance and should not be relied on.
                                                                                     Actual results and performance may differ significantly from those
     This presentation does not constitute an invitation or offer to purchase,       expressed or implied by the forward looking statements. Past
     subscribe for or otherwise deal in any securities.                              performance is not necessarily a guide to future performance.
     This presentation and the accompanying oral presentation contain                For further information about MNF please refer to the ASX:MNF for MNF’s
     estimates and other data of independent third parties which MNF has not         most recent audited financial report, which has been prepared in
     independently verified. MNF does not guarantee the accuracy or                  accordance with Australian Accounting Standards, Australian Accounting
     completeness of third party estimates or data.                                  Interpretations, other authoritative pronouncements of the Australian
                                                                                     Accounting Standards Board (AASB) and the Corporations Act 2001(Cth).
33
                                                                                                                                                            © MNF Group Limited 2019

                                                                                                                                                                                       17
You can also read