FY 2018 RESULTS - Primary Health Care
←
→
Page content transcription
If your browser does not render page correctly, please read the page content below
FY 2018
RESULTS
YEAR ENDED 30 JUNE 2018
PRIMARY’S
                            VISION

2   EVENT TITLE TEXT HERE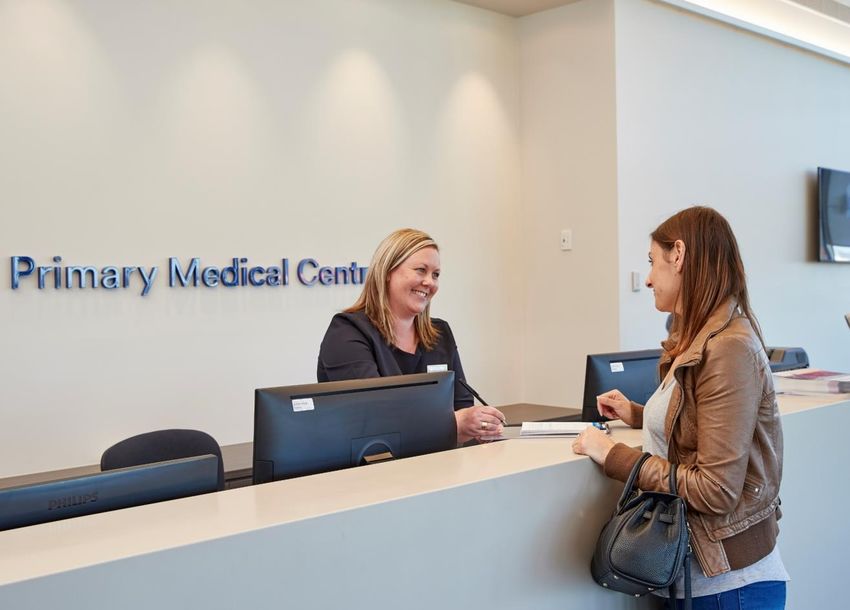
PRIMARY’S VISION
                                                                           Our Purpose
»   Healthcare in Australia largely unchanged for decades                  We are inspired to care for your health and wellbeing at every stage of life.

»   At a watershed with costs, technology and choice driving change
                                                                           Our Mission
»   Primary has the scale, people and drive to lead the sector
                                                                           We share a mission to seek and sustain life-enhancing healthcare delivered by
»   New Purpose, Mission and Values                                        people who care.

»   Brand reset in train to align to values                                Our Values

»   Comprehensive review of businesses undertaken

»   Pathway to growth:

    –    Repositioning the model in Medical Centres
    –    Leading-edge infrastructure platforms in Pathology and Imaging
    –    Growth in services including IVF, scalable day surgery platform

»   Become Workplace of Choice in community care

»   Delivering care when, where and how consumers want it

3       FY 2018 RESULTS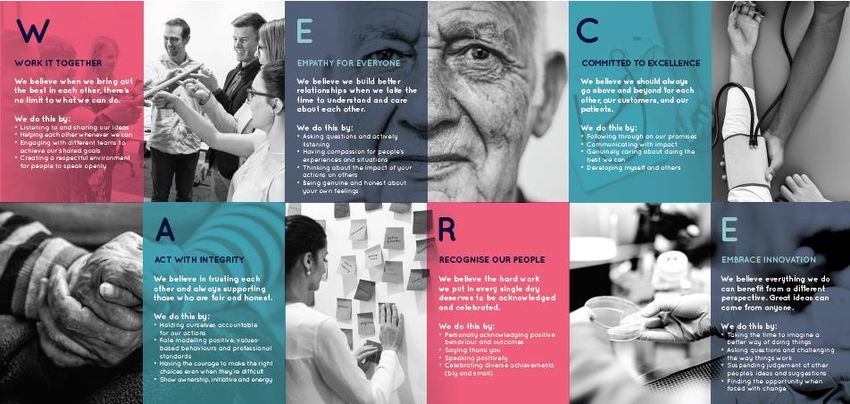
INITIATIVES ACROSS THE GROUP
                                    PEOPLE                                                               PROCESS                                                             PROPERTY
                               workplace of choice                                                organisational efficiency                                              yield optimisation

                      ✓   Purpose, Mission and Values                                  ✓    Modernisation of corporate support services                     ✓   Outsourced facilities management / leasing
     GROUP            ✓   Performance management framework                                  infrastructure                                                  ✓   Property cost optimisation program

                                                                                      ✓    LIS1 delivering efficiencies and improved patient                ✓   ACC5 network optimisation
                      ✓   Staff engagement                                                 experience                                                       ✓   Laboratory uplifts
    Pathology         ✓   LIS1/SWA2 delivering improved referrer                      ✓
                          experience and enhanced brand
                                                                                           Optimisation of pre-analytical processes                         ✓   Specialty service expansion
                                                                                      ✓    Technology upgrade to SWA2                                       ✓   ACC enhancement in Medical Centres

                      ✓   Quality reset = right culture
                                                                                      ✓     Re-engineering clinic and corporate support
                      ✓   Attract HCP4s with simplified contracts,                          workflows                                                       ✓   Modernise, improve and extend 52 Medical
                          career pathways, skills development,
     Medical              appointment model, new team                                 ✓     Improved integration to reduce leakage                              Centres

     Centres          ✓   New streams via young professionals,                        ✓     Modernise HCP4 billing practices                                ✓   Expansion of service offerings including urgent
                                                                                                                                                                care
                          Barefoot GPs, roll-in M&As                                  ✓     Better consumer experience: online access via
                      ✓   Improving nursing and support staff                               websites and apps, e-recalls, continuity of care

                                                                                                                                                            ✓   Revitalisation of community sites
                      ✓                                                                ✓     Labour and operating model optimisation in
                          Staff engagement
                                                                                             dispersed community network                                    ✓   Optimisation of hospitals inc. NBH6
    Imaging           ✓   iCAR3 delivering improved radiologist
                                                                                       ✓     iCAR3  delivering efficiencies and improved                    ✓   Development of high-end sites
                          experience and enhanced brand
                                                                                             patient experience                                             ✓   Upgrade within Medical Centres

                                                    1 Laboratory Information System                                         5 Approved Collection Centres
4   FY 2018 RESULTS                                 2 Serum Work Area
                                                                                      3 Imaging Core Application Refresh
                                                                                      4 Healthcare Professionals            6 Northern Beaches Hospital
GROUP
RESULTS
UNDERLYING PROFIT STABLE
     Group                                                                Underlying1                                    Reported2
     $m                                                            FY 2018              FY 2017             FY 2018                  FY 2017
     Revenue                                                       1,740.3              1,658.6              1,740.3                  1,658.6
     EBIT                                                           167.0                174.6                 71.5                   (469.7)
     NPAT                                                            92.3                 92.1                 8.9                    (516.9)
     As at                                                                                                30 June 2018             30 June 2017
     Free cash flow3                                                                                            146.6                    141.5
     Dividend cps 100% franked (60% UNPAT)                                                                       10.6                    10.6

    » Revenue growth of 4.9%
    » Improved EBIT contribution from Pathology (+1.3%), Imaging (+16.6%) and Corporate, partially offsetting Medical Centres
      contraction where Project Leapfrog aims to deliver growth
    » UNPAT in line with FY 2017 with benefits of balance sheet and cash flow initiatives. Growth in UNPAT when normalised for
      start-up costs of greenfield sites and Health & Co4
    » Free cash flow of $147m up 3.6% on FY 2017
    » Reported EBIT includes impairments ($49.5m), investment in restructuring and strategic initiatives ($40.9m), and non-recurring
      items ($5.1m)
                                                                                    1 All comments relate to underlying results unless specifically noted
                                                                                    2 Reported performance reconciliation- slide 10
                                                                                    3 FCF is before growth capex - slide 7
                                                                                    4 Business as Usual reconciliation - slide 9
6    FY 2018 RESULTS
FREE CASH FLOW REMAINS SOLID
         250

         200                                                                          92
                                         (55)
         150
    $m

         100            202                                                (77)
                                                          147
          50                                                                                                     (57)
                                                                                                70                               13
             0
                        OCF           Maintenance    Free cash flow    Growth capex   Cash flow after growth   Dividends   Cash flow after
                                         capex                                                capex                          dividends

         »       Operating cash flow:
                 – Includes investment in non-underlying initiatives
                 – Benefitted from reduced tax and interest costs
         »       Free cash flow before growth capex of $147m, up 3.6% on FY 2017
         »       Growth capex includes:
                 – Acquisition of GP clinics
                 – New Medical Centres, Perth IVF and Day Surgery, Kawana
                 – BPI contract, iCAR, Northern Beaches and Highfields in Imaging

7    FY 2018 RESULTS
DEBT LEVELS MAINTAINED
    Reported                                                                                    As at
    $m                                                            30 June 2018     30 June 2017      30 June 2016       30 June 2015
    Total debt                                                        860.8            879.7             898.3             1,205.5
    Cash                                                              (84.0)          (95.5)            (82.3)              (50.0)
    Net debt                                                          776.8           784.2             816.0                 1,155.5
    Bank gearing ratio (covenant 3.0x)                               9.0x            7.9x              6.6x                  5.9x
    Gearing (net debt: net debt + equity)                             29.9%           29.5%             25.2%                 32.4%

                                                                                                           Net debt reduction
    »   Significant improvement in leverage since FY 2015 from capital recycling
                                                                                           1,200
        program and, more recently, free cash flow generation
                                                                                                        1,156
    »   Discipline at divisional level, spending only what they generate                   1,000

    »   Need to balance gearing and dividends with capital demands:
                                                                                               800
        – Investing in essential infrastructure                                                                  816    784     777
        – Turnaround of Medical Centres and GP expansion                                       600
                                                                                                        FY15     FY16   FY17      FY18

8   FY 2018 RESULTS
GROWTH ON BAU BASIS
        Underlying                                                                                FY 2018                 FY 2017                    Better/
                                                                                                    $m                      $m                     (worse) %
        EBIT                                                                                        167.0                   174.6                    (4.4)
        New centres / Health & Co                                                                    14.8                     5.7
        EBIT Business as Usual                                                                      181.8                   180.3                     0.8

    » FY 2018 underlying EBIT up 0.8% and underlying NPAT up 7.6% on BaU basis, reflecting large number of new sites opened this year
    » Recognises net costs of greenfield centres1 and start-up costs in Health & Co

                                                                                                                                           FY 2018                 FY 2017
                                                                                                                                      Medical Centres
                                                                                                                                                                Medical Centres
                                                                                                                                Craigieburn, Greensborough,
                                                                                                                                                                    Corrimal
                                                                                                                               Narellan, Robina (opened 7/18)

                                                                                                                                                                      IVF
                                                                                                                                             IVF
                                                                                                                                                                  Brisbane IVF
                                                                                                                                    Perth IVF & Day Surgery

                                                                                                                                                                   Imaging
                                                                                                                                           Imaging
                                                                                                                                                                   River City
                                                                                                                                           Kawana

                         Primary Medical Centre Robina

9      FY 2018 RESULTS
                                                     1 3-year   ramp-up is assumed for greenfield sites, excludes brownfields and Imaging hospital contracts
UNDERLYING RESULTS REFLECT CORE TRADING
        FY 2018                                                    Restructuring &       Non-recurring
        $m                       Reported         Impairment     strategic initiatives      items        Underlying
        EBIT                       71.5              49.5                40.9                 5.1          167.0
        Finance costs              (35.1)                                                                   (35.1)
                                                                 $95.5m EBIT adjustment
        PBT                        36.4                                                                     131.9
        Income Tax                 (27.5)                                                                   (39.6)
        NPAT                        8.9                                                                      92.3
        FY 2017                                                    Restructuring &       Non-recurring
        $m                       Reported         Impairment     strategic initiatives      items        Underlying
        EBIT                      (469.7)            587.0               39.2                18.1           174.6
        Finance costs              (43.1)                                                                   (43.1)
                                                                $644.3m EBIT adjustment
        PBT                       (512.8)                                                                   131.5
        Income Tax                 (4.1)                                                                    (39.4)
        NPAT                      (516.9)                                                                   92.1
     » Impairments relate to the leases and associated assets at three medical centres. These resulted from the detailed the site-by-
       site review of Medical Centres in preparation for Leapfrog’s comprehensive modernisation and expansion program
     » Strategic initiatives of $31.6m include iCAR $2.0m, Leapfrog $1.9m, Pathology platforms $1.6m, corporate functions including IT
       $6.8m, Finance $3.7m, Property $2.1m, HR $1.1m and business set-up costs $5.5m
     » Restructuring costs were $9.3m
     » Non-underlying items in FY 2019 expected to be for major projects including Leapfrog in Medical Centres, technology in
       Pathology and Imaging and corporate support functions
10     FY18 RESULTS
DIVISIONAL RESULTS & STRATEGIES
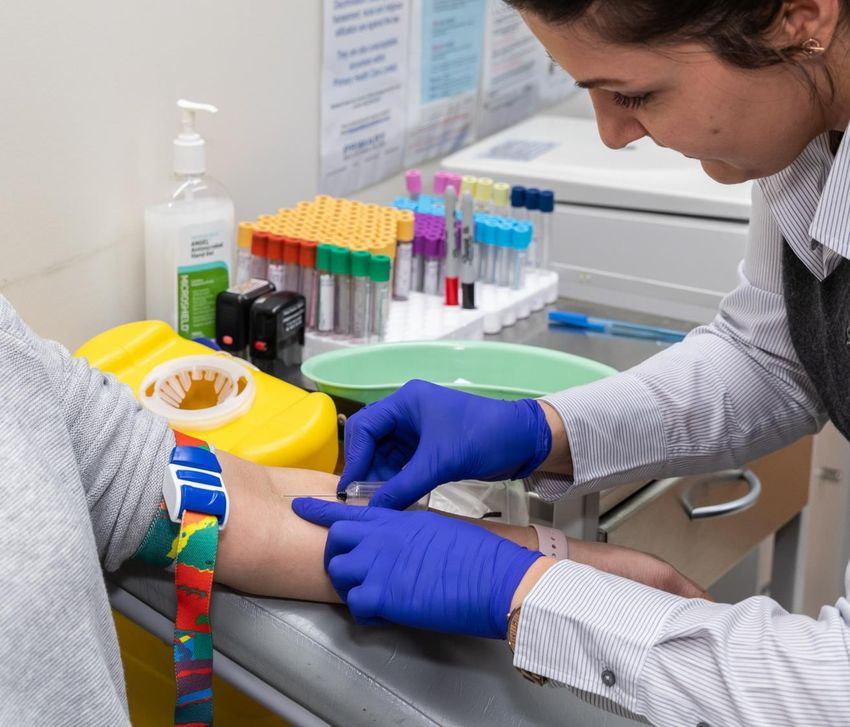
PATHOLOGY: STRONG CORE PERFORMANCE
     Underlying                                                                   FY 2018                       FY 2017                        Better/
                                                                                    $m                            $m                         (worse) %
     Revenue                                                                      1,090.6                        1,038.4                          5.0
     EBITDA                                                                        145.6                          146.0                          (0.3)
     Depreciation                                                                  (19.0)                         (18.8)                         (1.1)
     Amortisation                                                                   (5.6)                          (7.7)                         27.3
     EBIT                                                                          121.0                          119.5                           1.3
     Total capital expenditure                                                      21.1                           26.9                          21.6

     »     Pathology continues to generate strong cash flow
     »     EBIT growth of ~4% normalising for Healthscope collection centres disposal. Also impacted by FOBT loss and Dorevitch
           provisioning
     »     Revenue up 5.0% with increases in volume and price assisted by niche specialities: histopathology, genetics, vets
     »     Reflects good market growth for the majority of the year but a softer market in May and June
     »     Continued success with Approved Collection Centre (ACC) rents growing at a lower rate than revenue
     »     Consumable costs increased due to coning1 and higher value tests e.g. in-house NIPT was up nearly three-fold
     »     Capex down in FY 2018 due to ACC discipline and timing of projects. LIS to commence in FY 2019
                                             1 Coning is the arrangement whereby only the top three items by value in a single patient episode are paid
12                                           for under the MBS when requested by a GP for out-of-hospital services
         FY 2018 RESULTS
PATHOLOGY: CONSISTENT GROWTH
The Pathology division is Primary’s largest business producing consistent growth over a long period
» Whole-of-Primary approach: increased footprint and improved visibility under
Project Leapfrog
» Strong focus on staff engagement
» Re-platforming technology in LIS and SWA to deliver significant clinical, operational
and financial benefits and to support future growth
» Refer Capital Raising presentation
PEOPLE PROCESS PROPERTY
Attract the best Optimisation in ACC network optimisation
healthcare professionals pre-analytical process
Speciality services expansion
Improve referrer experience Technology upgrade via SWA
Laboratory uplifts
Strong focus on staff Improved consumer experience
engagement ACC enhancement in
Medical Centres
13 FY 2018 RESULTSPRY MEDICAL CENTRES:
GREENFIELD COSTS AND CONTRACT TRANSITION
Underlying FY 2018 FY 2017 Better/
$m $m (worse) %
Revenue 313.4 317.8 (1.4)
EBITDA 99.3 125.8 (21.1)
Depreciation (18.0) (20.8) 13.5
Amortisation (45.5) (55.4) 17.9
EBIT 35.8 49.6 (27.8)
HCP capital expenditure 26.8 30.3 11.6
Total capital expenditure 57.6 56.4 (2.1)
3 years through 5 year process Value proposition balanced
with new contracts to improve with GP share of billings up
cash flow and widen appeal and PRY’s down Additional investments in greenfield sites
Plus recruit and support GPs
HCP capex at $26.8m, less than half FY GP revenue down $11.7m due to Expand offerings for consumers
2015, before new contracts, releasing lower share of higher gross billings.
capital for investment Dental and IVF revenue improved. EBIT down $6.9m (13.4%), normalised for greenfield sites.
FY19 onwards = comprehensive evolution of model under Leapfrog to turn around value proposition
14 FY 2018 RESULTSPRY MEDICAL CENTRES: GP KEY DRIVERS
GPs FY 2018 FY 2017 FY 2016 FY 2015 Better/
(worse) %
FY18-FY17
Headcount 1,056 1,040 960 923 1.5
1
FTEs 945 959 920 908 (1.5)
Gross billings ($m) 425.2 416.0 417.5 415.8 2.2
Share of revenue (%) 40.3% 44.0% 46.7% 48.2% (370) pp
2
Revenue ($m) 171.5 183.2 195.1 200.7 (6.4) Capex more than halved,
3 releasing funds for
GP capital expenditure 24.9 27.4 53.2 63.7 (9.1)
expansion
» Headcount up but FTEs down due to PRY quality reset and other initiatives which are essential for future growth
» Gross billings up with higher overall hours and greater non-Medicare billings per patient
» Lower PRY revenue due to lower % share. Three years through recycling of old five year contracts
» Capex more than halved from FY 2015, releasing funds for expansion
1 FTEs based on 40-hour week, 47-week year
2 Revenueincludes revenue earned by registrars who are employed rather than under contract and not included
in GP numbers. FY 15-17 restated for consistency (FY18 53 registrars)
3 GP capex only. HCP capex on slide 11 includes $1.4m in IVF and specialists
15 FY 2018 RESULTSPRY MEDICAL CENTRES: GP RECRUITMENT
Having the right GPs in the right clinics is paramount
Numbers
» Record of 159 new GPs recruited
» Nearly half of leavers due to PRY initiatives = clinic closures, quality reset program and holding the line on offers = essential for
future
» Retention at industry levels (FTE 94%) normalised for PRY initiatives
Cost
» $18m after-tax GP capex ($25m pre-tax) with $6m upfronts for new GPs (14%), $8m upfronts for re-signs
110 40
35
60 30
GP capex ($m)
# of GPs
25
10
20
1H15 2H15 1H16 2H16 1H17 2H17 1H18 2H18
(40) 15 PRY initiatives
10 essential for
future growth
(90) 5
Joiners (LHS) Leavers (LHS) After-tax capex (RHS)-1 PRY initiatives
16 FY 2018 RESULTSPRY MEDICAL CENTRES: OTHER REVENUE
Dental and IVF growth
Dental
» Strong recruitment and quality reset with 137 closing FTEs
» Revenue and EBIT up 8% to $34.2m and $4.6m respectively
» Improvements in key drivers
» Dental in 61 Medical Centres with targeted expansion under Leapfrog
IVF
» Expanded laboratory in Sydney and full year trading in Brisbane, new Perth centre
» Total cycles of 6,500 and revenue of $11.2m, both up over 30%
» EBIT breakeven with mature sites delivering good returns while Brisbane in ramp-up
» Further expansions and enhancements in FY 2019
Other revenue
» Other medical services revenue of $29.6m includes Specialist, Day
Surgeries and Allied Health
» Non-medical revenue of $66.9m includes rental income and grants
» Broadly in-line with FY 2017
17 FY 2018 RESULTSLEAPFROG
A comprehensive renewal of the operating model
» A unique portfolio of large-scale clinics with competitive advantages in terms of size, location, accessibility
and range of services
» Project Leapfrog will deliver a comprehensive renewal of the operating model
» Underpinned by three streams of activities:
PEOPLE PROCESS PROPERTY
Attract the best Optimise space
Increase
healthcare utilisation
operational efficiency
professionals
Introduce
Improve the patient new services
Become workplace
experience
of choice
Uplift facilities
» Refer Capital Raising presentation
18 FY 2018 RESULTSHEALTH & CO: ACCRETIVE PRACTICES; FOCUS ON
ROLL-INS
Underlying FY 2018 FY 2017
$m $m
Revenue 6.2 1.8 11 medical practices
EBITDA (4.1) (2.3)
Depreciation - - ~100 general practitioners,
64 FTE GPs
Amortisation (0.1) -
EBIT (4.2) (2.3) $6m in annual practice earnings
Capital expenditure 9.8 8.4
Operations in NSW, VIC, QLD, SA
» Loss reflects the ramp-up of M&A capabilities and phasing of acquisitions.
High quality established practices
Break-even in June 2018. (2/3rd private billing)
» H&C practices:
– 16% EBITDA growth on average during 1st year in network Professor Kerryn Phelps as brand
ambassador
– 100% retention of GPs during transition
– Growth in new patient numbers Additional allied health / specialist
clinicians
» In FY 2019, M&A capabilities to support acquisition of clinics in Medical
Centres’ catchment areas under Leapfrog
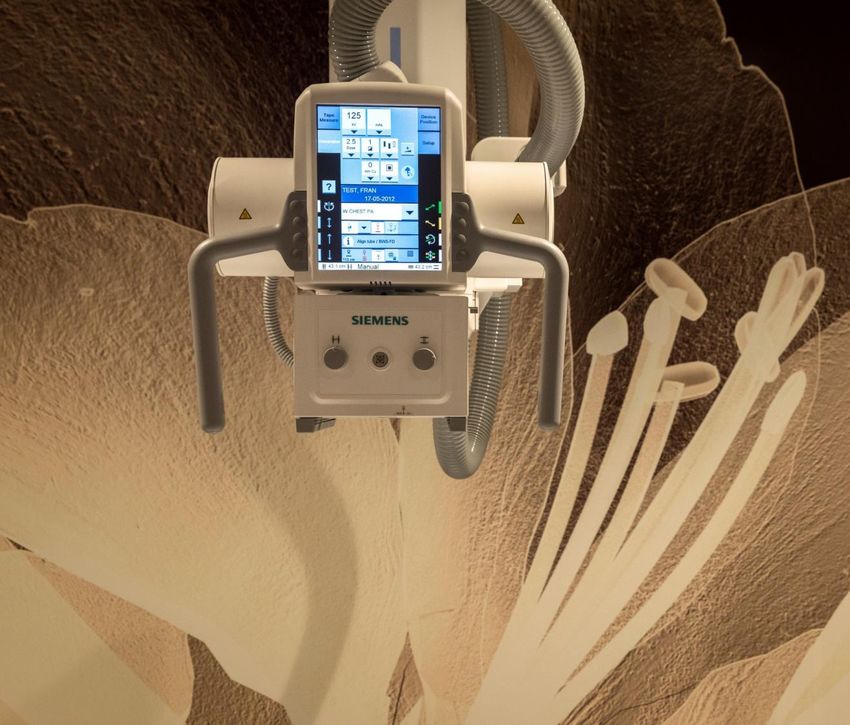
19 FY 2018 RESULTSIMAGING: STRONG PROFIT GROWTH
Underlying FY 2018 FY 2017 Better/
$m $m (worse) %
Revenue 368.4 333.5 10.5
EBITDA 57.0 57.8 (1.4)
Depreciation (14.0) (16.8) 16.7
Amortisation (9.2) (12.0) 23.3
EBIT 33.8 29.0 16.6
HCP capital expenditure 2.8 4.3 34.9
Total capital expenditure 36.9 28.2 (30.9)
» Revenue up 10.5% with continued strength in the hospital segment, MRI and CT
» Reflects on-going good market growth levels and a lift in market share. Some slow-down in May and June referrals
» Successful Brisbane Private Imaging (BPI) acquisition in January 2018 contributed $3.5m in revenue
» Strong EBIT expansion reflecting turnaround strategy over last 2 years and focus on Hospital and Medical Centres segments
» EBITDA movement due to equipment sale and leaseback and REIT. Normalised EBITDA grew by ~4%
» Capex includes BPI, Kawana Imaging Centre, Northern Beaches, Highfields and iCAR
20 FY 2018 RESULTSIMAGING: COMMUNITY SITES AND OPERATIONAL
ENHANCEMENTS
Revitalisation of community sites focusing on consumer value proposition, rebrand and marketing
» Investment in iCAR : technology replacement and innovation across Holy Spirit Northside Private
Hospital, Brisbane
radiologist workflow, voice recognition, referrer delivery channel and
enhanced imaging
» Revitalisation of community sites with focus on consumer value
proposition, rebrand and marketing
» Labour optimisation and standard operating model development
PEOPLE PROCESS PROPERTY
Staff engagement Operational efficiency Uplift to community
& medical centre sites
Brand enhancement Improved referral
Development of Northern Beaches Hospital, Sydney
delivery channels
Improved radiologist high-end sites
experience Patient experience
improvements Optimise hospitals
21 FY 2018 RESULTS Siemens MRI imaging equipmentCORPORATE
Underlying FY 2018 FY 2017 Better/
$m $m (worse) %
Revenue 0.0 0.1 (100.0)
EBITDA (15.6) (16.1) 3.1
Depreciation (2.5) (2.8) 10.7
Amortisation (1.3) (2.3) 43.5
EBIT (19.4) (21.2) 8.5
» FY 2018 decrease reflecting savings from Head Office
streamlining
» Modernisation of support functions to deliver best-in-class
services in IT, Finance, Property and HR including: PEOPLE PROCESS PROPERTY
‒ Outsourcing property maintenance and lease management
Purpose, Mission Modernisation of Facilities
‒ Centralised and automated purchasing system & Values corporate support management & leasing
‒ IT platform Performance services outsourcing
management infrastructure
‒ Websites for all businesses, Medical Centres, with whole-of- Property cost
framework
group search functionality optimisation program
Brand
» Programs will deliver cost savings, efficiencies and risk mitigation
FY 2019 onwards
22 FY 2018 RESULTSFY 2019 FORECAST
» Primary currently expects underlying NPAT in FY 2019 to be at or above FY 2018 underlying NPAT, prior to the impact of the capital
raising and potential acquisition
» Based on current trading activity, industry growth is expected to be slower in 1H 2019 and then normalise to long-term growth rates
» Assuming successful capital raising and completion of the potential acquisition, Primary anticipates the following adjustments to FY
2019 underlying NPAT:
– Interest expense savings resulting from the $250m proceeds of the capital raising
– Contribution from the potential acquisition from the date of completion (expected to be September-October 2018)
» A further update regarding Primary’s trading and outlook will be provided at the AGM in November 2018
23 FY 2018 RESULTSAPPENDICES
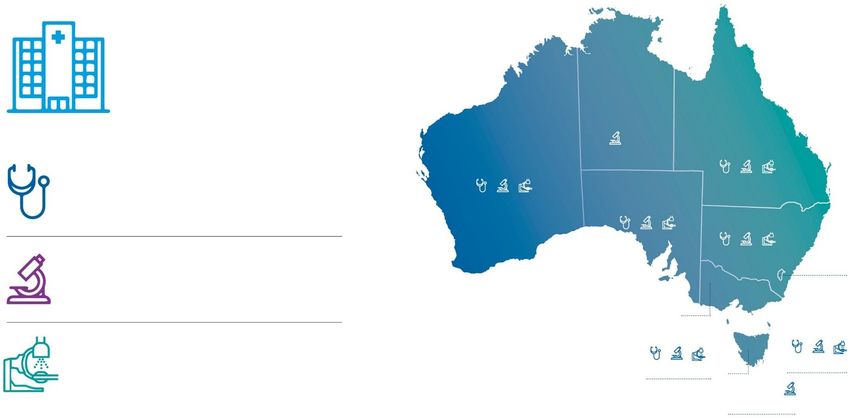
A market leading network
AUSTRALIA-WIDE COVERAGE
2,604 Total sites
21 TOTAL
SITES
671 TOTAL
SITES
21
217 TOTAL SITES
84 73 Primary Medical Centres 16 621 34
7 206 4 62 TOTAL SITES
Centres 11 Health & Co
861 TOTAL SITES
7 50 5
34 764 63
2,377 2,269 ACCs
39 TOTAL
Pathology 108 Laboratories SITES
710 TOTAL SITES
2 34 3
143 28 Hospitals 18 658 34
Diagnostic 62 Community Centres 23 TOTAL
SITES
Imaging 53 Medical Centres 23
As at July 2018
24 FY 2018 RESULTSINDUSTRY TRENDS
Pathology: Market Services & Benefits Diagnostic Imaging: Market Services & Benefits
12% 10%
9%
10%
8%
8%
5 year growth rate of 6.2%
7%
5 year growth rate of 4.4% 6%
6%
5%
4%
4%
2% 3%
2%
0%
1%
-2% 0%
Jun 13 Dec 13 Jun 14 Dec 14 Jun 15 Dec 15 Jun 16 Dec 16 Jun 17 Dec 17 Jun 18 Jun 13 Dec 13 Jun 14 Dec 14 Jun 15 Dec 15 Jun 16 Dec 16 Jun 17 Dec 17 Jun 18
Services (12m rolling) Benefits (12m rolling) Services (12m rolling) Benefits (12m rolling)
GPs: Market Services & Benefits* Specialist: Market Services & Benefits
8% 9%
8%
7%
5 year growth rate of 5.7% 7%
6%
5 year growth rate of 4.6%
6%
5%
5%
4%
4%
3%
3%
2%
2%
1% 1%
0% 0%
Jun 13 Dec 13 Jun 14 Dec 14 Jun 15 Dec 15 Jun 16 Dec 16 Jun 17 Dec 17 Jun 18 Jun 13 Dec 13 Jun 14 Dec 14 Jun 15 Dec 15 Jun 16 Dec 16 Jun 17 Dec 17 Jun 18
Services (12m rolling) Benefits (12m rolling) Services (12m rolling) Benefits (12m rolling)
* Broad type of service (BTOS): unreferred GP attendances
25 FY 2018 RESULTSDIVISIONAL RECONCILIATION: UNDERLYING EBIT
FY 2018 Pathology Medical Centres1 Imaging Corporate Group2
$m
Revenue 1,090.6 319.6 368.4 - 1,740.3
EBITDA 145.6 95.2 57.0 (15.6) 282.2
Depreciation (19.0) (18.0) (14.0) (2.5) (53.5)
Amortisation (5.6) (45.6) (9.2) (1.3) (61.7)
EBIT 121.0 31.6 33.8 (19.4) 167.0
FY 2017 Pathology Medical Centres1 Imaging Corporate Group2
$m
Revenue 1,038.4 319.6 333.5 0.1 1,658.6
EBITDA 146.0 123.5 57.8 (16.1) 311.2
Depreciation (18.8) (20.8) (16.8) (2.8) (59.2)
Amortisation (7.7) (55.4) (12.0) (2.3) (77.4)
EBIT 119.5 47.3 29.0 (21.2) 174.6
1 Medical centres includes PRY Medical Centres and Health & Co – refer slide 27 for analysis
2 $38.3m of inter-company revenue/expenses have been eliminated at the Group level (FY 2017 $33.0m)
26 FY 2018 RESULTSMEDICAL CENTRES RECONCILIATION: UNDERLYING EBIT
FY 2018 Primary Health & Co Medical Centres
$m Medical Centres
Revenue 313.4 6.2 319.6
EBITDA 99.3 (4.1) 95.2
Depreciation (18.0) - (18.0)
Amortisation (45.5) (0.1) (45.6)
EBIT 35.8 (4.2) 31.6
FY 2017 Primary Health & Co Medical Centres
$m Medical Centres
Revenue 317.8 1.8 319.6
EBITDA 125.8 (2.3) 123.5
Depreciation (20.8) - (20.8)
Amortisation (55.4) - (55.4)
EBIT 49.6 (2.3) 47.3
27 FY 2018 RESULTSHCP ACQUISITIONS: TAX IMPLICATIONS
Healthcare Professionals contracted on or after 1 July 2015:
» Deferred tax liability (DTL) to be recognised at the time of the acquisition of healthcare practices and capitalisation of contractual
relationship intangible assets
» Equal movement in DTL will ensure an effective tax rate of 30%
Healthcare Professionals contracted prior to 30 June 2015:
» No DTL has been recognised regarding the acquisition of healthcare practices and capitalisation of contractual relationship
intangible assets to-date
» Therefore there is a non-deductible (permanent) difference which will increase the notional effective tax rate above 30%. This will
progressively decrease as the associated amortisation expense is recognised and runs off
» The additional accounting tax expense is as follows:
$m 2019 2020
Additional Accounting Tax Expense 4.5 2.2
28 FY 2018 RESULTSDISCLAIMER
» This presentation has been prepared by Primary Health Care Limited (ACN 064 530 516) (‘PRY’).
» Material in this presentation provides general background information about PRY which is current as at the date this presentation is made. Information in
this presentation remains subject to change without notice. Circumstances may change and the contents of this presentation may become outdated as a
result.
» The information in this presentation is a summary only and does not constitute financial advice. It is not intended to be relied upon as advice to investors
or potential investors and has been prepared without taking account of any person’s investment objectives, financial situation or particular needs.
» This presentation is based on information made available to PRY. No representation or warranty, express or implied, is made in relation to the accuracy,
reliability or completeness of the information contained herein and nothing in this presentation should be relied upon as a promise, representation,
warranty or guarantee, whether as to the past or future. To the maximum extent permitted by law, none of PRY or its directors, officers, employees,
agents or advisers (PRY parties) accepts any liability for any loss arising from the use of this presentation or its contents or otherwise arising in
connection with it, including, without limitation, any liability arising from the fault or negligence on the part of any PRY parties.
» Those statements in this presentation which may constitute forecasts or forward-looking statements are subject to both known and unknown risks and
uncertainties and may involve significant elements of subjective judgment and assumptions as to future events which may or may not prove to be correct.
Events and actual circumstances frequently do not occur as forecast and these differences may be material. The PRY parties do not give any
representation, assurance or guarantee that the occurrence of the events, express or implied, in any forward-looking statement will actually occur and you
are cautioned not to place undue reliance on forward-looking statements.
» This presentation is provided for information purposes only and does not constitute an offer, invitation or recommendation with respect to the subscription
for, purchase or sale of any security and neither this document, nor anything in it shall form the basis of any contract or commitment. Accordingly, no
action should be taken on the basis of, or in reliance on, this presentation.
29 FY 2018 RESULTSYou can also read


