APRIL 2018 - Hemisphere Energy
←
→
Page content transcription
If your browser does not render page correctly, please read the page content below
APRIL 2018
The Hemisphere Strategy
Focused on creating long-term shareholder value by continually
developing our low cost / high rate of return oil assets
Geographic Focus
Production and landbase located in friendly jurisdiction of southeast Alberta
Strategic acquisitions of offsetting production and drilling opportunities
Control of Assets & Development
100% owner & operator of land, wells & facilities
Adjustable pace of development
Maximize Oil Recovery
Develop pools with horizontal wells drilled off pads to minimize surface impact
No hydraulic fracturing required due to high reservoir porosity and permeability
Use proven, highly effective waterflood enhanced oil recovery methods to maximize ultimate oil
recovery per well and minimize capital invested
Drive Capital Efficiency
Continue to lower development and operating costs as we increase the size of drilling programs
and improve well performance with increasing reservoir pressure
2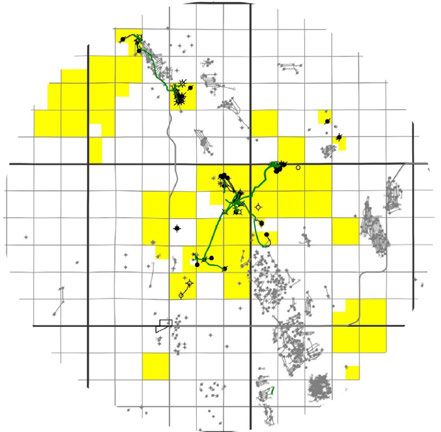
The Hemisphere Snapshot
TSX Venture                                                                                                                                           HME
Share Price                                                                                                                                          $0.20
April 6, 2017

52 Week Range                                                                                                                              $0.18 - $0.36
Basic Shares Outstanding                                                                                                                           89.8 MM
FD Shares Outstanding                                                                                                                          111.8 MM
      Insider Ownership                                                                                                                              ~13%
Enterprise Value                                                                                                                               $36.6 MM
Dec. 31, 2017 Net Debt Est.                                                                                                                    $18.6 MM
Term Loan Facility*                                                                                                                         US$35.0 MM
5 years; Matures September 15, 2022

Current Production**                                                                                                                        ~950 boe/d
Field-estimated; Nov 25 – Dec 9, 2017                                                                                                                  94% oil

2017 Production                                                                                                                                659 boe/d
                                                                                                                                                       95% oil

Proved + Probable Reserves***                                                                                                                 7.2 MMboe
      NPV10 (before tax)***                                                                                                                   $116.7 MM
Liability Management Rating                                                                                                                           5.60
as at April 7, 2018

* The lender under Hemisphere’s Term Loan Facility has commitment of up to US$20.0 million.
** As disclosed in Hemisphere’s news release dated Dec 13, 2017.
*** Reserve volumes and net present values are as attributed by McDaniel & Associates Consultants Ltd. ("McDaniel") in the reserve report of McDaniel dated March 9, 2018 and effective as of
December 31, 2017("McDaniel Reserve Report"). See Advisory Statements – Oil and Gas Information – Net Present Values.

                                                                                                                                                                                                3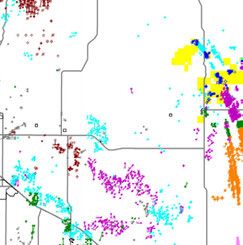
The Long-Term Value Growth
                       Reserves*                                                                                                               NPV10 BT**
        8.0                                                                                                $140.0                                                                                    $1.50
                 57% GROWTH                                                                                                                                                                 $1.30
        7.0        THROUGH                                                                                 $120.0
                                                                                                                                                                                                     $1.25
                 WATERFLOOD
        6.0                                                                2.3
                 RECOGNITION                                                                               $100.0                 $1.02                                                       2P
                                                                                                                                                                                             $36.3   $1.00
        5.0
                                                                                                             $80.0                                                               $0.77

                                                                                                                                                                                                         Per share (basic)
MMboe

        4.0                                                                                                                                                                                          $0.75
                                                                                                                                                          $0.64

                                                                                                    $MM
                                                  1.4
                          1.1                                                                                $60.0                                                                 2P
        3.0                                                                                                                         2P                                            $20.2
                1.1                                                                                                                $22.2                                                             $0.50
                                                                           4.9                                                                             2P                                1P
                                                                                                             $40.0                                        $14.1
        2.0                                                                                                                                                                                 $80.4

                          2.8                     3.1                                                                                                                             1P
                                                                                                                                   1P                                                                $0.25
                2.2                                                                                          $20.0                                         1P                    $45.7
        1.0                                                                                                                       $40.3
                                                                                                                                                          $34.3

        0.0                                                                                                     $0.0                                                                                 $0.00
              Dec 31    Dec 31               Dec 31                   Dec 31                                                    Dec 31                  Dec 31                 Dec 31       Dec 31
               2014      2015                 2016                     2017                        Proved                        2014                    2015                   2016         2017
                                                                                                   Probable

                         * Reserve volumes and net present values are attributed in each of the independent reserve reports prepared for Hemisphere effective as of the date noted above.

                                                                                                                                                                                                        4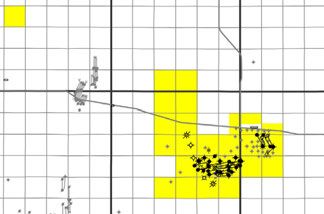
The Southern Alberta Focus

    Journey

                                                                                                SASKATCHEWAN
     Energy                              HEMISPHERE

                                                                                 ALBERTA
                                           ENERGY

                         CNRL

                            Cor4 Oil
                                                 Lundin Group
Torxen                                               IPC

                                                                                                   SASKATCHEWAN
Energy

                                                                                      ALBERTA
              Cardinal
               Energy
                                       Harvest
                                                                            Calgary

                                                                HME Land
                                                                HME Wells

                                                                                                                  5
The Foundation Assets
SOUTHERN ALBERTA
100% Working Interest
~35,000 undeveloped net acres
Mannville & Pekisko oil
900 - 1,000 m deep
Conventional horizontal wells
JENNER No fracs required
ATLEE
BUFFALO
HME Land
Suffield Military Base
6Jenner: The Stable Cash Flow
o 100% average working interest
o 100% operator of production
o ~24,000 net acres of land
o 8 oil pools defined by 3D seismic
o 30 drilling locations identified*
S
o 9 booked locations*
o Operated oil processing and
water disposal facilities
B
o Expansion capability for growth
in production
S
HME Land
B Battery
S Satellite
Pipeline
3D Seismic
* See Advisory Statements – Oil and Gas Information – Drilling Locations.
7Atlee Buffalo: The Growth Opportunity
G POOL
o Upper Mannville F Pool
o 28 MMbbl OOIP*
o Only 5% current oil recovery factor
o Upper Mannville G Pool
o 38 MMbbl OOIP*
o Only 3% current oil recovery factor
F POOL
o Working Interest – 100% in both
pools
o Excellent Geological Control – Oil
pools delineated by over 50 vertical wells
o 3D Seismic – Coverage over both pools Hz producer
Hz water injector
o Waterflood – Expanding in both pools Vertical injector
o Oil Recovery Factors** – Analogue
pools have reached up to 40% with
water and chemical floods. HME’s
Dec.31/17 Reserve Report reflects total
2P booked reserves of just 12% of the
estimated oil in place
* Based on McDaniel’s reservoir mapping for the purposes of the McDaniel Reserve Report. See Advisory
Statements – Oil and Gas Information – OOIP.
** See Advisory Statements – Oil and Gas Information – Analogous Information.
8Atlee Buffalo: The Development Plan
2017 Accomplishments G POOL
Drilled 4 producers and 2 injectors
Expanded F pool facility to enhance water
separation and increase oil production
Constructed and initiated a new water
separation and re-injection facility at G pool
Acquired 7,433 acres of new land F POOL
2018 Plans
Q1 2018: Drilled 1 producer and 2
injectors in Upper Mannville G Pool
o Prepare follow-up program with intentions
to fully develop the pools through 2018-19 Hz producer
o Continue to expand field-wide reservoir Hz water injector
Q1 2018 producer
simulation study as more production and
Q1 2018 injector
pressure data is incorporated from new wells Future Hz wells****
Vertical injector
WELL ECONOMICS – Reservoir Simulation Model***
Capital Drill, Estimated
Complete, Ultimate Initial Capital
Atlee Buffalo Equip & Tie-in Recovery* Production* Payout** NPV10** ROR** Efficiency**
Area $MM Mbbl bbl/d Years $MM % $/bbl/d
F Pool 0.9 305 115 0.8 3.5 200 8,000
G Pool 0.85 320 130 0.7 6.3 320 6,500
* See Advisory Statements – Oil and Gas Information – Initial Production Rates.
** Assumptions: McDaniel Q1 2018 Commodity Price Deck; $3 quality differential from WCS; Average ~$15.40/boe and $14.50/boe operating and transportation expenses, and ~$10.80/boe and ~$8.80/boe royalties for F pool and G pool, respectively.
*** Reservoir Simulation Models for both Atlee Buffalo F and G Pools have been internally generated as of January 31, 2018 by a qualified reserves evaluator in accordance with National Instrument 51-101 assuming the development shown on this slide
and represents the economics of an average producing well.
**** See Advisory Statements – Oil and Gas Information – Drilling Locations.
9Atlee Buffalo: The Waterflood Analogues
Oil Recovery Current Producing
Mannville Pools OOIP* API Waterflood
to-date Rate Wells
Name MMbbl Degree MMbbl RF Type Start Date Boe/d #
Analogue - Upper Mann YYY 15.8* 13o 3.7 23% Water-ASP 1998 445 (Nov ‘17) 11
Analogue - Upper Mann N2N 28.3* 12o 4.1 14% Water 1999 830 (Nov ‘17) 28
Analogue - Upper Mann UU 3.3* 14o 1.3 39% Water-ASP 1998 140 (Nov ‘17) 3
Hemisphere - Upper Mann F 28** 13o 1.3 5% Water Q315 500 (Mar’18 est) 9
Hemisphere - Upper Mann G 38** 14o 1.3 3% Water Q415 205 (Mar’18 est) 2
Alberta UPPER MANN G
UPPER MANN F
UPPER MANN YYY
Calgary
UPPER MANN N2N
HME Land
UPPER MANN UU
* Based on Alberta Energy ‘s reservoir mapping as of February 10, 2017.
** Based on McDaniel’s mapping for the purposes of the McDaniel Reserve Report. See Advisory Statements – Oil and Gas Information – OOIP.
10Atlee Buffalo: The Reserve Upside Potential
2P Booked Potential Additional
Cumulative Reserves as at (Unbooked) Reserves
Pool OOIP* Production to-date December 31, 2017 At Various RF***
(MMBbl) (MMBbl) (MMBbl) (MMBbl)
20% 30% 40%
Upper Mann F 28 1.3 (5% Recovery Factor) 2.9 (15% Recovery Factor)** 1.4 4.2 7.0
Upper Mann G 38 1.3 (3% Recovery Factor) 2.7 (11% Recovery Factor)** 3.6 7.4 11.2
Atlee Buffalo Total 66 2.6 (4% Recovery Factor) 5.5 (12% Recovery Factor)** 5.1 11.7 18.3
Upper Mann F Upper Mann G
Produced
1.3 MMbbl
At a Produced
1.3 MMbbl
Potential
Additional
Booked
2.9 MMbbl
30% Potential
Additional
Booked
2.7 MMbbl
4.2 MMbbl
Recovery Factor 7.4 MMbbl
* Based on McDaniel’s reservoir mapping for the purposes of the McDaniel Reserve Report. See Advisory Statements – Oil and Gas Information – OOIP.
** Represents the booked recovery factor attributed by McDaniel in the McDaniel Reserve Report.
*** The recovery factors (and reserve volumes) as noted are potential recovery factors (and reserve volumes) only and are based on management's estimates (as prepared by a qualified reserves evaluator in accordance with National Instrument
51-101) and assume the successful response to Hemisphere's proposed waterflood operations based on the results of analogous pools under waterflood (See Advisory Statements – Oil and Gas Information – Analogous Information). There is
no guarantee that the potential recovery factors will be realized by Hemisphere or that the reserve volumes noted will be attributed by an independent qualified reserves evaluator to Hemisphere.
11The Hemisphere Investment
Assets for Growth
High rate of return projects with production and reserve growth through strategic low-
risk, low capital expenditure and fast payout projects
Multi-year, low-risk drilling inventory in Atlee Buffalo and Jenner oil pools
Stable, long-life, inclining production through waterflood
Access to Capital
Well funded by strategic energy partner to execute growth of HME’s oil assets
Term Loan Facility of up to US$35.0 MM allows HME to organically develop its oil
assets over the next 2-3 years
Team to Deliver
Competent and experienced management team that has led HME through several
years of marginal commodity prices during the downturn and has positioned the
company for growth
Time to Execute
Oil market has strengthened and development costs remain low
12The Driven Leadership
Management
Don Simmons, P.Geol.
President & Chief Executive Officer
Over 17 years of experience technical, operational and management
experience (AEC, Encana, Sebring) Board of Directors
Ian Duncan, P.Eng. Charlie O’Sullivan, B.Sc. Chairman
Chief Operating Officer
Over 15 years of experience which includes drilling, completions, Don Simmons, P.Geol.
facilities, and operations (Talisman and Solaris MCI)
Frank Borowicz, QC, JP, CPA (Hon)
Dorlyn Evancic, CPA, CGA
Chief Financial Officer Bruce McIntyre, P.Geol.
Over 30 years of experience in corporate finance and management
(Guyana Frontier, Northern Continental and Gemco Minerals)
Gregg Vernon, P.Eng.
Andrew Arthur, P.Geol. Richard Wyman, B.Sc., MBA
Vice President, Exploration
Over 30 years of experience with several hundred wells drilled across
the Western Canadian Sedimentary Basin (Enerplus, Mission, Talisman)
Ashley Ramsden-Wood, P.Eng.
Vice President, Engineering
Over 15 years of experience in reservoir engineering, capital planning,
and reserves evaluation (NAL, Petro-Canada)
13Advisory Statements
Forward-looking Information and Statements
This corporate presentation contains certain forward-looking information and statements within the meaning of applicable securities laws. The use of any of the words "expect", "anticipate", "continue", "estimate", "may", "will",
"project", "should", "believe", "plans", "intends", "forecast", "goals" and similar expressions are intended to identify forward-looking information or statements. In particular, but without limiting the forgoing, this presentation
contains forward-looking information and statements pertaining to the following: the volumes and estimated value of Hemisphere's oil and gas reserves; resource estimates and volumes in respect of Hemisphere's Jenner and Atlee
Buffalo property areas; the anticipated economics of the oil wells at Atlee Buffalo and Jenner, including timing for anticipated payout and rates of return; Hemisphere's proposed development plans for its properties at Atlee Buffalo
and Jenner; the potential for increased recovery factors in and reserve additions from the oil pools in which Hemisphere holds an interest; potential future production rates, cash flows; future oil and natural gas prices; future results
from operations; future costs, expenses and royalty rates; the exchange rate between the $US and $Cdn; cash flow estimates based on full-scale development plans; the amount and timing of capital projects; corporate costs; the
total future capital associated with development of reserves and resources; the anticipated response of Hemisphere's oil assets at the Atlee Buffalo property area to waterflood stimulation operations (including the potential for
increased recovery factors and reserve volumes resulting there from); estimated ultimate recoveries of producing wells; initial production rates and the estimated payout from wells to be drilled by Hemisphere, NPV10 values, rates of
return and capital efficiencies of Hemisphere’s Jenner and Atlee Buffalo wells.
The recovery, reserve, and resource estimates of Hemisphere's reserves and resources provided herein are estimates only and there is no guarantee that the estimated reserves or resources will be recovered. In addition, forward-
looking statements or information are based on a number of material factors, expectations or assumptions of Hemisphere which have been used to develop such statements and information but which may prove to be incorrect.
Although Hemisphere believes that the expectations reflected in such forward-looking statements or information are reasonable, undue reliance should not be placed on forward-looking statements because Hemisphere can give no
assurance that such expectations will prove to be correct. In addition to other factors and assumptions which may be identified herein, assumptions have been made regarding, among other things: the impact of increasing
competition; the general stability of the economic and political environment in which Hemisphere operates; the timely receipt of any required regulatory approvals; the ability of Hemisphere to obtain qualified staff, equipment and
services in a timely and cost efficient manner; drilling results; the ability of the operator of the projects in which Hemisphere has an interest in to operate the field in a safe, efficient and effective manner; the ability of Hemisphere to
obtain financing on acceptable terms; field production rates and decline rates; the ability to replace and expand oil and natural gas reserves through acquisition, development and exploration; risks associated with the degree of
certainty in resource assessments; the timing and cost of pipeline, storage and facility construction and expansion and the ability of Hemisphere to secure adequate product transportation; future commodity prices; currency,
exchange and interest rates; regulatory framework regarding royalties, taxes and environmental matters in the jurisdictions in which Hemisphere operates; and the ability of Hemisphere to successfully market its oil and natural gas
products. There are a number of assumptions associated with the potential of resource volumes estimated herein, including the quality of the reservoir, future drilling programs and the funding thereof, continued performance from
existing wells and performance of new wells, well density per section and recovery factors and discovery and development of the lands evaluated in Hemisphere's property areas of operation, which necessarily involves known and
unknown risks and uncertainties, including those identified in this presentation and including the risks set forth in Hemisphere's most recent annual information form available for review on SEDAR at www.sedar.com.
The forward-looking information and statements included in this presentation are not guarantees of future performance and should not be unduly relied upon. The forward-looking information and statements contained in this
presentation speak only as of the date of this presentation, and Hemisphere does not assume any obligation to publicly update or revise any of the included forward-looking statements or information, whether as a result of new
information, future events or otherwise, except as may be required by applicable securities laws.
Oil and Gas Information
Net Present Values
It should not be assumed that the estimates of future net revenues presented or disclosed in this presentation represent the fair market value of the reserves. There is no assurance that the forecast prices and costs assumptions
made in estimating such future net revenues will be attained and variances could be material.
BOE
Disclosure provided herein in respect of Boe's may be misleading, particularly if used in isolation. A Boe conversion ratio of 6 Mcf:1 Bbl is based on an energy equivalency conversion method primarily applicable at the burner tip and
does not represent a value equivalency at the wellhead. Given that the value ratio based on the current price of crude oil as compared to natural gas is significantly different from the energy equivalency of 6:1, utilizing a conversion
on a 6:1 basis may be misleading as an indication of value.
OOIP
Original Oil-In-Place ("OOIP") is used by Hemisphere in this presentation as an equivalent to Discovered Petroleum Initially‐In‐Place ("DPIIP"). DPIIP, as defined in the Canadian Oil and Gas Evaluation Handbook, is that quantity of
petroleum that is estimated, as of a given date, to be contained in known accumulations prior to production. The recoverable portion of DPIIP includes production, reserves and contingent resources; the remaining portion of DPIIP is
unrecoverable. It should not be assumed that any portion of the OOIP/DPIIP set forth in this presentation is recoverable other than the portion which has been attributed reserves by McDaniel. There is uncertainty that it will be
commercially viable to produce any portion of the OOIP/DPIIP other than the portion that is attributed reserves. The OOIP/DPIIP set forth in this presentation has been provided for the sole purpose of highlighting the recovery
factors for the reservoirs that have been attributed reserves. The OOIP/DPIIP volumes for Hemisphere's Atlee Buffalo property disclosed in this presentation are from the mapping of the reservoirs by McDaniel (who is independent of
Hemisphere) in connection with preparing the McDaniel Reserve Report. All OOIP/DPIIP estimates set forth herein are provided as of December 31, 2016.
14Advisory Statements
Drilling Locations
This presentation discloses drilling locations in two categories: (i) booked locations; and (iii) unbooked locations. Proved locations and probable locations, which are sometimes collectively referred to as "booked locations", are
derived from the McDaniel Reserve Report and account for drilling locations that have associated proved or probable reserves, as applicable. Unbooked locations, are internal estimates based on the Company's prospective acreage
and an assumption as to the number of wells that can be drilled per section based on industry practice and internal review. Unbooked locations do not have attributed reserves or resources. Of the 30 locations identified at Jenner
in this presentation, 8 are proved locations, 1 is a probable location and 21 are unbooked locations. Of the 46 drilling locations (producers) shown on the map at Atlee Buffalo, 10 are proved locations, 2 are probable locations,
and 34 are unbooked locations.
Unbooked locations have specifically been identified by management as an estimation of Hemisphere's anticipated drilling activities based on evaluation of applicable geologic, seismic, and engineering, production and reserves
data on prospective acreage and geologic formations. The drilling locations on which Hemisphere will actually drill wells ultimately depends upon the availability of capital, regulatory approvals, seasonal restrictions, oil and natural
gas prices, costs, actual drilling results and other factors. While certain of the unbooked drilling locations have been derisked by drilling existing wells in relative close proximity to such unbooked drilling locations, certain unbooked
drilling locations are farther away from existing wells where management has less information about the characteristics of the reservoir and therefore there is more uncertainty whether wells will be drilled in such locations and if
drilled there is more uncertainty that such wells will result in additional oil and gas reserves, resources or production.
Analogous Information
The information concerning Upper Mannville N2N and YYY analogue pools may be considered to be "analogous information" within the meaning of applicable securities laws. Such information was obtained by Hemisphere
management throughout the year ended December 31, 2016 from various public sources including information available to Hemisphere through AccuMap (a mapping, data management and analysis software for companies
operating in the Western Canadian Sedimentary Basin). Management believes such information is analogous to the Upper Mannville F and G pools in which Hemisphere has an interest and is relevant as it may help to
demonstrate the reaction of such pools (in which Hemisphere has an interest) to waterflood stimulations. Hemisphere is unable to confirm whether the analogous information was prepared by a qualified reserves evaluator or
auditor or in accordance with the COGE Handbook and whether such evaluator or auditor was independent and therefore, the reader is cautioned that the data relied upon by Hemisphere may be in error and/or may not be
analogous to the oil pools in which Hemisphere holds an interest.
Initial Production Rates
Initial production rates disclosed herein are not determinative of the rates at which the wells will continue to produce and decline thereafter and may not necessarily be indicative of long-term performance or estimated ultimate
recovery. Such rates should be considered preliminary.
Non-IFRS Measures
This presentation contains terms commonly used in the oil and gas industry which are not defined by or calculated in accordance with International Financial Reporting Standards ("IFRS"), such as: (i) funds flow from operations
(including on a per share basis); (ii) operating field netback (including on a per boe basis); (iii) operating netback (including on a per boe basis); and (iv) net debt.
The Company considers funds flow from operations to be a key measure that indicates the Company’s ability to generate the funds necessary to support future growth through capital investment and to repay any debt. Funds flow
from operations is a measure that represents cash generated by operating activities, before changes in non-cash working capital and may not be comparable to measures used by other companies. Funds flow from operations per
share is calculated using the same weighted-average number of shares outstanding as in the case of the earnings per share calculation for the period.
Operating field netback is a benchmark used in the oil and natural gas industry and a key indicator of profitability relative to current commodity prices. Operating field netback is calculated as oil and gas sales, less royalties,
operating expenses and transportation costs on an absolute and per boe basis. These terms should not be considered an alternative to, or more meaningful than, cash flow from operating activities or net income or loss as
determined in accordance with IFRS as an indicator of the Company’s performance. Operating netback is a non-IFRS measure calculated as the operating field netback plus the Company’s realized commodity hedging gain (loss)
per barrel of oil equivalent.
Net debt (working capital) is closely monitored by the Company to ensure that its capital structure is maintained by a strong balance sheet to fund the future growth of the Company. Net debt is used in this document in the
context of liquidity and is calculated as the total of the Company’s bank debt and current liabilities, less current assets. There is no IFRS measure that is reasonably comparable to net debt.
Hemisphere has provided information on how these measures are calculated in its Management's Discussion and Analysis, which is available under Hemisphere's SEDAR profile at www.sedar.com.
15Don Simmons, President & CEO Telephone: 604.685.9255 Email: simmons@hemisphereenergy.ca Scott Koyich, Investor Relations Telephone: 403.619.2200 Email: scott@briscocapital.com
You can also read