Official Statistics 18 March 2021 - GOV.UK
←
→
Page content transcription
If your browser does not render page correctly, please read the page content below
OFFICIAL STATISTICS

    Official Statistics
    18 March 2021
    Introduction
This statistical release provides summary information on appeals, which represent the
highest volume (in terms of number of cases) of the work of the Planning Inspectorate.

This release also provides a general overview of the impact of the Covid pandemic on the
work of the Planning Inspectorate to enable everyone to see the effect of the restrictions on
performance.

These statistics are produced each month and the focus is on timeliness, as that is an area
in which stakeholders have an interest. Information on the decisions that we have made is
also included; and on the number of Inspectors available to make those decisions.

These statistics have been published to ensure everyone has equal access to the
information and to support the Planning Inspectorate’s commitment to release information
where possible.

This statistical bulletin provides1:
    • An overview of the impact of Covid on the work of the Inspectorate
    • Appeals decisions from March 2020 to February 2021
    • The time taken to reach those decisions
    • Number of open cases
    • Number of Inspectors
    • Number of virtual events.
The data in this release is only applicable to England.

The Planning Inspectorate
The Planning Inspectorate makes decision and provides recommendations and advice on a
range of land use planning-related issues across England and Wales. We do this in a fair,
open and timely way.

The Planning Inspectorate deals with planning appeals, national infrastructure planning
applications, examinations of local plans and other planning-related and specialist casework
in England and Wales.

The Planning Inspectorate is an executive agency, sponsored by the Ministry of Housing,
Communities & Local Government and the Welsh Government.

1
    See Annex A for breakdown of what has been included in recent releases.
                                                      1
    Issued By: Head of Data and Performance | The Planning Inspectorate | Temple Quay House | Eagle Wing |
    Telephone: 0303 444 5104 | Email: Statistics@planninginspectorate.gov.uk
    Media enquiries | Telephone: 0303 444 5004 | Email: press.office@planninginspectorate.gov.uk
Summary
The impact of COVID can be seen in The Planning Inspectorate data in three ways:
1. The Inspectorate suspended all events during the Spring 2020 lockdown, but have
since resumed activities, including holding events virtually and, where possible,
carrying out site visits during the latest lockdown. The number of events held peaked
in September 20 at over 2,000 but have been gradually reducing since. This is likely
to be the impact of tiered restrictions and lockdowns, in November 20 and January
21 onwards.
2. Following the Spring 2020 lockdown the timeliness measure increased, peaking at a
median timeliness of almost 27 weeks in November 20, compared to pre pandemic
levels of just over 21 weeks. In the last three months (Dec 20 – Feb 21) there has
been a reduction in median timeliness.
3. The number of open cases (cases received but not yet closed) increased to a high of
around 11,000 in August 20. It was decreasing, as the Inspectorate closed more
cases than were received on a monthly basis; but this trend has in the last three
months started increasing (more being received than closed), with open cases now
at almost 10,500.
Decisions
The Planning Inspectorate has made 16,956 appeal decisions2 in the last 12 months, an
average of just over 1,400 per month. The 1,451 decisions for February 21 are marginally
higher than January 21. However, February 21 had 22% fewer decisions than the same
month in 2020.
Written representations decisions represent the highest volume and had recovered to pre-
pandemic levels between September and December 20, but both January and February 21
were lower. Hearing decisions fell in February 21, and Inquiry decisions have been broadly
similar since November 20. Both planning and enforcement decisions were lower in
February 21 compared to recent previous months; Specialist casework had its highest
number of decisions since Apr 20.
Performance
The mean average time to make a decision, across all cases in the last 12 months (Mar 20
to Feb 21), was 27 weeks. The median time is 23 weeks.
The median timeliness for February 21, at 21 weeks, was back to the level last seen in Apr
20. In the period between Apr 20 and Jan 21 performance was consistently above 22 weeks.
Hearings and inquires take longer than written representations – with inquiries taking more
than twice as long as written representations.
The median time for written representations over the 12 months to February 21 is 22 weeks.
The median time for inquiries over the 12 months to January 21 is just over a year - 53
weeks. The median time for hearings is slightly less at 45 weeks.
The median time to decision for planning cases was lower than for other casework
categories, apart from in May 2020. Across the whole year, the median time to decision for
planning cases is 21 weeks. Enforcement decisions made in the last 12 months had a
median decision time of 34 weeks. The median time to decision for specialist decisions is
2
The appeal types are the same as last month. They include planning & related appeals, Enforcement and
Specialist casework (covering a range of casework types). Please note that some previous releases covered
only Rights of Way orders within Specialist casework. Annex A details the scope of previous releases, Annex
D the scope of this release and Background Notes has further information.broadly the same as for enforcement decisions, and longer than the median for planning decisions. The median time for inquiries under the Rosewell Process over the 12 months to February 21 is 32 weeks. The eight decisions in February 21 was a drop from the previous two months; Dec 20 and Jan 21 were comparable to pre-pandemic levels. Open Cases At the end of January 21, the Planning Inspectorate had ten thousand five hundred cases open. This is a small increase of 147 compared to the previous month. Planning Inspectors There were 345 Planning Inspectors employed by the Inspectorate in January 2021 – with a full-time equivalent of 308.1. Virtual Events The Inspectorate are continuing to carry out events ‘virtually’. There were 91 cases involving Virtual Events during February, with 86 estimated for March 2021. Please note that in the last release the period December 20 to February 21 indicated that no Local Plan events had been held virtually – this has been corrected to show 12, 5 and 7 plans having been held virtually in those respective months.
Impact of Covid

The impact of COVID can be seen in the Planning Inspectorate data in three ways:
    1. The Inspectorate suspended all events during the Spring 2020 lockdown, but have
       since resumed activities, including holding events virtually and, where possible,
       carrying out site visits during the latest lockdown. The number of events held peaked
       in September 20 at over 2,000 but have been gradually reducing since. This is likely
       to be the impact of tiered restrictions and lockdowns, in November 20 and January
       21 onwards.
    2. Following the Spring 2020 lockdown the timeliness measure increased, peaking at a
       median timeliness of almost 27 weeks in November 20, compared to pre pandemic
       levels of just over 21 weeks. In the last three months (Dec 20 – Feb 21) there has
       been a reduction in median timeliness.
    3. The number of open cases (cases received but not yet closed) increased to a high of
       around 11,000 in August 20. It was decreasing, as the Inspectorate closed more
       cases than are received on a monthly basis; but this trend has in the last three months
       started increasing (more being received than closed), with open cases now at almost
       10,500.

Figure 1: Number of events held, decisions issued and median time between valid date &
decision date; Mar 20 to Feb 21

Source: Horizon, Picaso, Inspector Scheduling System
Note – Red arrows indicate periods when national lockdowns were in effect
Table 1: Number of events3 held, decisions issued and median time between valid date & decision date; Mar 20 to Feb 21 Month Mar 20 Apr 20 May 20 Jun 20 Jul 20 Aug 20 Sep 20 Oct 20 Nov 20 Dec 20 Jan 21 Feb 21 Total Events Held 939 59 751 1,528 1,556 1,472 2,104 1,933r 1,699r 1,444r 1,394r 1,446 16,325 Decisions 1,670 988 597 1,180 1,432 1,254 1,571 1,972 1,729 1,699 1,413r 1,451 16,956 Median 20.0 22.4 24.9 22.1 23.3 23.3 24.0 25.6 26.9 23.9 22.0 20.9 22.9 Source: Horizon, Picaso, Inspector Scheduling System. r denotes revision – a change of more than 5 cases since last month (see Background Quality Report for more information) During the first lockdown The Planning Inspectorate were able to continue deciding cases where the site visit, hearing or inquiry had already occurred. The impact of pandemic meant that the Inspectorate did not carry out site visits, hearings and inquiries events during the lockdown period in Spring 2020. In contrast, site visits and virtual events were able to continue during the later lockdowns. The Inspectorate needed to adapt to new ways of working and re-arrange those events that were cancelled during the Spring lockdown period and this also impacted on customers who appealed before (from as early as Dec 19), during and after the Spring 2020 lockdown. Figure 2: Number of cases received, closed and open; Mar 20 to Feb 21 Source: Horizon and Picaso Note – Red arrows indicate periods when national lockdowns were in effect The number of open cases has increased slowly over the last two months, from 10,261 at the end of December 20 to 10,487 at the end of February 21. This contrasts with the period September to December 20, where once schools re-opened and full Inspectorate capacity had returned, the number of cases being closed noticeably exceeded the number received. 3 Although the Inspectorate suspended all site visits, hearings and inquiries, Table 1 indicates that 59 events occurred during April 2020. Analysis of this data shows that 38 cases have incorrect data recorded for the date of the event. A further 21 cases have an event date recorded for April 2020, as operational systems require, but involved cases where no physical event was required, as these cases were decided based on documentation only. See the Background Quality Report for further information.
Table 2: Number of cases received, closed and open; Mar 20 to Feb 21
Month Mar 20 Apr 20 May 20 Jun 20 Jul 20 Aug 20 Sep 20 Oct 20 Nov 20 Dec 20 Jan 21 Feb 21 Total
Received 1,856 1,548 1,501 1,613 1,672 1,487 1,628 1,803 1,692 1,815r 1,617r 1,712 19,944
Closed 1,851 1,125 736 1,337 1,607 1,374 1,714 2,154r 1,892 1,872 1,585r 1,648 18,895
Open 9,513 9,933 10,665 10,987 11,023 11,050 10,951 10,541 10,350 10,261 10,342 10,487 N/A
Source: Horizon and Picaso. r denotes revision – a change of more than 5 cases since last month (see Background
Quality Report for more information)
The number of cases closed is considerably higher than the number of decisions, as it
includes cases where an appeal is withdrawn, notice is withdrawn, or the appeal is turned
away.
Number of Decisions
The Planning Inspectorate has made 16,956 appeal decisions4 in the last 12 months, an
average of just over 1,400 per month. Table 3 below shows the monthly breakdown with
fewer decisions from April to August 2020, and for the months of January and February
2021, than would have been expected, due to the impact of COVID-19. The same
information is represented in Figure 3.
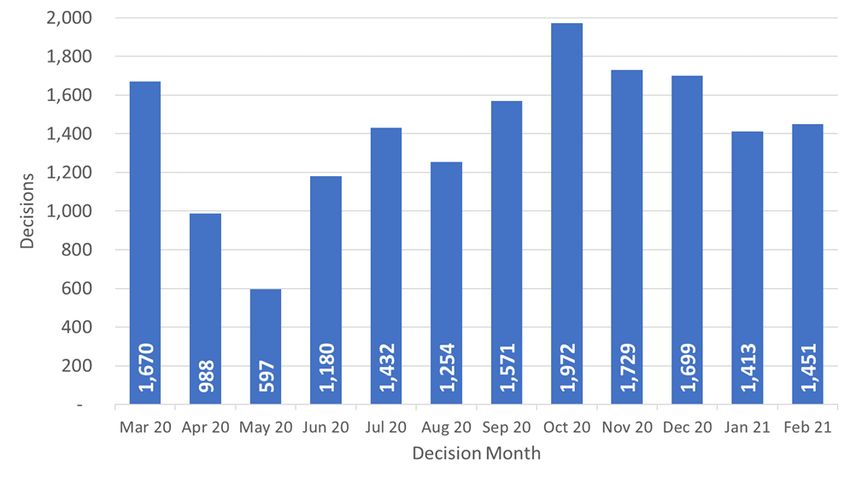
Table 3: Appeal Decisions; Mar 20 to Feb 21
Month Mar 20 Apr 20 May 20 Jun 20 Jul 20 Aug 20 Sep 20 Oct 20 Nov 20 Dec 20 Jan 21 Feb 21 Total
Decisions 1,670 988 597 1,180 1,432 1,254 1,571 1,972 1,729 1,699 1,413r 1,451 16,956
Source: Horizon and Picaso. r denotes revision – a change of more than 5 cases since last month (see Background
Quality Report for more information)
Figure 3 – Appeal Decisions; Mar 20 to Feb 21
Source: Horizon and Picaso
As can be seen from the table, the fewest decisions were made in May 2020 – just under
six hundred decisions. Since then the number of decisions each month showed an upward
trend to October 20 (with a slight dip in August linked to annual leave). However, since
4
The appeal types are the same as last month. They include planning & related appeals, Enforcement and
Specialist casework (covering a range of casework types). Please note that some previous releases covered
only Rights of Way orders within Specialist casework. Annex A details the scope of previous releases, Annex
D the scope of this release and Background Notes has further information.October decisions decreased. The 1,451 decisions for February 21 are marginally higher
than January 21. However, February 21 had 22% fewer decisions than the same month in
2020.
Decisions by procedure and case type
Planning Inspectors work on a broader range of work than the appeals featured in this
Release. For example, they also work on examining Nationally Significant Infrastructure
Project applications, Local Plans, Compulsory Purchase Order applications and many other
specialist licencing/application types.
Table 4 below gives the numbers of appeal decisions made broken down by whether the
case was dealt with by written representations, hearings, or inquiries.
The large majority of decisions (16,337) were made on written representations. This is about
ninety five percent of all appeal decisions made. There were 429 decisions made on
hearings; and 190 on inquiries. These totals are shown in Figure 4 below.
The large majority of cases were planning (13,992). This is about eighty-two per cent of all
appeal decisions made. There were 2,361 enforcement decisions and 603 specialist
decisions. These totals are also shown in Figure 4 below.
Table 4: Appeal Decisions by procedure and casework category; Mar 20 to Feb 21
Month Mar 20 Apr 20 May 20 Jun 20 Jul 20 Aug 20 Sep 20 Oct 20 Nov 20 Dec 20 Jan 21 Feb 21 Total
Written
1,565 931 575 1,157 1,411 1,230 1,543 1,919 1,674 1,613 1,331r 1,388 16,337
Representations
Hearings 71 40 17 13 16 14 21 40 35 60 58 44 429
Inquiries 34 17 5 10 5 10 7 13 20 26 24 19 190
Total 1,670 988 597 1,180 1,432 1,254 1,571 1,972 1,729 1,699 1,413r 1,451 16,956
Month Mar 20 Apr 20 May 20 Jun 20 Jul 20 Aug 20 Sep 20 Oct 20 Nov 20 Dec 20 Jan 21 Feb 21 Total
Planning 1,342 751 439 970 1,149 991 1,323 1,639 1,488 1,463 1,187r 1,250 13,992
Enforcement 272 144 146 178 239 227 215 281 195 187 165 112 2,361
Specialist 56 93 12 32 44 36 33 52 46 49 61 89 603
Total 1,670 988 597 1,180 1,432 1,254 1,571 1,972 1,729 1,699 1,413r 1,451 16,956
Source: Horizon and Picaso. r denotes revision – a change of more than 5 cases since last month (see Background
Quality Report for more information)
Table 4 shows that written representations decisions had recovered to pre-pandemic levels
between September and December 20, but both January and February 21 are lower.
Decisions for hearings in December 20 and January 21 increased to levels approaching pre-
pandemic but fell lower in February 21. Inquiry decisions have been around 20, or more,
for the last four months.
Trends for planning decisions show similar patterns to written representations. The number
of enforcement decisions has been decreasing month on month since Oct 20. Specialist
casework figures remain volatile; 89 decisions in February 21 being the highest monthly total
since Apr 20.Figure 4 – Appeal Decisions by Procedure and Casework Category; Mar 20 to Feb 21
Source: Horizon and Picaso
Decision timeliness
It is important for people to know how long an appeal is going to take, so that they can make
plans and decisions based on this information. This section covers the timeliness of
decisions (i.e. how long it takes to make a decision) across our appeal casework. In addition
to an overall measure, timeliness is analysed by procedure type and casework category, as
timeliness varies a great deal depending on these characteristics.
Table 5 below shows that the mean average time to make a decision5, across all cases in
the last 12 months (Mar 20 to Feb 21), was 27 weeks.6 The table also shows the median
time is 23 weeks. Each month the median is less than the mean; this is due to the larger
impact on the mean of very long cases.
Also included in the table is the standard deviation of decision timeliness. A lower standard
deviation would demonstrate greater consistency in the Planning Inspectorate’s decision
timeliness. The data shows that the variability was getting less towards the end of 2020 –
the standard deviation values are 15.6 or lower for June to December. Data for January
and February 21 represent a slight increase, up to between 17 and 18 weeks.
What are mean, median, and standard deviation?
Measure Definition
Mean The total time taken divided by the number of cases. Also
referred to as the ‘average’. A measure of how long each
case would take, if the total time taken was spread evenly
across all cases.
Median This is the time taken by the ‘middle’ case if all cases were
sorted from quickest to longest
Standard This is a measure of variability or spread. It is calculated by
deviation examining how much each value differs from the mean. A
5
The time to make a decision is measured from the time we judge we have enough information for the case
to proceed (i.e. it is deemed ’valid’) to the time a decision letter is issued. We estimate that most cases are
‘validated’ (the difference between receipt date and the validation process being completed) in a week or
less.
6
The decisions made in a given month will include those that started many months before, and thus do not
give an accurate indication of how decisions submitted, or deemed ‘valid’ in that month, will take.higher standard deviation means the individual decision times
vary more widely around the mean.
Table 5: Mean, Median and Standard Deviation of Time to Decision; Mar 20 to Feb 21
Month Mar 20 Apr 20 May 20 Jun 20 Jul 20 Aug 20 Sep 20 Oct 20 Nov 20 Dec 20 Jan 21 Feb 21 Total
Valid to
Decision
24.2 28.1 29.1 26.1 26.0 25.9 26.1 28.4 28.6 27.8 27.7 26.7 26.8
(mean
weeks)
Valid to
Decision
20.0 22.4 24.9 22.1 23.3 23.3 24.0 25.6 26.9 23.9 22.0 20.9 22.9
(median
weeks)
Standard
Deviation 14.1 17.4 15.9 13.9 14.4 14.1 12.5 14.9 12.9 15.6 18.1 16.9 15.2
(weeks)
Source: Horizon and Picaso
The median timeliness increased in most months between Mar 20 to Nov 20, peaking at
almost 27 weeks. The last three months, Dec 20 to Feb 21, have seen a reduction in the
median time to decision.
Figure 5: Mean and Median time to decision; Mar 20 to Feb 21
Source: Horizon and Picaso
The mean time to decide, shows a different pattern. The mean has often been above 25
weeks, dropping below this only in Mar 20 (to 24.2 weeks). The decrease in the mean
between Oct 20 and Feb 21 is 1.9 weeks; the median measure has decreased by 4.7 weeks
in the same period.Procedure Type
Table 6 below shows decision timeliness broken down by the procedure type. Hearings and
inquires take longer than written representations – with Inquiries taking more than twice as
long as written representations. Because 19 of every 20 cases are by written representation,
the timeliness measures for written representations is similar to the measure across all
cases.
Where a small number of cases has been decided, the average timeliness (whether mean
or median) is less meaningful as a measure than where there are many cases. Those areas
shaded in the table below should be treated with caution as there are fewer than 20 cases
decided.
The median time for written representations over the 12 months to February 21 is 22 weeks.
The median time for inquiries over the 12 months to February 21 is just over a year - 53
weeks. The median time for hearings is slightly less at 45 weeks. For each of these
procedure types, the mean is higher as it is more affected by the longest cases.
Table 6: Mean and Median Time to Decision, with standard deviation, by procedure; Mar
20 to Feb 21
Mar Apr May Jun Jul Aug Sep Oct Nov Dec Jan Feb
Measure Procedure Total
20 20 20 20 20 20 20 20 20 20 21 21
Valid to Written
22.8 26.4 28.1 25.3 25.6 25.4 25.6 27.9 28.0 26.6 25.8 25.3 25.8
Decision Representations
(mean
Hearings 45.5 48.0 50.4 63.8 56.0 44.5 50.5 49.8 37.6 49.6 59.8 47.5 49.3
weeks)
Inquiries 48.5 73.4 77.4 71.4 42.3 55.1 63.2 43.8 58.5 52.8 57.0 76.3 58.0
All Cases 24.2 28.1 29.1 26.1 26.0 25.9 26.1 28.4 28.6 27.8 27.7 26.7 26.8
Valid to Written
19.4 22.1 24.1 22.0 23.1 23.0 23.9 25.1 26.6 23.1 21.3 20.4 22.4
Decision Representations
(median
Hearings 44.0 43.9 47.1 52.6 39.6 47.6 40.3 40.1 37.3 43.9 51.5 49.0 45.0
weeks)
Inquiries 43.9 96.9 88.1 67.7 24.0 44.4 65.0 37.3 55.0 40.1 52.0 68.1 52.7
All Cases 20.0 22.4 24.9 22.1 23.3 23.3 24.0 25.6 26.9 23.9 22.0 20.9 22.9
Standard Written
12.1 15.1 14.5 12.3 13.7 13.4 11.7 14.2 12.3 14.0 15.1 14.7 13.6
Deviation Representations
(weeks)
Hearings 19.2 19.8 20.3 30.7 31.8 11.4 20.4 25.5 15.0 20.0 29.1 20.9 23.8
Inquiries 24.3 32.8 18.5 13.2 24.0 34.0 18.5 17.4 14.0 31.0 29.8 36.9 28.6
All Cases 14.1 17.4 15.9 13.9 14.4 14.1 12.5 14.9 12.9 15.6 18.1 16.9 15.2
Source: Horizon and Picaso. Cells shaded grey had fewer than 20 decisions.
The standard deviation information indicates that for all three procedures, there is
considerable variation, meaning times are widely spread about the mean. For each type, the
amount of variation is fairly stable through the year.
Casework Category
The nature of the cases the Planning Inspectorate deal with varies widely and several factors
play a part in determining how long it takes to make a decision. One such factor is the
casework type. Table 7 below shows the time taken to decide, in planning cases, in
enforcement cases, and in specialist7 cases, as does Figure 6.
7
Specialist cases comprise Common Land, Rights of Way orders, Tree Preservation Orders, High Hedges
appeals and Hedgerow appealsThe median time to decision for planning cases (there are many more of these decisions
than in the other categories) is lower than for other casework categories, apart from in May
2020. Table 7 and Figure 6 show the median time for planning cases was above 20 weeks
from April 20 until Feb 21, when it dipped below 20 weeks. Across the whole year, the
median time to decision is 21 weeks.
Annex B gives information on mean and median time to decision, with standard deviation,
for these procedure types, split by planning, enforcement and specialist casework
categories.
Table 7: Decisions, Mean, Median and Standard Deviation of Time to Decision – Planning,
Enforcement, Specialist Cases; Mar 20 to Feb 21
Casework Mar Apr May Jun Jul Aug Sep Oct Nov Dec Jan Feb
Measure Total
Category 20 20 20 20 20 20 20 20 20 20 21 21
Planning Valid to Decision
21.6 25.2 27.1 23.5 22.9 23.0 23.7 25.6 27.0 25.4 24.5 23.2 24.1
Cases (mean wks)
Valid to Decision
18.6 20.9 23.7 21.3 22.1 21.9 22.6 24.1 25.6 22.7 20.7 19.8 21.4
(median wks)
St. dev. of
11.6 15.0 14.4 10.0 9.6 11.4 9.8 11.3 11.3 12.3 12.3 11.6 11.7
decision (weeks)
Enforcement Valid to Decision
34.1 39.6 34.9 37.5 38.0 36.8 37.5 42.8 37.7 42.1 43.7 42.8 38.9
Cases (mean wks)
Valid to Decision
29.3 35.2 29.4 29.0 33.0 33.3 33.6 38.4 34.6 36.9 37.6 34.9 33.6
(median wks)
St. dev. of
17.4 20.4 18.2 21.3 22.6 17.3 15.5 20.5 16.8 23.0 28.9 26.7 20.9
decision (weeks)
Specialist Valid to Decision
39.9 33.8 32.3 40.6 42.3 37.6 47.0 38.8 39.4 44.3 46.1 54.7 41.2
Cases (mean wks)
Valid to Decision
36.5 26.1 19.9 37.1 40.9 37.3 48.7 35.5 41.1r 44.0 52.9 54.0 38.0
(median wks)
St. dev. of
19.8 21.8 18.5 23.1 17.2 17.7 24.3 26.4 18.3 25.4 33.7 24.2 24.5
decision (weeks)
Source: Horizon and Picaso. Cells shaded grey had fewer than 20 decisions. r denotes revision – a change of more than
0.5 weeks since last month.
Figure 6 – Median time to decision by casework area; Mar 20 to Feb 21
Source: Horizon and Picaso
The 2,361 enforcement decisions made in the last 12 months had a median decision time
of 34 weeks. The median decision time increased between Jun 20 and Oct 20. For the last12 months the median is 34 weeks. The median time for enforcement decisions is longer
than the median decision time for planning cases.
There are considerably fewer specialist cases (603 for the year) which means results are
more liable to be distorted by extreme values. Looking at the annual totals, the median and
mean time to decision for specialist decisions are broadly the same as for enforcement
decisions, and longer than the median for planning decisions. The median time for decisions
in specialist cases since June 20 has been longer than for other case work areas. The mean
and median figures for February 21 were the longest for the last 12 months, but the number
decided was the second highest in the last 12 months; this could be due to working through
a backlog of older cases.
Note that the Inspectorate publishes each month, information on the mean and median times
from valid to decision, for selected appeal types. The information published also breaks
down the time for each stage of the process. See Annex C8 for further details.
Planning Inquiry Decisions
For planning appeals decided by the inquiry process, The Planning Inspectorate has been
implementing recommendations from the Rosewell review.
The median time for inquiries over the 12 months to February 21 is 32 weeks, with the mean
being higher at almost 36 weeks. The eight decisions in February 21 was a drop from the
previous two months; Dec 20 and Jan 21 were comparable to pre-pandemic levels.
Table 8: Decisions, Mean and Median Time to Decision, Planning Inquiry cases under
Rosewell process; Mar 20 to Feb 21
Measure Mar 20 Apr 20 May 20 Jun 20 Jul 20 Aug 20 Sep 20 Oct 20 Nov 20 Dec 20 Jan 21 Feb 21 Total
Decisions 16 4 1 - 3 5 2 7 7 18 13 8 84
Mean
30.4 35.2 47.0 - 22.7 42.5 41.1 45.7 45.7 35.3 36.5 40.7 35.7
(weeks)
Median
23.7 34.4 47.0 - 23.4 45.6 41.1 32.6 50.9 39.4 40.3 40.7 31.9
(weeks)
St. Dev.
12.7 7.7 - - 1.4 16.0 1.1 22.1 9.1 10.2 12.2 7.9 13.4
(weeks)
Source: Horizon
Most inquiry decisions now being issued are under the revised ‘Rosewell’ process, but we
are still deciding those under the previous process.
Table 9: Decisions, Planning Inquiry cases under non-Rosewell process; Mar 20 to Feb 21
Month Mar 20 Apr 20 May 20 Jun 20 Jul 20 Aug 20 Sep 20 Oct 20 Nov 20 Dec 20 Jan 21 Feb 21 Total
Decisions 6 2 1 2 0 1 0 1 5 0 1 1 30
Source: Horizon
Figure 7 below shows the mean and median time to decision for planning inquiry cases
under the Rosewell process. From Apr 20 there have been consistently fewer decisions
being issued, although Dec 20 and Jan 21 levels were comparable to Mar 20.
8
Data also published on gov.uk at https://www.gov.uk/guidance/appeals-average-timescales-for-arranging-inquiries-
and-hearingsFigure 7: Mean, Median Time to Decision, Rosewell Inquiry Process; Mar 20 to Feb 21
Source: Horizon
Note – no decisions were made during June 2020
Open Cases
At the end of February, the Planning Inspectorate had ten thousand five hundred cases
open9 (10,487). This is an increase of 147 from the previous month. The open cases
comprised 8,735 cases being handled through written representations; 1,041 through
hearings; and 660 through inquiries. This is not the number of ‘live’ hearings and inquiries
since it includes cases where the event (hearing or inquiry) has yet to start, as well as those
where the event has finished but the decision has yet to be issued.
For each procedure type, there are more cases with an event scheduled but not yet started,
than at any other stage in the process.
This information provides a ‘snapshot’ in time. As subsequent ‘snapshots’ are issued, more
insight will be possible – including such issues as how the numbers and proportions change
over time. Event refers to either a site visit, hearing or inquiry.
9
Open cases are any that have been received but on which a decision has not yet been made/ issued.
Cases included comprise Planning, Enforcement, and the following Specialist cases: Common Land,
Environment, Purchase Notice and Rights of Way. Tree Preservation Orders, Hedgerows and High Hedges
cases are excluded.Table 10: Open cases by procedure and stage, as of end of February 2021
Case deemed
Case received but Event complete but
valid, event date
Procedure yet to be deemed decision not yet Total
yet to be set / in
valid issued
the future
Written
978 6167 1,590 8,735
Representations
Hearings 75 853 113 1,041
Inquiries 4 546 110 660
Total 1,057 7,609 1,821 10,487
Source: Horizon and Picaso
Note there are 51 cases that have no procedure type recorded (see Background Quality Report for more detail)
Inspectors
Table 11 below shows the number of inspectors in the Planning Inspectorate in each month
from March 20 and February 2110. This includes headcount (i.e. the number of different
individuals) and full-time equivalents (FTE) where those working part time are counted in
proportion with their contracted hours. There were 345 Planning Inspectors employed by the
Inspectorate in February 21 – with a full-time equivalent of just over 308.1.
By both measures (headcount and FTE) the maximum Inspector resource was in March
2020; and by both, the number at the end of Jan 21 was the lowest.
Table 11: Planning Inspectors – Headcount and FTE; Mar 20 to Feb 21 (at end of month)
Month Mar 20 Apr 20 May 20 Jun 20 Jul 20 Aug 20 Sep 20 Oct 20 Nov 20 Dec 20 Jan 21 Feb 21
Headcount 361 357 356 356 355 352 352 347 345 345 343 345
FTE 323.6 320.8 319.1 319.0 318.2 316.0 316.4 310.0 308.1 308.1 305.4 308.1
Source: SAP HR
As above, Planning Inspectors work on a broader range of work than the appeals featured
in this Release. They also work on applications and examinations. Please note that data on
Planning Inspectors is only applicable to salaried employees (it does not include fixed term
contract Inspectors or non-salaried Inspectors).
10
Data as at the last day of the month.Virtual Events11
The Planning Inspectorate has continued moving casework forward during the pandemic by
adapting the ways of working so that examinations, hearings and inquiries (which would
previously have been held face-to-face) could take place virtually.
The Inspectorate are continuing to increase the number of events carried out ‘virtually’. The
table and graph below give the number of virtual events that have occurred each month.
Data for March 2021 is an estimate.
There were 91 cases involving Virtual Events during February, with 86 estimated for March
2021.
Data quality and corrections
There are concerns about the quality and accuracy of the data collection methods for
virtual events data. For National Infrastructure, the number given in the table is the number
of projects that have held virtual events. The number in brackets is the number of
individual events but this is potentially misleading as multiple sessions on the same day
(e.g. morning and afternoon sessions) have been counted as separate events.
Please note that in the last release the period December 20 to February 21 indicated that
no Local Plan events had been held virtually – this has been corrected to show 12, 5 and 7
plans having been held virtually in those respective months.
Table 12: Virtual Events, Jun-20 to Mar-21P
Case Type Jun-20 Jul-20 Aug-20 Sep-20 Oct-20 Nov-20 Dec 20 Jan 21 Feb 21 Mar 21
s78 Hearings 8 11 18 36 41 43 35 33 23 26
s78 Inquiries 4 6 4 11 11 17 16 15 15 16
Enforcement 0 1 3 9 15 18 20 28 34 26
Local Plans 1 2 3 7 14 12 12 5 7 5
National 3 1 1 2 10 3 6 3 4 2
Infrastructure (3) (3) (2) (3) (30) (9) (18) (7) (8) (2)
Other 0 1 0 0 4 16 6 13 8 11
Total 16 22 29 65 95 109 95 97 91 86
(16) (24) (30) (66) (115) (115) (107) (101) (95) (86)
Source: Virtual Events Project Dashboard, data as at 11/03/21
Numbers in brackets show count of events but note concerns above over counting sessions on same day.
Local Plans are counted as cases where at least one sitting day occurred in a month.
Other case type includes specialist casework like Environmental appeals, Transport examinations and Rights
of Way cases
P – These numbers should be treated as provisional due to concerns about quality and accuracy.
11
Virtual Events data includes casework types not covered elsewhere in this release, including Local Plans
and Nationally Significant Infrastructure Projects.Figure 8: Virtual Events; Jun 19 to Mar 21 Source: Virtual Events Project Dashboard, data as at 11/03/21 P – These numbers should be treated as provisional. Note – some cases can have multiple ‘events’ – for example an inquiry may sit over four to eight days but would only be counted as one ‘event’. On the other hand, casework like National Infrastructure may have multiple events for the same project. Local Plans are counted as cases where at least one sitting day occurred in a month.
Annex A – Content of ad-hoc Statistical Releases, 2020
Note: The Table below covers ad-hoc statistical releases. From November onwards, the content is fixed, so is the same as this publication.
 Date      March 2020                         April 2020                    July 2020                      September 2020                October 2020
 Content   Appeals receipts and               Appeals receipts       and    Appeals decisions between      Appeals decisions between     Appeals decisions from
           decisions in the last 12 and 24    decisions between             17th March 2020 and 22nd       17th March 2020 and           October 2019 to September
           months (1st March 2018 – 29th      17th March    2020     and    June 2020                      21st September 2020           2020
           February 2020)                     22nd April 2020
                                                                            Number of open cases           Number of open cases          Number of open cases
           Number of section 78 Planning      Live appeals in the system
           Appeals received / decided /       as at 23rd April 2020         Number of virtual events       Number of virtual events      Number of virtual events
           within target that used the
           written representation method in   Number     of     appeals     Number of appeals
           the last 12 months (1st March      involving housing within      involving housing within the
           2019 – 29th February 2020)         the system as at 23rd April   system as at 12th June 2020
                                              2020
           Number of dwellings decided
           and number of dwellings allowed    Virtual site visits
           by appeal decisions between 1st
           January 2017 and 31st
           December 2019.

           Number of Planning Inspectors
           employed by the Planning
           Inspectorate at the end of each
           quarter between 31st March
           2017 and 31st December 2019.
 Scope     England only                       England only                  England only                   England only                  England only

           Planning cases, Enforcement        Planning cases,               Planning cases, Enforcement    Planning cases, Enforcement   Planning cases, Enforcement
           cases and Rights of Way orders     Enforcement cases and         cases and Rights of Way        cases and Rights of Way       cases, Specialist cases:
                                              Rights of Way orders          orders                         orders                        Common Land, Rights of
                                                                                                                                         Way orders, Tree
                                                                                                                                         Preservation Orders, High
                                                                                                                                         Hedges appeals and
                                                                                                                                         Hedgerow appeals

                                                                                  17
Annex B – Mean and median time to decision, with standard deviation,
for planning, enforcement and specialist casework
Planning
Mar Apr May Jun Jul Aug Sep Oct Nov Dec Jan Feb
Measure Procedure Total
20 20 20 20 20 20 20 20 20 20 21 21
Valid to Written
20.3 24.3 26.5 23.2 22.6 22.5 23.3 25.3 26.6 24.6 23.6 22.5 23.5
decision Representations
(mean Hearings 42.0 40.8 42.9 50.0 46.7 42.2 51.3 39.7 35.4 45.9 46.2 41.2 42.6
weeks)
Inquiries 40.3 56.2 69.4 62.0 22.7 60.0 41.1 44.6 54.9 35.3 40.4 50.6 45.2
All Cases 21.6 25.2 27.1 23.5 22.9 23.0 23.7 25.6 27.0 25.4 24.5 23.2 24.1
Valid to Written
18.0 20.3 23.3 21.3 22.0 21.7 22.3 23.9 25.4 22.0 20.4 19.4 21.0
decision Representations
(median
Hearings 42.9 36.1 42.0 42.4 34.4 45.1 43.1 34.0 36.1 43.0 46.6 46.4 40.3
weeks)
Inquiries 30.3 42.4 69.4 62.0 23.4 49.2 41.1 34.8 53.9 39.4 40.7 42.9 40.0
All Cases 18.6 20.9 23.7 21.3 22.1 21.9 22.6 24.1 25.6 22.7 20.7 19.8 21.4
Standard Written
9.7 14.1 13.7 9.2 8.8 10.4 8.8 10.7 10.9 11.4 10.8 10.6 10.7
Deviation Representations
(weeks) Hearings 16.9 15.1 14.7 24.9 27.9 9.7 20.5 18.5 13.9 17.4 23.0 16.7 18.7
Inquiries 21.0 30.4 22.4 1.6 1.4 41.8 1.1 20.8 13.1 10.2 18.4 29.0 23.5
All Cases 11.6 15.0 14.4 10.0 9.6 11.4 9.8 11.3 11.3 12.3 12.3 11.6 11.7
Enforcement
Mar Apr May Jun Jul Aug Sep Oct Nov Dec Jan Feb
Measure Procedure Total
20 20 20 20 20 20 20 20 20 20 21 21
Valid to Written
31.7 34.1 33.0 35.0 37.2 36.8 37.1 41.4 36.7 38.4 36.5 35.4 36.3
decision Representations
(mean Hearings 67.9 69.7 74.8 94.8 96.5 34.4 34.3 84.4 54.4 64.3 82.7 66.3 73.4
weeks)
Inquiries 72.7 88.5 91.6 85.6 - - 84.6 43.9 62.5 102.9 94.7 108.7 83.4
All Cases 34.1 39.6 34.9 37.5 38.0 36.8 37.5 42.8 37.7 42.1 43.7 42.8 38.9
Valid to Written
27.9 32.1 28.5 28.9 32.6 33.3 33.6 36.9 33.9 35.3 31.1 28.1 32.3
decision Representations
(median
Hearings 72.0 70.4 76.5 93.4 100.1 34.4 34.3 89.0 56.0 68.5 78.8 68.8 71.4
weeks)
Inquiries 85.9 101.1 91.6 87.0 - - 84.6 42.6 56.1 99.0 96.9 125.3 86.0
All Cases 29.3 35.2 29.4 29.0 33.0 33.3 33.6 38.4 34.6 36.9 37.6 34.9 33.6
Standard Written
14.2 12.6 15.6 18.2 21.8 17.3 14.9 19.3 16.3 18.9 23.1 17.8 17.8
Deviation Representations
(weeks) Hearings 19.0 16.0 16.4 16.6 5.2 0.0 0.0 12.8 12.3 22.6 23.2 22.2 25.0
Inquiries 22.3 25.8 3.5 7.6 - - 0.0 10.1 10.1 19.2 21.0 23.2 25.0
All Cases 17.4 20.4 18.2 21.3 22.6 17.3 15.5 20.5 16.8 23.0 28.9 26.7 20.9
18Specialist
Mar Apr May Jun Jul Aug Sep Oct Nov Dec Jan Feb
Measure Procedure Total
20 20 20 20 20 20 20 20 20 20 21 21
Valid to Written
39.1 32.6 29.4 37.4r 40.9r 34.6 45.2 38.9 37.5r 43.6 42.7 53.8 0.0
decision Representations
(mean Hearings 58.7 - - - - 62.1 - - - - 89.8 65.0 70.8
weeks)
Inquiries 45.0 67.7 65.0 62.0 71.6 47.9 63.7 37.3 66.7 59.9 58.4 77.6 58.6
All Cases 39.9 33.8 32.3 40.6 42.3 37.6 47.0 38.8 39.4 44.3 46.1 54.7 41.2
Valid to Written
34.0 26.1 18.6 34.5 39.8 35.9 48.1 33.7 39.1 42.4 43.6 53.3 36.0
decision Representations
(median
Hearings 58.7 - - - - 62.1 - - - - 102.1 65.0 63.1
weeks)
Inquiries 41.5 45.4 65.0 63.5 71.6 43.1 65.0 37.3 60.4 59.9 64.0 81.9 54.7
All Cases 36.5 26.1 19.9 37.1 40.9 37.3 48.7 35.5 41.1r 44.0 52.9 54.0 38.0
Standard Written
20.4 20.1 16.3 22.6 16.4 17.0 24.5 26.6 16.7 25.6 33.3 24.0 24.0
Deviation Representations
(weeks) Hearings 0.0 - - - - 0.0 - - - - 18.1 0.0 22.5
Inquiries 6.6 35.5 0.0 6.5 0.6 13.4 12.7 0.0 17.3 13.1 19.5 19.9 20.2
All Cases 19.8 21.8 18.5 23.1 17.2 17.7 24.3 26.4 18.3 25.4 33.7 24.2 24.5
r denotes revision – a change of more than 0.5 weeks since last month.Annex C – Detailed Information on timeliness (February)
The information below is published today on the number and length of decisions made in
February 202112:
Casework Type Procedure Type Mean (weeks) Median (weeks) Decisions
s78 planning appeals Written
Representations
23.8 20.6 811
Hearings 41.2 46.4 33
Inquiries 52.1 43.8 8
Householder Written
appeals Representations
18.9 16.4 343
Enforcement Written
appeals Representations
35.4 28.1 95
Hearings 66.3 68.8 10
Inquiries 108.7 125.3 7
The smaller the number of decisions, the less helpful the mean and median are as
measures for summarising performance. Particular care should be taken when there are
fewer than twenty decisions. These are shaded grey in the table but have been provided
for completeness and transparency.
The information published below shows the time taken for different stages of the appeals
process:
s78 planning appeals Householder
Written
Representations
Hearings Inquiries appeals
Weeks between valid date & start date
Mean (average) 9.2 19.0 5.5 4.9
Median (average) 8.0 19.0 2.4 4.0
Cases that started in
Feb 21
804 121 20 419
Weeks between start date & event date
Mean (average) 12.4 30.1 32.3 6.3
Median (average) 9.7 27.0 24.0 4.9
Cases where an
event occurred 707 38 17 436
during Feb 21
Weeks between event date & decision date
Mean (average) 5.0 5.6 11.6 4.1
Median (average) 3.3 4.3 12.1 2.3
Cases that have
been decided in Feb 811 33 8 341
21
• Valid date – the date a case is deemed to have been validly received
• Start date – date when a case has started its documentation phase (requesting
statements and additional information) and an Inspector resource has usually been
identified to carry out the case
• Event date – the date of either a site visit, hearing or inquiry
12
Also published on gov.uk here https://www.gov.uk/guidance/appeals-average-timescales-for-arranging-
inquiries-and-hearings• Decision date – the date the decision was issued by The Planning Inspectorate
Annex D – Casework types included in this release

Planning covers s78 planning appeals, Householder appeals, Commercial appeals, s20
Listed Building appeals, Advertisement appeals, s106 Planning Obligation appeals and
Called In Planning Applications.

Enforcement covers s174 Enforcement appeals, s39 Enforcement Listed Building appeals
and Lawful Development Certificate appeals.

Specialist casework includes Common Land, Rights of Way orders, Purchase orders, Tree
Preservation Orders, High Hedges appeals and Hedgerow appeals.
Note that the data on Open Cases excludes Tree Preservation Orders and High Hedges
and Hedgerow appeals.

 Background notes

Data sources
Horizon / Picaso – The main casework management systems used for processing appeals
casework.
SAP HR – The Human Resources system database used to store all information regarding
members of staff.

 Measure                 Definition
 Mean                    The total time taken divided by the number of cases. Also referred
                         to as the ‘average’. A measure of how long each case would take,
                         if the total time taken was spread evenly across all cases.
 Median                  This is the time taken by the ‘middle’ case if all cases were sorted
                         from quickest to longest
 Standard deviation      This is a measure of variability or spread. It is calculated by
                         examining how much each value differs from the mean. A higher
                         standard deviation means the individual decision times vary more
                         widely around the mean.

Compliance with the Code of Practice for Statistics
These statistics have been published in accordance with the Code of Practice for Statistics,
which cover trustworthiness, quality and value. They have been pre-announced, and
publication is overseen by the Head of Profession.

Technical Notes
A Background Quality Report is published alongside this Statistical Release. It provides
more detail on the quality of statistics in this publication.

 Data quality         Data on cases is taken from a live casework system, and details of
                      cases can change for a number of reasons even after a decision has
                      been made. We are seeking to get a better understanding of the
                      nature and volume of these changes and will provide further
                      information as it is available.
                      We carry out regular checks on the quality of our data and may
                      undertake ad hoc data cleansing exercises. Therefore, all the data
                      for the last 12 rolling months is published in provisional form.
We have indicated in this publication any data where a number of
cases has changed by more than five cases in a month; or where a
measure (mean, median or standard deviation) has changed by
more than 0.5 weeks.
Virtual Events Data is currently being sourced from an operational MS Excel
workbook. It is therefore being constantly updated and refined and
may result in data may changing between monthly publications.
There are concerns about the quality and accuracy of the data
collection methods. Definitions of what constitutes an event are
being refined, as this differs according to the type of casework.
Whilst this work is in progress these numbers should be treated as
provisional.
Data for Local Plans is now being sourced from information recorded
by Inspectors on their timesheets.
Measuring Data are measured in days and then converted to weeks.
weeks Note that not all decimal values are possible where converting days
to weeks. 1 day is 1/7 of a week, or 0.14 weeks (to two decimal
places). 2 days = 0.29; 3 days = 0.43; 4 days = 0.57; 5 days = 0.71;
6 days = 0.86.
When these are used to calculate averages, or displayed to one
decimal place, the result will not equate to a full day which can be
misleading: it may appear that we are measuring part days (e.g. 19.8
weeks) but we only measure in whole days.
Glossary
Term Explanation
Appeals The right to appeal a planning decision made by a local authority is a
key feature of the planning system, as is appealing when an authority
is taking too long.
Appeals decided Number of appeals by the date the appeal was decided by The
Planning Inspectorate.
Appeals Number of appeals by the date the appeal was received by The
received Planning Inspectorate.
Applications Planning Inspectorate manage the application process for proposed
Nationally Significant Infrastructure Projects (NSIPs) within England
and Wales in line with the 2008 Planning Act.
Closed The total number of appeals decided, withdrawn or turned away.
Decision The outcome of the case e.g. appeal allowed or rejected. The date of
the decision is taken as the date a decision letter is sent to the
appellant.
Event A site visit, hearing or inquiry (may be virtual)
Event Type The different options of how an Inspector visits a site for a written
representations appeal.
Examinations The process of examining local plans is dealt with by the Planning
Inspectorate. Every Local Planning Authority is required to have a
local plan. This includes a vision for the future and plan to address
housing needs in the area.
When a Local Planning Authority has finished preparing and
consulting on a local plan it must be submitted to the Secretary ofState who appoints an Inspector to carry out an independent
examination.
FTE Full Time Equivalent – a count of employees where those working
part time are counted in proportion with their contracted hours.
Headcount Total number of staff employed regardless of how many hours they
work (i.e. the number of different individuals).
Hearings A hearing involves the submission of written evidence by the main
parties and a hearing once all the written submissions have been
received.
This takes the form of a round-the-table discussion (in person or
virtually) that will be led by the planning inspector. It allows for all
parties to respond to any questions that the inspector might have,
and to let everyone make their case known.
Source: Planning Portal
Inquiries An inquiry is usually used for complex cases where legal issues may
need to be considered. The main parties will usually have legal
representatives to present their case and to cross-examine any
witnesses. Prior to the inquiry date, the Planning Inspectorate will
expect to have received various documents from all parties that will
be taking part in the appeal. These may include statements of case
and proofs of evidence from expert witnesses. Third parties may also
take part. The inquiry will be led by the inspector and will follow a
formal procedure.
At some point during or on conclusion of the inquiry the inspector and
the main parties will undertake a site visit.
Source: Planning Portal
Live appeals Number of live appeals in that have an appeal valid date but no end
date (either decision date or a closed date, e.g. for appeals that have
been withdrawn).
Open Cases Number of cases that have been received but on which a decision
has not yet been made/ issued. Will differ from Live Appeals as it
includes those received but not yet verified.
Procedure Type The method by which The Planning Inspectorate processes and
decides appeals.
Written Most planning appeals are decided by the written representations’
Representations procedure. With this procedure the Inspector considers written
evidence from the appellant, the LPA and anyone else who has an
interest in the appeal. The site is also likely to be visited.
Contact Us
The Planning Inspectorate welcome feedback on our statistical products. If you have any
comments or questions about this publication or about our statistics in general, you can
contact us as follows:
Media enquiries 0303 444 5004
email press.office@planninginspectorate.gov.uk
Public enquiries email statistics@planninginspectorate.gov.ukPlease note we are currently reviewing our statistics with a view to making them as clear
and helpful as possible for users. We would be delighted if you could contact us via the
address below with any views on this approach; particularly on what content would be most
useful and why.
email statistics@planninginspectorate.gov.uk
If you require information which is not available within this or other available publications,
you may wish to submit a Request for Information under the Freedom of Information Act
2000 to the Planning Inspectorate. For more information, see: https://www.gov.uk/make-a-
freedom-of-information-request/the-freedom-of-information-actYou can also read