Modal Choice after Opening New Railway in Bangkok - Case of Dark Red Line- ร ปแบบ ...
←
→
Page content transcription
If your browser does not render page correctly, please read the page content below
การประชุมวิชาการวิศวกรรมโยธาแห่งชาติ ครั้งที่ 25            The 25th National Convention on Civil Engineering
                      วันที่ 15-17 กรกฎาคม 2563 จ.ชลบุรี                                     July 15-17, 2020, Chonburi, THAILAND

                             Modal Choice after Opening New Railway in Bangkok
                                         - Case of Dark Red Line –

                          Noriyasu Tsumita1* Bethala Aditya2 Varameth Vichiensan3 Jetpan Wetwitoo4
                                                     and Atsushi Fukuda5

                                          1 Department of Transportation Systems Engineering,
                                  Graduate School of Science and Technology, Nihon University, Japan
            2,5 Department of Transportation Systems Engineering, College of Science and Technology, Nihon University, Japan
                        3 Department of Civil Engineering, Faculty of Engineering, Kasesart University, THAILAND
                                            4 Creative Research and Planning Co.Ltd., Japan
                                   *Corresponding author; E-mail address: csno18006@g.nihon-u.ac.jp

Abstract                                                               1. Introduction
     Although urban road traffic studies have been conducted         Many cities in developing countries face severe traffic
extensively in Bangkok, the survey of demand elasticity for     problems due to traffic congestion resulting in significant delays,
service levels such as travel time, fare, and frequency of the  substantial economic losses, and environmental degradation [1-
urban rail transit has not been insufficiently carried out and  2]. These problems are caused by unorganized urban growth,
understood. Thus, it is impossible to estimate the number of    high levels of suburbanization, rapid motorization, and low
railway passengers accurately and set the service levels for thequality of public transportation [3-5]. Therefore, the
urban railways currently being developed. Therefore, it is strongly
                                                                improvement of public transport is expected to alleviate these
required to clarify the influence of service levels on railway  problems; however, it is not easy. In Bangkok, the development
demand. For that purpose, we conducted a stated preference      of an urban railway system started in 1999. Due to urbanization
survey along the Dark Red Line (DRL) that is scheduled to open  and rapidly increasing urban population, a master plan for urban
later this year. We estimated a discrete modal choice model and railway network has been proposed and revised from time to
examined the choice preference concerning fare, travel time, andtime. Then, a draft revision of the M-MAP (Mass Rapid transit
frequency. The survey was conducted in the vicinity of DRL      Master Plan in the Bangkok Metropolitan Region) was proposed
stations, namely Rangsit and Thammasat University stations.     in 2019; [6]. To efficiently update the master plan, it is necessary
Among the 243 samples collected, 174 are valid and completed.   to discuss the service level of the urban railway system based on
A multinomial logit (MNL) model was estimated where the         elasticity for the railway service such as fare, travel time,
likelihood-ratio and hit-ratio are satisfied. The results revealed
                                                                frequency, etc.
that shorter travel time and more comfortable access                 However, so far, the railway system's service elasticities have
transportation are significantly preferable. On the other hand, never been measured in the travel survey in Bangkok. This is
variation in fare level did not have a significant effect on mode
                                                                because the s h a r e o f u r b a n r a i l t r a n s p o r t in Bangkok is
choice.                                                         significantly lower than in other modes [6]. As a result, it was
Keywords: Multinomial Logit Model, Dark Red Line (DRL), Service difficult to estimate the impact of railway service levels in the
                                                                demand forecasting process. This makes it very difficult to
Level, Urban Railway
                                                                accurately assess the diversion of demand from the other modes
                                                                of transport to the railway.

                                                                TRL13-1
การประชุมวิชาการวิศวกรรมโยธาแห่งชาติ ครั้งที่ 25 The 25th National Convention on Civil Engineering
วันที่ 15-17 กรกฎาคม 2563 จ.ชลบุรี July 15-17, 2020, Chonburi, THAILAND
The objective of this study is to examine the impacts of transport and measured the effectiveness of policies. However, it
service level for the preference of urban railway by estimating a was not relevant to understand the service level and its elasticity
multinomial logit (MNL) model that includes service level of of the new public transportation (e.g., urban railway and Bus
urban railway based on stated preference (SP) survey data. The Rapid Transit, etc.). Therefore, the present study focuses on
case study is the Dark Red Line (DRL), which is being developed understanding people's preferences and behavior concerning
in Bangkok according to its 'M-MAP' railway master plan, and the changing the service level. A multinomial logit model is
first phase is expected to open in 2021. The train will be running estimated based on the SP survey data. Besides, the elasticity of
in the north-south direction, namely between Bang Sue and railway preference to changing service levels such as travel time,
Rangsit areas. It is likely that commuters and students in north travel cost, waiting time, etc. will be presented.
districts, including Thammasat University, will be using.
The remainder of the paper is organized as follows. The 3. The Case Study
literature review will be presented in Section 2. The SP survey
3.1 SRT Dark Red Line (DRL)
and MNL model will be described in Section 3. The estimation
results will be presented in Section 4 with some discussion and Residents in the Rangsit area, including students and
application. The elasticity of service level will be presented in commuters in Thammasat University district, are having difficulty
Section 5. Finally, Section 6 concludes the paper. traveling from/to the city center due to traffic congestion and
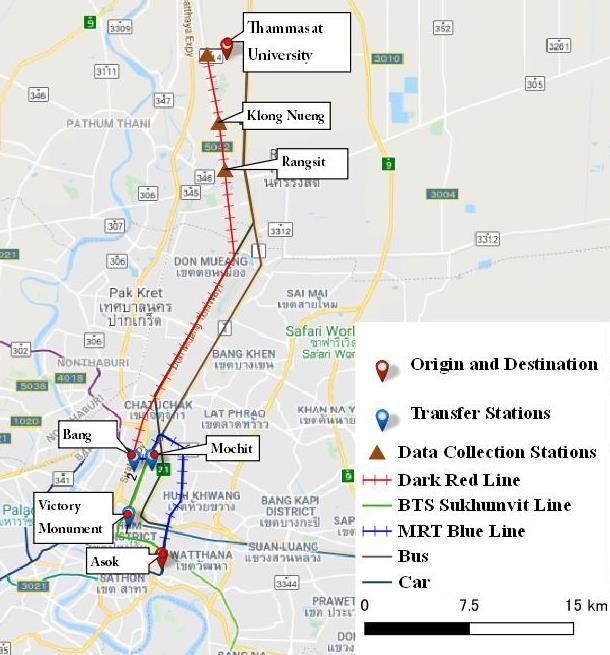
delay, as shown in Table 1; [23-27]. They are traveling by
2. Discrete Choice Analysis in Public passenger cars, buses, or van up to Victory Monument station or
Transportation Studies Mo chit station. They have to transfer into the other modes: BTS
Sukhumvit Line, MRT Blue Line, and local buses to reach their
Many studies discussed the understanding of the traveler's destination, illustrated in Figure. 1. According to the M-MAP
attitude and preference based on the SP survey. The impacts of railway master plan, the Dark Red Line (DRL) has been proposed,
new public transportation systems in Southeast Asian Cities were currently under construction and scheduled to open in 2021
estimated by developing discrete choice models, e.g., Binary from Bang Sue to Rangsit, and extended its service to
logit, Multinomial logit and, Nested Logit model, based on the Thammasart University in 2022. The railway is an elevated
collected survey data from conducting an SP survey; [7-11]. In structure built on the premises of the State Railway of Thailand.
particular, some of the studies tried to understand each Moreover, it is being considered to extend about 51 km to the
parameter's influence, such as travel time, travel cost, etc., on north of Thammasart University. DRL will hopefully not only help
commuting trips; [12-16]. Moreover, some studies analyzed the daily commuters or students to access from/to the city center of
elasticity of travel time and travel costs concerning various Bangkok but also allow travelers to connect to the Don Mueang
policies, such as reducing travel time and determining a fare International Airport. In this study, the attributes of the presently
structure for the new transit system; [17-19]. Furthermore, some available travel mode choices between Asok and Thammasat
studies evaluated scenarios: promotion of usage of new public University and between Asok and Rangsit are shown in Table 1.
transit such as Park & Ride, determination of parking fee for DRL is expected to save travel time, waiting time, and travel
passenger car or motorcycle. These studies calculated the costs.
change in a modal split when increasing or decreasing the travel
time and travel cost. They conducted a preliminary survey on
the rail and other modal choice behavior in Bangkok to forecast
the railway demand; [6,20-22].
It should be noted that the demand forecast in those studies
was done by a comprehensive model where the impact of
significant factors such as waiting time and transfer time was not
addressed. These studies employed a discrete choice model to
examine people's attitudes and preferences to use public
TRL13-2การประชุมวิชาการวิศวกรรมโยธาแห่งชาติ ครั้งที่ 25 The 25th National Convention on Civil Engineering
วันที่ 15-17 กรกฎาคม 2563 จ.ชลบุรี July 15-17, 2020, Chonburi, THAILAND
Table 1 Attributes of the present travel modes 3. Travel Time, travel cost, waiting time of Van and Van
(Source: BTS HP, MRT HP, Transit Bangkok HP) transfer at Victory monument and Mochit to arrive the
Asok-Thammasat Asok
Travel Time Travel Cost Waiting and
Mode 4. Travel Time, travel cost, waiting time of the train, and
(min) (THB) Trasfer Time (min)
Car 80 170 0 train transfer at Victory monument and Mochit to
Transfer at Victory Bus+BTS 97 65 16 reach the Asok
Monument Van+BTS 63 88 11
Bus+Bus 94 69 15
In addition to the SP questions, we also asked for the other
Van+BTS 56 82 10 information, such as available alternative modes, the reason for
Transfer at Mo Chit
Bus+MRT 89 60 18 choosing the mode, fare information, and personal information.
Van+MRT 51 73 13
Asok-Rangsit
These additional data were useful in the analysis of SP data and
Car 68 150 0 explanation of the behavioral responses.
Transfer at Victory Bus+BTS 75 55 16
Monument Van+BTS 48 80 11 3.3 Stated Preference (SP) Survey
Bus+BTS 72 59 15
Van+BTS 49 74 10
The SP survey was conducted during December 2019 and
Transfer at Mo Chit January 2020 on a weekday by interviewing respondents at three
Bus+MRT 67 50 18
Van+MRT 44 65 13 locations around the two envisaged stations (Klong Nueng Station
and Rangsit Station) and Thammasat University. The positions are
shown in Fig. 1. We selected and conducted this area and
weekday to examine the preference of commuters or students.
The respondents were asked to choose among four alternative
modes: Bus, Van, Passenger Car, and Train. In this study, we
assumed there is no modal change between the first and second
modes. Therefore, the travel choices are the passenger car, Bus-
Bus, Van-Van, and Train-Train in the SP experiment. Among the
250 samples, 174 samples of them are valid. Fig. 2 shows the
survey result of the Revealed Preference part. From this result,
half of the respondents chose train (MRT Blue Line) as a primary
mode of commuting and going to school.
1.7%
3.4%
20.7%
5.2%
Fig.1 The Study Area 50.0% 12.1%
3.2 Questionnaire Design 12.1%
This study employed a Stated Preference (SP) survey to
consider the attribute of DRL that influences the commuter's Car Motorcycle Bus
Bus+Bike Taxi Van + Train Van+ Bike Taxi
modal choice decision. The characteristics of each mode include: Taxi + Train
1. Travel Time, travel cost of a passenger car to reach Fig.2 Modal Split from the Revealed Preference Survey
the Asok Table 2 presents the distribution of individual and household
2. Travel Time, travel cost, waiting time of bus and bus monthly income, Occupation, Age, Gender for each traveler
transfer at Victory monument, and Mochit to reach the group. Most of the passenger car users have a high salary.
Asok Moreover, 80% of the respondents are either students or
TRL13-3การประชุมวิชาการวิศวกรรมโยธาแห่งชาติ ครั้งที่ 25 The 25th National Convention on Civil Engineering
วันที่ 15-17 กรกฎาคม 2563 จ.ชลบุรี July 15-17, 2020, Chonburi, THAILAND
company officers reflected by their trip purposes of commuting The parameters (Bijk) in Equation (2) can be estimated by the
or going to study place. maximum likelihood method. Each estimated parameter may be
interpreted as an estimate of the weight of the corresponding
Table 2 Characteristics of the Respondents attribute k n the utility function Vj of alternative j.
Characteristics User Group
4.1 Utility Functions
Monthly Individual Passenger
Bus Van Train
Income (Unit: THB) Car In this analysis, four alternatives for transport mode are
10000 or less 0.0% 0.0% 1.7% 32.8% motorcycle, van, passenger car and, bus. The utility functions of
10001-20000 2.9% 0.6% 5.2% 27.6% van and bus consist of an alternative specific constant (ASC),
20001-30000 1.1% 0.0% 4.6% 13.2% travel time, travel cost, and transit & waiting time. Note that
30001-40000 0.0% 0.0% 8.6% 1.7% passenger car's utility does not include transportation and waiting
Occupation time, while the train's utility consists only of travel time, travel
Student 0.0% 0.0% 5.2% 43.1%
cost, and waiting and transit time. They are expressed
Company 1.7% 0.0% 5.7% 23.6%
mathematically, as shown in Eq. (3) to (5), respectively.
Freelance 0.6% 0.6% 0.0% 2.3%
Government 1.7% 0.0% 4.0% 6.3%
Retail business Owners 0.0% 0.0% 5.2% 0.0% V Passenger Car = ASC Passenger Car + β c(Travel Cos t )
Age(Unit: Years old)
(3)
+ β t (Travel Time)
19-29 2.3% 0.6% 6.9% 59.2%
30-39 1.2% 0.0% 10.3% 14.4% V Van, Bus = ASC Passenger Car + c (Travel Cos t )
40-49 0.6% 0.0% 1.7% 1.2% + t (Travel Time) (4)
50-59 0.0% 0.0% 1.2% 0.6% + wt (Waiting and Transit Time)
Sex
female 2.3% 0.6% 5.2% 35.1% VTrain = c (Travel Cost) + t (Travel Time)
male 1.7% 0.0% 14.9% 40.2% (5)
+ wt (Waiting and Transit Time)
4. Multinomial Logit Model The ASC terms represent the effect that is not related to the
The multinomial logit (MNL) model is commonly employed other attributes; however, they have a contribution to the
in the analysis of choice behavior. It is based on the Random indirect utility amount. In this case, the sign for ASC is expected
Utility Theory; [22]. It expresses each mode probability (P) that to be negative because people are likely to prefer the train,
an individual i selects a specific alternative j as a function of the which provides the best services. Travel cost is in Baht where
utilities among M alternatives available in the choice set, as travel time and waiting time are in minutes.
expressed in Equation (1); 4.2 Estimation and Validation
The estimated parameters are evaluated by considering the
e V ij (1)
P ij = M corresponding t-value under 90% and 95% confidence levels. For
e
m =1
V ij
the overall goodness of fit, likelihood-ratio is presented to assess
the power of the model with estimated coefficients concerning
The deterministic part of the utility (V) of an alternative j is the null model (where all coefficients are zero). For validation, a
related to relevant attributes (Xij) which represent the alternative hit-ratio is performed to determine how accurate the model can
and individual variables (travel time, travel cost) as defined in predict the choice. In this study, we estimated the parameters
Equation (2); by using Programming language "R."
4.3 The Results
K
V ij =
k =1
jk ijk (2) In this paper, the two MNL models are presented. Model 1
exhibits the estimated coefficients for travel time, travel cost
TRL13-4การประชุมวิชาการวิศวกรรมโยธาแห่งชาติ ครั้งที่ 25 The 25th National Convention on Civil Engineering
วันที่ 15-17 กรกฎาคม 2563 จ.ชลบุรี July 15-17, 2020, Chonburi, THAILAND
(fare), and the corresponding ASCs. Model 2 additionally includes (70- 90 THB) in the current situation, DRL will be possibly used
the waiting and transfer time. The estimation results are shown by many commuters and students (87.3 to 98.1 percent). This
in Table 3, where the coefficients with the corresponding t-value trend is similar for travel time. Moreover, in Figure 3 and Figure
are shown. In Model 1, the ASCs of Bus and Car are not 4, the travel time reduction has more pronounced effects than
statistically significant. The ASC of Passenger car only has a the train fare having on the number of train users.
positive sign, indicating that in general, the passenger car is
preferable than rail.
100.0%
Rail, in contrast, the ASCs of Van and Bus have negative signs, 90.0%
suggesting that they are inferior to Car and Rail. The travel time 80.0%
Proportion of train user
70.0%
is found to be statistically significant in both models. 60.0%
Furthermore, in Model 2, the ASC of Bus and the Waiting and 50.0%
40.0%
Transfer time are not statistically significant. This result indicates 30.0%
that transit time and waiting time do not influence the choice of 20.0%
10.0%
travel mode. One of the possible explanations is that rail 0.0%
passengers have perceived the waiting and transfer time in the 50 60 70 80 90 100 110 120 130 140 150 160 170 180 190 200
Train fare (THB)
total trip time. In terms of the goodness of fit, Model 1 and Model Fig. 3 Choice Probability of Train Under Various of Train Fares
2 are nearly similar, by considering hit-ratio and likelihood-ratio.
However, the significant power of the coefficients of Model 2 is 100.0%
90.0%
more reliable than Mode 1. Therefore, Model 2 will be used for 80.0%
Proportion of train user
further analysis of elasticity in the next section. 70.0%
60.0%
Table 3 Estimation Results 50.0%
40.0%
Model1 Model2 30.0%
20.0%
Variables Coefficient(t-value) Coefficient(t-value) 10.0%
ASC_Bus -0.653(-0.786) 1.327(1.521) 0.0%
70 80 90 100 110 120 130 140 150 160 170 180
ASC_Van -3.986(-3.839)* -2.416(-3.507)** Travel time (Minutes)
ASC_Car 0.346(0.682) 1.484(1.832)* Fig. 4 Choice Probability of Train Under Various Train Travel Times
Travel Cost -0.004(-1.924)* -0.042(-2.242)**
Travel Time -0.034(-2.989)** -0.061(-4.722)** 6. Conclusions
Waiting, Transfer Time 0.005(0.141)
This paper has presented an analysis to examine
Number of Observations 174 174
respondents' preference towards DRL in Bangkok based on the
Likehood-Ratio 0.505 0.485
stated preference (SP) survey. Two Multinomial Logit (MNL)
Hit-Ratio 75.30% 65.50%
model were presented. It is found that travel time is a more
* Significant at.10 and ** at .05 levels critical factor than travel cost for the modal choice of commuting
or going to school. Moreover, the elasticity analysis of DRL has
5. The elasticity of the Dark Red Line shown that at the same service level as the current situation,
The multinomial logit (MNL) model presented in the previous there is a possibility that people will choose the train to
section is employed to understand the effectiveness of service commute and go to study places. It was revealed that railways'
levels (travel time and travel cost) on the proportion of train service level (travel time and fare) has a significant influence on
users when DRL opens. The elasticity to train's travel time and demand. Besides, travel time was shown to be a more influential
the fare is shown in Fig. 3 (travel time) and Fig. 4 (fare), factor than travel costs. However, this study has considered each
respectively. It shows the percentage of train users at each range mode's service level in a representative manner where access to
of travel time and fare. To compare with the travel cost with the each transport model is not explicitly represented, i.e., access to
current situation, If DRL fare is at the same level of travel cost station or bus stops. This point is left for further studies.
TRL13-5การประชุมวิชาการวิศวกรรมโยธาแห่งชาติ ครั้งที่ 25 The 25th National Convention on Civil Engineering
วันที่ 15-17 กรกฎาคม 2563 จ.ชลบุรี July 15-17, 2020, Chonburi, THAILAND
References [11] Wibowo, S S. and, Chalermpong, S. (2010). Characteristics
of Mode Choice within Mass Transit CatchmentcArea .
[1] Nakamura, K., Fujita, M., Kato, H. and, Hayashi, Y. (2014).
Journal of the Eastern Asia Society for Trans portation
Evaluation for Quality Improvement of Transport System
Studies, Vol.8, pp. 1261-1274.
for Asian Developing Megacities – A Case Study of Bangkok-,
[12] Hayashi, Y., Anurakamonkul, K., Okuda, T., Osman, O. and,
Journal of JSCE, No. 70, Vol.5, pp. I_453-I_462.
Nakamura, H.) 1998 .(Examining the Effects of a Mass Rapid
[2] United Nations Centre forRegionalRDevelopment . (2017).
Transit Systems on Easing Traffic Congestion in Auto-
Insight to Implementation of the Bangkok2020 Declaration-
Dependent Bangkok. Regional Development Studies, Vol.4,
Policy Trends and Developments, Challenges and
pp. 65-85.
Opportunities, 111pp.
[13] Nguyen, C D., Hoang, D H., Hoang, T H., Buli, T Q. and,
[3] UnitedNationsESCAP . (2011). Sustainable Urban
Nguyen, P L.) 2019 .(Modal Preference in Ho Chi Minh City,
,Transportation Systems49pp.
Vietnam: An Experiment with New Modes of Transport.
[4] Doi, K. (2015)) Chapter 1: Cities and Transportation, in: Doi,
Sage Open, pp.1 -14.
K., Doi, K.Morimoto, A. (Eds.), Traffic and Safety sciences -
[14] Nurddern, A., Rahmat, O.K. A. R. and, Ismail A. (2007). Effect
Interdisciplinary Wisdom of IATSS, International Association
of Transportation Policies on Modal Shift from Private Car
of Traffic and Safety Sciences, pp. 12-21.
to Public Transport in Malaysia Journal of Applied .
[5] Jittrapirom, P. and,Janesirisak , S. (2017). Planning Our Way
Sciences, 7(7), pp. 1013-1018.
ahead: A Review of Thailand' s Transport Master Plan for
[15] Luathep, P. ,Suttipan ,S .and ,Jaensirisak ,S) .2015 .(
Urban Areas, Transportat ,ion Research Procedia25C, pp.
Challenge of Public Transport Planning in Private Vehicle
3989-4006.
Dominated Community Journal of the Eastern Asia .
[6] JICA(2019). Data Collection Survey on The Development of
Society for Transport ,ation StudiesVol.11 ,pp .1122-1139.
Blueprint for The Second Mass Rapid Transit Master Plan
[16] Satiennam, T. ,Jaensirisak ,S., Natevongin, N. and,
(M-MAP2) in The Kingdom of Thailand.
Kowtanapanich, W. (2011). Public Transport Planning for a
[7] Avinsyah., Soehodho, S. and, Nainggolan, J P. (2005). Public
Motorcycle Dominated Community. Journal of the Eastern
Transport User Attitude Based on Choice Model Parameter
Asia Society for Transport ,ation StudiesVol.9 ,pp .970-985.
Characteristics (Case Study: Jakarta Busway System).
[17] Jaensirisak, S. ,Luatep ,P .and ,Paksarawan ,S) .2017 .(
Journal of the Eastern Asia Society for Transportation
Willingness and Ability to Pay for a New Public Transport:
Studies, Vol.6, pp. 480-491.
a Case Study of Korat City, Thailand. Journal of the Eastern
[8] Dissanayake, D. and, Morikawa, T. (2010). Investigating
,Asia Society for Transportation StudiesVol.12 ,pp.2310-
Household Vehicle Ownership, Modal Choice and Trip
2320.
Sharing Decision Using a Combined Revealed Preference/
[18] Nguyen, T S. and, Nguyen, D C. (2017). Travel Demand for
Stated Preference Nested Logit Model: Case Study in
:Metro in Ho Chi Minh CityA Discrete Choice Experiment
Bangkok Metropolitan Region. Journal of Transport
AnalysisJournal of Economic Development ., 24(3) ,pp .
Geography, pp. 1-26.
116-136.
[9] Fillone, M A., Montalbo, M Cresencio. and, Tiglao C C N.
[19] Satiennam, T. ,Jaensirisak ,S., Satiennam, W. and,
(2007). Transportation Mode Choice Models for Metro
Detdamrong, S. (2016). Potential for Modal Shift by
Manila and Urban transport Policy Applications. Proceeding
Passenger Car and Motorcycle Users towards Bus Rapid
of the Eastern Asia Society for Transportation Studies,
Transit(BRT) in an Asian Developing city. IATSS Resear ,ch
Vol.6, 16pp.
36 ,pp .121-129.
[10] Kaewkluengklom, R. ,Satiennam ,W., Jaensirisak, S. and,
[20] Belgiawan, P F. ,Iiahi ,A .and ,Axhausen ,K W) .2017 .(
Satiennam, T. (2017). Influence of Psychological Factors on
Influence of Pricing on Mode Choice Decision in Jakarta a
Mode Choice Behaviour: Case Study of BRT in Khon Kaen
Random Regret Minimization Model ,ETH Working Paper .
City, Thailand, Transportation Resea ,rch Procedia25 ,pp .
15pp.
5072-5082.
TRL13-6การประชุมวิชาการวิศวกรรมโยธาแห่งชาติ ครั้งที่ 25 The 25th National Convention on Civil Engineering
วันที่ 15-17 กรกฎาคม 2563 จ.ชลบุรี July 15-17, 2020, Chonburi, THAILAND
[21] Jaensirisak, S. and, Srisurapanon, V. (2003). The Use of
Stated Preference Techniques in Forecasting Travel
Demand on a New Motorway in Thailand. Journal of the
,Eastern Society for Transporation StudiesVol.5 ,pp.1606-
1620.
[22] Wulansari, N D. and, Astari, D M. (2018). Mode Choice
Analysis using Discrete Choice Model from Transport User
(Case Study: Jakarta LRT, Indonesia). Matec Web of
,Conference181 ,pp .1-10.
[23] BTS HP, URL:
https://www.bts.co.th/eng/service/timetable.html.
[24] MRTA HP, URL:https://www.mrta.co.th/th/.
[25] Transit Bangkok HP, URL:
https://www.transitbangkok.com/bangkok_buses.html
[26] Romerio HP, URL: https://www.rome2rio.com/map/Asok-
BTS-Station/Thammasat-University.
[27] Domencich, T A. and, McFadden, D. (1975). Urban Travel
Demand: A Behaioural Analysis. North-Holland,
Amsterdam.
TRL13-7You can also read