Breast Cancer Biomarker Prediction Model Based on Principal Component Extraction and Deep Convolutional Network Integration Learning
←
→
Page content transcription
If your browser does not render page correctly, please read the page content below
E3S Web of Conferences 185, 04028 (2020)                                                                http://doi.org/10.1051/e3sconf/202018504028
ICEEB 2020

         Breast Cancer Biomarker Prediction Model Based on Principal
         Component Extraction and Deep Convolutional Network
         Integration Learning
         Kun Ruan1, Yuhao Peng1,Yuhan Kang1,Shun Zhao1,Tanke Wang1,Yuchi Zhang1 and Tao Liu1,*
         1   Sichuan Agricultural University, No. 46, Xinkang Road, Ya'an, Sichuan, China

                        Abstract. Effective extraction of characteristic information from sequencing data of cancer patients is an
                        essential application for cancer research. Several prognostic classification models for breast cancer
                        sequencing data have been established to assist patients in their treatment. However, these models still have
                        problems such as poor robustness and low precision. Based on the convolutional network model in deep
                        learning, we construct a new classifier PCA-1D LeNet-Ada (PLA) by using principal component extraction
                        method, Le-Net convolution network, and Adaptive Boosting method. PLA predicts three biomarkers for
                        breast cancer patients based on their somatic cell copy number variations and gene expression profiles.

       1 Introduction                                                         terms of breast cancer prediction, there is still a lack of
                                                                              network models that integrate multiple omics data to
       Determining the relationship between sequencing data                   predict the receptor status of different patients accurately.
       and cancer characterization is significant for clinical                Based on this, this article proposes a PLA model to
       decision-making and diagnosis and treatment. Breast                    explore the relationship between somatic cell copy
       cancer is the most common cause of death from cancer                   number variation, gene expression, and receptor status in
       in women worldwide [1]. Based on progesterone                          different individuals. We established the prediction
       receptor (PR), human epidermal growth factor receptor 2                model of breast cancer ER, PR, HER2 status.
       (HER2), and estrogen receptor (ER), breast cancer can
       be divided into four molecular subtypes: Luminal A
       (ER+, PR+, and HER2-), Luminal B (ER+, PR±, and                        2 MATERIALS AND METHODS
       Her2±), Her2-overexpression (ER-, PR- and HER2+)
       and triple-negative (ER-, PR- and HER2-) [2, 3]. Among                 2.1 Data set and data preprocessing
       them, the prognostic effect of Luminal A and Luminal B
       subtypes is relatively good, while the prognostic effect               This article selects Breast Cancer (METABRIC, Nature
       of triple-negative and HER2-(HER2 enriched) tumors is                  2012 & Nat Commun 2016) as the experimental data set.
       inferior [4-6]. Accurately predicting the status of ER, PR             The information of this data set is measured by Illumina
       and HER2 can provide excellent help for breast cancer                  Human v3 microarray. It can be downloaded from
       treatment and prognosis selection.                                     cBioPortal, an analysis tool for exploring large cancer
           In recent years, many scholars have combined deep                  genome data sets.
       learning with gene sequencing data for cancer analysis
       experiments. For example, Xiaofan Ding et al. tested the
       possible correlation between recurrent CNV in the
       genome and the huge risk of cancer [7], and Md.
       Mohaiminul Islam et al. established a prediction of
       breast cancer molecular subtypes based on changes in
       somatic copy number Deep learning model [8].
           At present, the main factors affecting the accuracy of
       cancer prognosis models are the high heterogeneity of
       biological data and the difficulty of achieving stable
       extraction based on existing data. On the problem of the
       1D signal, convolutional neural network has been proved
       to be effective. In 2015, Kiranyaz proposed an adaptive
       1D convolutional neural network (1D CNN) for patient-                     Fig. 1. The proportion of breast cancer types in the data set
       specific ECG data, which promoted the application of
       1D convolutional networks in the medical field [9]. In

         *   Corresponding author: mailto:tao666@qq.com

  © The Authors, published by EDP Sciences. This is an open access article distributed under the terms of the Creative Commons Attribution License 4.0
  (http://creativecommons.org/licenses/by/4.0/).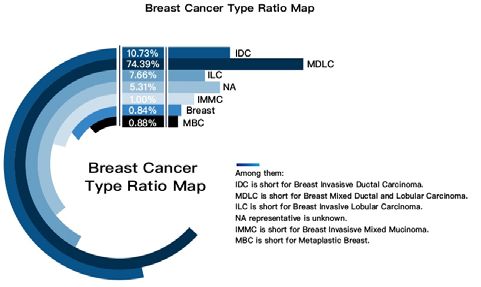
E3S Web of Conferences 185, 04028 (2020)                                                          http://doi.org/10.1051/e3sconf/202018504028
ICEEB 2020

           The data set contains 2509 patient samples, and the            that must be considered while pursuing prediction
       gene expression of each sample is composed of genome               accuracy. Combining the above reasons, we chose the
       profiles (somatic mutation [targeted sequencing], copy             LeNet-5 network to extract data features, which can
       number variation, and gene expression) and                         improve the calculation speed while predicting with high
       corresponding clinical data.                                       precision. In this paper, the constructed model for
           Figure 1 shows the proportion of breast cancer types           predicting clinical outcomes of breast cancer patients is
       in the data set. In this data set, invasive ductal carcinoma       named PCA-1DLenet. Among them, the dimensionality
       of the breast accounted for 74.3% of the total sample              reduction feature data obtained in the previous step is
       number, mixed ductal and lobular breast carcinoma                  used as the input of the classification network.
       accounted for 10.7% of the total sample number,                        The hierarchical structure of LeNet-5 includes three
       invasive lobular carcinoma of the breast accounted for             types: convolutional layer, pooling layer, and fully
       7.7% of the total sample number, and other subtypes of             connected layer. Among them, the convolutional layer
       breast cancer and Unlabeled breast cancer cases                    and the pooling layer perform feature extraction. The
       accounted for 7.3% of the total sample number.                     fully connected layer maps the extracted features to the
           Before constructing the predictive classification              final output to achieve the final classification.
       model, we performed a three-step preprocessing                         To limit the over-fitting of the network, we adopt the
       operation on the data set.                                         random Dropout method. Randomly reset part of the
           (1) Eliminate the separate components in the data set,         weight of the hidden layer to zero to adjust the
       and select Copy-number alterations from DNA copy                   dependency between nodes. At the same time, we use
       (CNV) (22545 gene information), gene expression data               the ReLU function as the activation function and the
       (24367 gene information), and in clinical data, ER Status,         cross-entropy function as the loss function. See Table 1
       PR Status, and HER2 Status are studied.                            for the parameter settings of the PLA model.
           (2) Eliminate samples with NaN values in the current
       data set                                                                      Table. 1. PLA model parameter table
           (3) Perform Z-Score standardization on the original                                      kernel     Sampling     kernel
       CNV data and RNA_Seq data to eliminate the difference               Layer     Input size
                                                                                                     size        area         type
       between dimensions.                                                Conv1       1×1059         5×5           -           10
           After data preprocessing operations, we got 1885               Pool1     1×1055×10          -          2×2           -
       available samples.                                                 Conv2      1×528×10        3×3           -           16
                                                                          Pool2      1×526×16          -          2×2           -
                                                                           Fc1         4208            -           -            -
       2.2 Data feature extraction method                                  Fc2          256            -           -            -
                                                                          Output        128            -           -            -
       2.2.1 Principal component analysis                                             Sample       Neurons      Sliding     Outpu
                                                                           Layer
                                                                                       type        Number        step        t size
       Principal component analysis (PCA) is a multivariate               Conv1          -         1×1055        1×1
                                                                                                                            1×1055
       technique that can significantly reduce the number of                                                                  ×10
       variables while still retaining most of the original                                                                  1×528
                                                                           Pool1        10          1×528        2×2
       information. PCA is often used for data dimensionality                                                                 ×10
       reduction, lossy data compression, feature extraction,                                                                1×526
                                                                          Conv2         16          1×526        1×1
                                                                                                                              ×16
       and data visualization [10].
                                                                                                                             1×263
                                                                           Pool2        16          1×263        2×2
                                                                                                                              ×16
       2.2.2. Deep Learning Model                                          Fc1           -            256           -          256
                                                                           Fc2           -            128           -         128
                                                                          Output         -             2            -           2
                                                                                     Trainable           Connections        Dropo
                                                                           Layer
                                                                                     parameter             Number               ut
                                                                          Conv1     (5×5+1)×10      (5×5+1)×10×1×1055           -
                                                                          Pool1        2×10          (2×2+1)×10×1×528           -
                                                                          Conv2     (3×3+1)×16       (3×3+1)×16×1×526           -
                                                                          Pool2        2×16          (2×2+1)×16×1×263           -
                                                                           Fc1         256+1            (256+1)×4208           0.5
                                                                           Fc2         128+1             (128+1)×256           0.5
        Fig. 2. Le-Net Model Framework under Marker Classification        Output        2+1               (2+1)×128             -

       Compared with previous shallow machine learning
       models,     convolutional     neural     networks    have
       unprecedented advantages in feature extraction,
       expression, and model fitting. For more complex tasks,
       such as segmentation of pathological images, deep and
       complex neural networks are often used. For numerical
       data tasks, calculation speed is also a performance index

                                                                      2
E3S Web of Conferences 185, 04028 (2020) http://doi.org/10.1051/e3sconf/202018504028
ICEEB 2020
2.2.3 AdaBoost method prediction result is corrected by calculating the training
error and updating the original weight. According to
multiple experimental tests, in the case of 10 iterations,
the overall prediction effect of the PCA model on the test
set data reaches the best level.
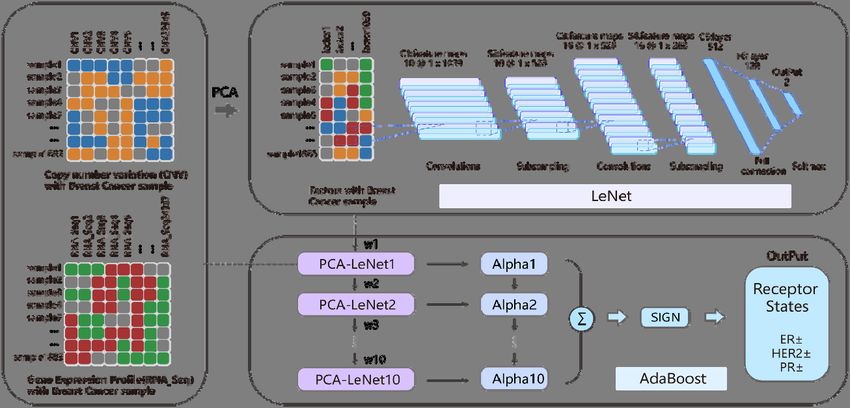
2.3 Biomarker prognostic model based on
principal component extraction and deep
Fig. 3. AdaBoost operation steps convolutional network-integrated learning
Adaptive Boosting is a machine learning method
proposed by Yoav Freund and Robert Schapire [11]. This research aims to combine principal component
The AdaBoost method is sensitive to noisy data and feature extraction methods with deep learning techniques
abnormal data. It is essentially an iterative algorithm, to learn more characteristic features from sequencing
adding a new weak classifier in each round until it data such as copy number variation and gene expression
reaches a sufficiently small error rate. For each training, and construct a more useful classification of breast
if a sample point has been accurately classified, then in cancer clinical outcome predictions.
the construction of the next training set, its probability of Based on PCA, LeNet-5 network, and Adaptive
being selected is reduced; on the contrary, if a sample Boosting method, we built a PLA classification model.
point is not accurately classified, then its weight is The overall structure of the PLA is shown in Figure 4.
obtained improve. In this way, the AdaBoost method First, the PCA dimensionality reduction method is used
can focus on samples that are more difficult to to reduce the dimensionality of the characteristics of
distinguish (more informative). copy number variation and gene expression data. Then,
In this paper, a new 1DLeNet weak classifier is use 1D LeNet deep convolutional network technology to
added in each iteration of AdaBoost, and the first build a classification system PCA-1DLeNet.
Fig. 4. PLA model implementation framework
Finally, this study uses 10 PCA-1DLeNets as weak in the original data set, for example, out of 1885 samples,
classifiers and uses Adaptive Boosting to build an 1653 samples were HER2 negative, and 232 samples
ensemble classifier. Through ensemble learning, it learns were HER2 positive. The Matthews correlation
the negative and positive classification features of three coefficient is widely used in this situation []. Therefore,
receptors of breast cancer, from dimensionality reduction this study uses accuracy (ACC), Matthews correlation
features. coefficient (MCC), and the verification deviation
correction area (AUC) under the ROC curve as the main
performance evaluation indicators for evaluating the
3 RESULT diagnosis. The calculation formula of MCC is as follows:
t t f f
3.1 Evaluation indicators MCC
(t f )(t f )(t f )(t f )
Due to the high imbalance in the distribution of the Among them, true positive is a true negative, false
number of patients with negative and positive receptors positive is a false negative, and the formulas for
3E3S Web of Conferences 185, 04028 (2020) http://doi.org/10.1051/e3sconf/202018504028
ICEEB 2020
accuracy rate ACC, specificity SP, and sensitivity SN are
as follows:
t t t t
ACC SP SN
t t f f t f t f
To avoid sampling bias and ensure the accuracy of
the conclusion, this paper uses 10-Fold cross-validation
to compare and analyze the results of breast cancer
receptor classification.
3.2 Comparison of experimental results
In this paper, 300 iterations of training are performed on
the data set. During the ER training process, as the
average cross-entropy loss of the training set continues
to decrease, its accuracy is continuously improved. At
the same time, the average cross-entropy loss of the test
set keeps the same trend as the accuracy rate and the
training set. When it occurs after 100 iterations, the
accuracy of the training set gradually converges, and the
accuracy of the test set stabilizes at about 92%.
HER2 and PR also showed better training conditions.
After HER2 iterated to 100 times, the accuracy of the
training set gradually converged to 1, and the accuracy
of the test set stabilized at about 90%. After the PR
iteration reaches 120 times, the accuracy of the training
set gradually converges, and the accuracy of the test set
stabilizes at about 75%. Fig. 5. Comparison of ACC and MCC of five models
The experimental results prove that the classifier we
built has a good effect on the training set and test set for It can be found that the accuracy of the PLA model in
the classification of ER, HER2, and PR. Among them, the ER and HER2 receptors is significantly higher than
the ACC scores of ER and HER2 are above 0.9, and the the other four different algorithms, which shows the
ACC of PR is above 0.7. And the specific SN sensitivity excellent classification performance of PLA. In terms of
SP of the model established for the three receptors is also MCC scores, compared to the other four algorithms, the
maintained at a high level. PLA model showed better predictability in three
different receptors. Among them, the highest value in ER
Table 2. PLA forecast results reaches 0.78, the value of HER2 reaches 0.45, and the
value of PR reaches 0.46. This also confirms the
ER HER2 PR
robustness of the PLA model's classification results
ACC 0.923 0.900 0.730
under unbalanced positive and negative samples.
MCC 0.783 0.452 0.456
AUC 0.884 0.727 0.681
SP 0.958 0.392 0.766 4 DISCUSSION
SN 0.810 0.970 0.688
To verify the effectiveness of the PLA model, we This paper compares the classification results with
compared the PLA model with four other mature traditional models, and the results show that the PLA
classification models (SVM, Dtree, KNN, Perceptron) model is better for molecular receptor classification.
[12-15] for the classification of the three receptors: ACC, There are two main reasons for this. First, the amount of
MCC, and AUC. data in the data set we use is more sufficient than
previous studies; second, the application of
convolutional networks to the field of clinical,
histological image recognition has shown better accuracy.
We extend this model to In terms of data analysis,
according to the evaluation test results, we have
achieved excellent results in the classification of breast
cancer molecular receptors.
However, due to the complex structure of the deep
learning model, it is still difficult to explore the features
that specifically affect the classification results. In the
future, we will consider using a newer and deeper
network as Backbone to experiment with the
classification effect.
4E3S Web of Conferences 185, 04028 (2020) http://doi.org/10.1051/e3sconf/202018504028
ICEEB 2020
5 CONCLUSION based prediction of molecular subtypes of breast
cancer using deep learning model," in Canadian
The purpose of this study is to use breast cancer gene Conference on Artificial Intelligence, 2017: Springer,
expression and copy number variation data to explore the pp. 57-63.
relationship between different molecular receptors. 9. S. Kiranyaz, T. Ince, R. Hamila, and M. Gabbouj,
Based on deep learning technology, we have established "Convolutional neural networks for patient-specific
the PLA breast cancer classification model and realized ECG classification," in 2015 37th Annual
the prediction of the molecular markers ER, PR, and International Conference of the IEEE Engineering
Her-2 of breast cancer. The classification accuracy rate in Medicine and Biology Society (EMBC), 2015:
of the model on the test set is reasonable, stable at about IEEE, pp. 2608-2611.
92%; among them, the positive prediction of ER, PR is
good, the classification accuracy of tumors with negative 10. I. Jolliffe, Principal component analysis. Springer,
ER, PR, and Her-2 or Her-2 is average; Besides, the 2011.
classification accuracy of ER, HER2, and PR receptors 11. Y. Freund, R. Schapire, and N. Abe, "A short
were 0.92, 0.90, and 0.73, respectively. introduction to boosting," Journal-Japanese Society
The main work of the article is on the construction of For Artificial Intelligence, vol. 14, no. 771-780, p.
the overall prediction model. In the follow-up, we will 1612, 1999.
further integrate the classification results of ER, PR, and 12. M. G. Best et al., "RNA-Seq of tumor-educated
HER2 receptors to achieve high-precision prediction of platelets enables blood-based pan-cancer, multiclass,
molecular subtypes. Our PLA model can be extended to and molecular pathway cancer diagnostics," Cancer
the patient data of various common cancers. The cell, vol. 28, no. 5, pp. 666-676, 2015.
establishment of this type of model will play a key role 13. N. M. Crabtree, J. H. Moore, J. F. Bowyer, and N. I.
in cancer treatment and prognostic selection. George, "Multi-class computational evolution:
development, benchmark evaluation and application
References to RNA-Seq biomarker discovery," BioData mining,
vol. 10, no. 1, p. 13, 2017.
1. T. J. Key, P. K. Verkasalo, and E. Banks, 14. T. Nguyen, S. Nahavandi, D. Creighton, and A.
"Epidemiology of breast cancer," The lancet Khosravi, "RNA-seq data analysis using
oncology, vol. 2, no. 3, pp. 133-140, 2001. nonparametric Gaussian process models," in 2016
2. L. A. Carey et al., "Race, breast cancer subtypes, and International Joint Conference on Neural Networks
survival in the Carolina Breast Cancer Study," Jama, (IJCNN), 2016: IEEE, pp. 5087-5093.
vol. 295, no. 21, pp. 2492-2502, 2006. 15. P. H. Williams, R. Eyles, and G. Weiller, "Plant
3. K. M. O'Brien et al., "Intrinsic breast tumor subtypes, microRNA prediction by supervised machine
race, and long-term survival in the Carolina Breast learning using C5. 0 decision trees," Journal of
Cancer Study," Clinical Cancer Research, vol. 16, nucleic acids, vol. 2012, 2012.
no. 24, pp. 6100-6110, 2010.
4. K. R. Bauer, M. Brown, R. D. Cress, C. A. Parise,
and V. Caggiano, "Descriptive analysis of estrogen
receptor (ER)‐negative, progesterone receptor
(PR)‐negative, and HER2‐negative invasive breast
cancer, the so‐called triple‐negative phenotype: a
population‐based study from the California cancer
Registry," cancer, vol. 109, no. 9, pp. 1721-1728,
2007.
5. R. Haque et al., "Impact of breast cancer subtypes
and treatment on survival: an analysis spanning two
decades," Cancer Epidemiology and Prevention
Biomarkers, vol. 21, no. 10, pp. 1848-1855, 2012.
6. S. A. Joslyn, D. H. Gesme Jr, and C. F. Lynch,
"Estrogen and progesterone receptors in primary
breast cancer," The Breast Journal, vol. 2, no. 3, pp.
187-196, 1996.
7. X. Ding, S.-Y. Tsang, S.-K. Ng, and H. Xue,
"Application of machine learning to development of
copy number variation-based prediction of cancer
risk," Genomics insights, vol. 7, p. GEI. S15002,
2014.
8. M. M. Islam, R. Ajwad, C. Chi, M. Domaratzki, Y.
Wang, and P. Hu, "Somatic copy number alteration-
5You can also read