KEY FINDINGS-WEEK OF MAY 25TH, 2020

Page created by Edwin Peters
 
CONTINUE READING
KEY FINDINGS-WEEK OF MAY 25TH, 2020
KEY FINDINGS—WEEK OF MAY   25 , 2020
                             TH
KEY FINDINGS-WEEK OF MAY 25TH, 2020
About Destination Analysts

Destination Analysts is a market research company that offers businesses a breadth of insights,
from the comprehensive understanding of target audiences and customer profile development,
to ROI analysis and economic forecasts.

Clients seek us out for unique and more deeply thoughtful analysis, our actionable storytelling
of data, high quality and defensible findings, and progressive and open approach to research
methodologies.

In addition to this report, Destination Analysts conducts The State of the American Traveler and
 The State of the International Traveler—the travel industry’s premier studies for tracking traveler
 sentiment and global destination brand performance—as well as The CVB and the Future of the
 Meetings Industry annual study helping destination marketing organizations transform their
 meetings sales and services strategies.
KEY FINDINGS-WEEK OF MAY 25TH, 2020
IMPORTANT
The data and findings presented here are from our independent research, which is
unique in that it is not sponsored, conducted nor influenced by any advertising or
marketing agency. This means that you can trust that it is not serving any agenda
other than to provide you reliable information upon which to base decisions for
your organization’s or tourism community’s future.
KEY FINDINGS-WEEK OF MAY 25TH, 2020
Please consider purchasing, subscribing or donating to support this research
https://destination-analysts-coronavirus-travel-sentiment-index-report.square.site/

                           THANK YOU IN ADVANCE
KEY FINDINGS-WEEK OF MAY 25TH, 2020
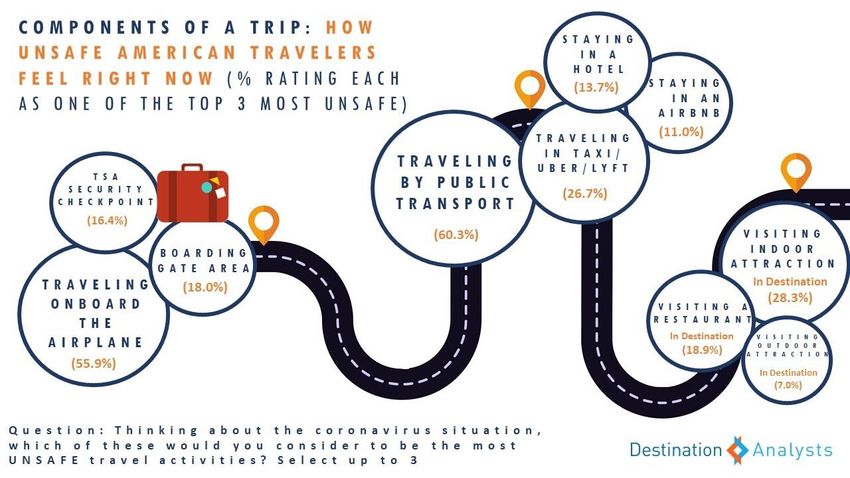
Key Findings for the Week of May           25 th

Please cite Destination Analysts when using or distributing this data
KEY FINDINGS-WEEK OF MAY 25TH, 2020
Personal Health Concerns & Concerns About Family & Friends
  American travelers continue their slow march towards feeling safer. This week brought another improvement in their concerns about
  personally contracting the virus (6.6/10) and their friends or family contracting it (7.0/10, an 11-week low).

                             Average Level of Concern About                                                                             Average Level of Concern About
                            Personally Contracting Coronavirus                                                                      Family & Friends Contracting Coronavirus
              (on an 10-point scale from “Not at all concerned” to “Extremely concerned”)                               (on an 10-point scale from “Not at all concerned” to “Extremely concerned”)
10.0                                                                                                      10.0

 8.0                                                                                                       8.0

 6.0                                                                                                       6.0

 4.0                                                                                                       4.0                7.5              7.6      7.6      7.4
                    6.9      7.0     6.9      7.0      6.9                                                                             7.6                                7.4      7.2     7.2      7.2      7.0
           6.2                                                 6.7      6.6      6.7      6.7     6.6                6.8

 2.0                                                                                                       2.0

 0.0                                                                                                       0.0
          March March March April 3- April            April    April May 1-3 May 8- May 15- May 22-                 March March March April 3- April            April   April May 1-3 May 8- May 15- May 22-
          13-15 20-22 27-29   5      10-12            17-19    24-26          10      17      24                    13-15 20-22 27-29   5      10-12            17-19   24-26          10      17      24

       Question: Thinking about the current coronavirus situation, in general, HOW CONCERNED                 Question: Thinking about the current coronavirus situation, in general, how concerned are you
       ARE YOU PERSONALLY about contracting the virus? (Please answer using the scale below)                 about your FRIENDS OR FAMILY contracting the virus? (Please answer using the scale below)

       (Base: All respondents, 1,201, 1,200, 1,201, 1,216, 1,263, 1,238, 1,208, 1,204, 1,200, 1,212 and          (Base: All respondents, 1,201, 1,200, 1,201, 1,216, 1,263, 1,238, 1,208, 1,204, 1,200, 1,212 and
       1,223 completed surveys. Data collected March 13-15, 20-22, 27-29, April 3-5, 10-12, 17-19, 24-           1,223 completed surveys. Data collected March 13-15, 20-22, 27-29, April 3-5, 10-12, 17-19, 24-
       26, May 1-3, 8-10, 15-17 and 22-24, 2020)                                                                 26, May 1-3, 8-10, 15-17 and 22-24, 2020)

                                                                                                                                                                                                                    Page 6
Concerns About Personal Finances & National Economy
There are also improvements in concerns the impact the virus has on personal finances (6.4/10—near the level it was the week of
March 15) and its impact on the national economy (7.8/10, the lowest its been since March 15).

              Average Level of Concern About Personal Finances                                                       Average Level of Concern About National Economy
           (on an 10-point scale from “Not at all concerned” to “Extremely concerned”)                             (on an 10-point scale from “Not at all concerned” to “Extremely concerned”)
10.0                                                                                                 10.0

 8.0                                                                                                  8.0

 6.0                                                                                                  6.0

 4.0                                                                                                  4.0              8.3      8.0     8.2      8.1      8.1               8.0
                 7.0              7.0      7.0                                                               7.6                                                   8.1               7.9      7.9         7.8
        6.3               6.8                       6.6     6.8      6.6      6.5      6.5     6.4

 2.0                                                                                                  2.0

 0.0
                                                                                                      0.0
       March March March April 3- April           April    April May 1-3 May 8- May 15- May 22-
                                                                                                            March     March   March April 3-5April 10-April 17-April 24- May 1-3 May 8- May 15- May 22-
       13-15 20-22 27-29   5      10-12           17-19    24-26          10      17      24
                                                                                                            13-15     20-22   27-29            12       19       26               10      17      24
  Question: Thinking about the current coronavirus situation, how concerned are you about the          Question: Thinking about the current coronavirus situation, how concerned are you about the
  impact it may have on your PERSONAL FINANCES? (Please answer using the scale below)                  impact it may have on the NATIONAL ECONOMY? (Please answer using the scale below)

  (Base: All respondents, 1,201, 1,200, 1,201, 1,216, 1,263, 1,238, 1,208, 1,204, 1,200, 1,212 and     (Base: All respondents, 1,201, 1,200, 1,201, 1,216, 1,263, 1,238, 1,208, 1,204, 1,200, 1,212 and
  1,223 completed surveys. Data collected March 13-15, 20-22, 27-29, April 3-5, 10-12, 17-19, 24-      1,223 completed surveys. Data collected March 13-15, 20-22, 27-29, April 3-5, 10-12, 17-19, 24-
  26, May 1-3, 8-10, 15-17 and 22-24, 2020)                                                            26, May 1-3, 8-10, 15-17 and 22-24, 2020)

                                                                                                                                                                                                          Page 7
Perceived Safety of Travel Activities

                                                                            Perceived Safety of Travel Activities
                                                                                 (% saying each is “Safe” or “Very safe”)
Perceptions of the safety of     80%

various travel activities are
                                 60%
nearing what was recorded the
week of March 15th when we       40%

began this measurement (and
                                 20%
before the most dramatic drop
in safety perceptions, which      0%

occurred between March 15
and 22nd).

                                                                                    March 13-15        April 17-19       May 22-24

                                Question: At this moment, how safe would you feel doing each type of travel activity?

                                (Base: Waves 1, 6 and 11. 1,201, 1,238 and 1,223 completed surveys. Data collected March 13-15, April 17-19 and May 22-24, 2020)

                                                                                                                                                                   Page 8
Avoiding Travel Until the Crisis Blows Over
                                                                                    Americans Who Will Avoid All Travel
                                                                                   Until the Coronavirus Situation is Over

The proportion agreeing they        100%

are going to avoid all travel
                                     80%
until the coronavirus situation
is blown over in their mind is
                                     60%                                   50.1%
                                                              47.6%                     53.3%        52.2%         44.0%
also near the level it was                                                                                                      41.3%
                                                                                                                                             29.9%         32.1%        30.3%
                                                31.3%                                                                                                                                 31.2%
March 15th (61.1%).                  40%

                                     20%
                                                29.8%        30.5%         32.7%                                   33.8%         32.6%        35.1%        32.6%        31.8%         30.8%
                                                                                        28.7%        29.7%

                                       0%
                                             March 13-15 March 20-22 March 27-29       April 3-5   April 10-12 April 17-19 April 24-26       May 1-3      May 8-10    May 15-17     May 22-24

                                                                                                     Agree       Strongly agree

                                  Question: How much do you agree with the following statement?
                                  Statement: I’m planning to avoid all travel until the Coronavirus situation blows over.

                                  (Base: All respondents, 1,201, 1,200, 1,201, 1,216, 1,263, 1,238, 1,208, 1,204, 1,200, 1,212 and 1,223 completed surveys. Data collected March 13-15, 20-22, 27-
                                  29, April 3-5, 10-12, 17-19, 24-26, May 1-3, 8-10, 15-17 and 22-24, 2020)

                                                                                                                                                                                                Page 9
Expectations for the Coronavirus Situation

Opinion that the coronavirus
situation will get better in the
U.S. in the next month again
increased from the dip seen the
week of May 8th (32.3%).

                                             Page 10
Staycations and Avoiding International Travel
In addition to the significant drops in expected trip volume and spending on travel, this week the percent saying they will take a
staycation rather than a vacation this summer (57.6%) and the percent saying they are going to wait until 2021 to travel again (32.6%)
both reached a high.
               Americans Who Will Probably Take a Staycation This Summer                                                            Americans Who Have No Plans to Travel in 2020
                                 Instead of a Vacation
100%                                                                                                      100%

80%                                                                                                       80%

60%                                                                                             57.6%     60%
                                  52.8%    55.2%                               55.0%   54.1%
                         49.2%                      51.3% 49.3%       51.0%
                47.3%
       41.3%
40%                                                                                                       40%
                                                                                                                                                                                                       29.9% 32.6%
                                                                                                                                                                                             24.6%
                                                                                                                            21.7%    20.0%    23.2%     21.0%    20.5%    22.5%     21.8%
20%                                                                                                       20%      17.4%

 0%                                                                                                        0%
       March    March    March April 3-5 April 10- April 17- April 24- May 1-3 May 8-10 May 15- May 22-          March 13-March 20-March 27- April 3-5 April 10- April 17- April 24- May 1-3 May 8-10 May 15- May 22-
       13-15    20-22    27-29             12        19        26                         17      24                15       22       29                 12        19        26                         17      24

Question: How much do you agree with the following statement?                                                    Question: Even if only tentatively scheduled, in which months of this year do you
Statement: Because of the Coronavirus, I’ll probably take a staycation(s) this summer rather                     currently plan to take any leisure trips? (Select all that apply)
than a vacation(s).

(Base: All respondents, 1,201, 1,200, 1,201, 1,216, 1,263, 1,238, 1,208, 1,204, 1,200, 1,212 and 1,223           (Base: All respondents, 1,201, 1,200, 1,201, 1,216, 1,263, 1,238, 1,208, 1,204, 1,200, 1,212 and 1,223
completed surveys. Data collected March 13-15, 20-22, 27-29, April 3-5, 10-12, 17-19, 24-26, May 1-3,            completed surveys. Data collected March 13-15, 20-22, 27-29, April 3-5, 10-12, 17-19, 24-26, May 1-3,
8-10, 15-17 and 22-24, 2020)                                                                                     8-10, 15-17 and 22-24, 2020)

                                                                                                                                                                                                                Page 11
Safety Traveling By Commercial Airline

Health and safety remain central to                                         Air Travelers’ Perceived Level of Safety
                                         60%
this measured outlook and behaviors
toward travel, and this is profoundly
seen in current perceptions of air
travel. Over one-third of airline        40%
                                                                                                                                                           36.0%
                                                                                                                                       34.2%
travelers still characterize traveling
                                                                                                                                               28.7%
onboard an airplane as “very unsafe”                                                                            26.0%            26.2%
                                                                                                           23.7%
(and another quarter say it is                                                                                                                                           20.6%
                                                                                                                                                                    20.5%
                                         20%                                                         17.2%
                                                                              16.0% 16.1%
“somewhat unsafe”).                                                       13.3%
                                               7.3%          8.6%
                                                      5.5%

                                         0%
                                                  Very safe               Somewhat safe              Neither safe nor           Somewhat unsafe                Very unsafe
                                                                                                          unsafe
                                                             Traveling onboard the airplane       Boarding gate/waiting area       TSA security checkpoints

                                               Question: Imagine you are taking a trip in the United States, and you will travel by commercial airline. Using the
                                               scale below, please tell us how safe you would generally consider each of the following right now.

                                               (Base: Wave 11 air travelers. 758 completed surveys. Data collected May 22-24, 2020)
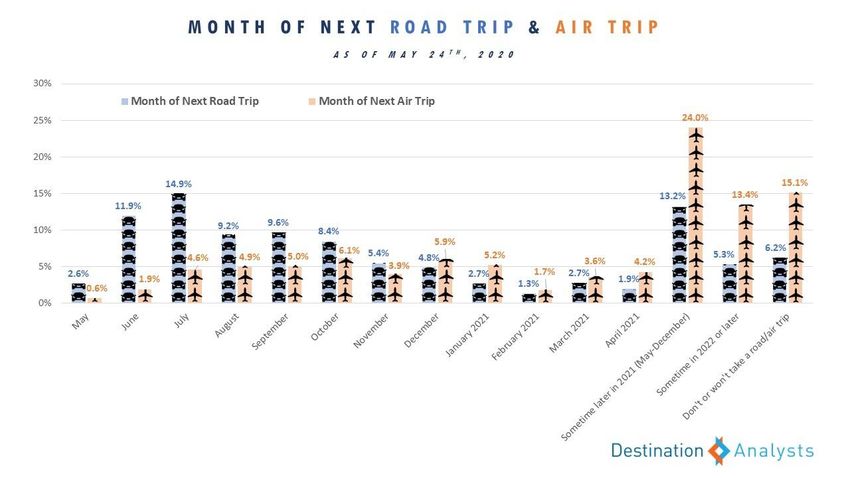
                                                                                                                                                                                 Page 12
Air and Road Trip Plans

While they show lesser concerns
about the boarding gate/waiting
areas and TSA security
checkpoints, many Americans
are looking to put off their next
air trip until 2021 or later.

Question: In what month do you expect you will take your
NEXT TRIP on a commercial airline?

Question: In what month do you expect you will take your
NEXT ROAD TRIP (Traveling in a personal automobile)?

(Base: Wave 11. 1,223 completed surveys. Data collected May
22-24, 2020)

                                                              Page 13
Travel Activities Considered the Most Unsafe
It’s imperative to the industry’s recovery
that travelers feel they will be safe in every
aspect of their journey, and certainly travel
industry related businesses are working
hard to ensure this is a reality. To examine
where the strongest points of resistance
may be and/or which experiences may need
more safety guidelines communicated, we
asked travelers to rate what they feel are
the TOP THREE most unsafe components of
a common travel experience. Right now,
taking public transportation, traveling
onboard the airplane, visiting indoor
attractions in their trip destination, and
traveling in taxis/Ubers/Lyfts are most
agreed upon as the least safe aspects of a
potential trip.

Question: Thinking about the Coronavirus situation,
which of these would you consider to be the most unsafe
travel activities? YOU MAY SELECT AS MANY AS THREE (3)

(Base: Wave 11. 1,223 completed surveys. Data collected May
22-24, 2020)

                                                              Page 14
Perceived Safety of Staying in Lodging

Although lodging was not as commonly chosen as                                           Perceived Safety of Staying in Lodging
                                                                                          (% saying each is “somewhat safe” or “very safe”)
the least safe aspect of a typical trip, it is
important to understand the degree to which            40%
travelers are feeling they will be safe at
Airbnbs/vacation home rentals (often perceived
as easier to socially distance but without the         30%                              27.6%

formalized levels of housekeeping/sanitation)
                                                                                                                                                  21.3%
and hotels (often perceived as being more              20%
difficult to avoid other travelers but with the
ability to enact strict sanitation protocols).
Staying in a hotel is currently perceived as safe by   10%
27.6% of American travelers and staying in an
Airbnb/vacation home rental by 21.3%. Note that
                                                       0%
younger travelers are much more trusting of                                       Staying in a hotel                                Staying in an Airbnb or home rental
Airbnb/vacation home rental safety compared to
older travelers.
                                                       Question: At this moment, how safe would you feel doing each type of travel activity?

                                                       (Base: Wave 11. 1,223 completed surveys. Data collected May 22-24, 2020)

                                                                                                                                                                          Page 15
Memorial Day Weekend Trip
With Memorial Day weekend traditionally considered the (un)official start of the summer travel season--and now the first national holiday celebrated
during the COVID-19 pandemic, with all 50 states under loosened restrictions, this made for an interesting study. Did Americans, in fact, travel? As of the
morning of May 24th—the Sunday of Memorial Day weekend 2020—just 5.9% of American travelers reported they were taking a trip this holiday. Of those
that went on a trip, 42.7% made the decision to take it within the last week. Similarly, a recent Harris Poll conducted about Memorial Day travel plans found
that 95% of the American population believed it was too soon to travel. In addition, AAA declined to put out its annual Memorial Day travel estimate citing
COVID-19’s impact on the accuracy of their data, but expected it to be a record low in their two decades of this forecast.

       Americans Who Took a Trip Memorial Day Weekend                                              When Memorial Day Weekend Trip Was Decided
                                                                                                          (% of Americans who took a trip)

                                Yes, 5.9%
                                                                                               Before May
                                                                                                                                                      In the past
                                                                                               1st, 23.7%
                                                                                                                                                      week, 42.7%

                                                                                                    Earlier this
                                                                                                    May, 33.7%
                      No, 94.1%

 Question: Are you taking a trip the Memorial Day weekend?                            Question: When did you decide to take this trip? (Select one)

 (Base: Wave 11. 1,223 completed surveys. Data collected May 22-24, 2020)             (Base: Wave 11 respondents taking a Memorial Day weekend trip. 74 completed surveys.
                                                                                      Data collected May 22-24, 2020)

                                                                                                                                                                             Page 16
Interest in Traveling Due to Discounts

                                                                             Interest in Traveling Due to Discounts—by Generation
                                                                     (% who “agree” or “strongly agree” that discounts make them more interested in traveling”
Younger travelers will very likely    60%

be key to many destinations’
and travel providers’ recovery.                                                                                                                                                     45.6%
                                                44.1%
                                            42.8%                                                         42.1%
Last week we reported that                                 40.8%           39.5%          40.5%                           40.5%         40.1%
                                      40%                                      38.1%                                                                    38.8%      38.4%
                                                                                                                               35.8%                                                                37.4%
Millennial travelers will be at the                           35.7%
                                                                                             33.3%                           34.7%        34.4%            34.3%            33.1%
                                                                                                                                                               33.4%     32.7%
                                                                                                               31.3%                            29.7%
forefront of the industry’s                        29.9%                                                                                                                              29.4%           29.4%29.4%
                                                                                                  27.1%
                                                                                                                  25.3%
recovery, due to their relatively                                                21.5%                                                                                                      22.9%
                                                                   19.6%
higher sense of safety for            20%

themselves and travel activities,
combined with the ability to
motivate them to travel with          0%
                                            March 13-15 March 20-22 March 27-29           April 3-5       April 10-12     April 17-19   April 24-26      May 1-3       May 8-10     May 15-17       May 22-24
discounts—things that we
continue to see this week.                                                             Millennial or younger              Gen X          Baby Boomer or older

                                            Question: How much do you agree with the following statement?
                                            Statement: The Coronavirus has led many travel providers to cut their prices. These discounts and price cuts (airline, hotel, etc.) make me more
                                            interested in traveling in the NEXT THREE (3) MONTHS.

                                            (Base: All respondents, 1,201, 1,200, 1,201, 1,216, 1,263, 1,238, 1,208, 1,204, 1,200, 1,212 and 1,223 completed surveys. Data collected March
                                            13-15, 20-22, 27-29, April 3-5, 10-12, 17-19, 24-26, May 1-3, 8-10, 15-17 and 22-24, 2020)

                                                                                                                                                                                                            Page 17
Spending Priorities for Leisure Travel

Nearly 40 percent of                                             Spending Priorities for Leisure Travel—by Generation
                                 40%
Millennial travelers report
they will make travel at least
a somewhat high priority in      30%                                                                       28.5%      27.9%
their lifestyle—double the                                                                                        24.2%                                                  24.5%

number of Baby Boomers
                                 20%                                                                                                 18.8%
                                                                                                                                             18.3%                           17.6%
who said the same—and plan                                                             17.7%                                                                 16.0%

to spend $3,000 on leisure                                                                 13.1%11.9%
                                                                                                                                                          11.5%
                                                                                                                                                                     12.4%
                                          10.3%                                                                                  10.9%               10.3%
travel in the next three         10%                            9.9%
                                                                       5.5%5.1%
months--$1,000 more than                          2.3% 3.1%
Baby Boomers report. They        0%
                                          Extremely high        High priority         Somewhat high       Neutral - neither      Somewhat low         Low priority   Extremely low
also plan to visit a more                    priority                                    priority       high nor low priority       priority                            priority
diverse set of destinations in
the next year.
                                                                                Millennial or younger       Gen X             Baby Boomer or older

                                       Question: Thinking carefully about how you expect to spend your income in the NEXT 12 MONTHS, please use the scale below to describe your
                                       spending priorities in next year.
                                       Leisure travel will be a...

                                       (Base: Wave 11. 1,223 completed surveys. Data collected May 22-24, 2020)

                                                                                                                                                                                     Page 18
Coronavirus Travel Sentiment Index
Measuring the Potential Influence of Travel Marketing
Highlights from the Week of May 25th
Indexing is the practice of compiling data into
             one single metric.

What is a    A predictive index is a statistical measure of
             change in a representative group of data points.
Predictive   The predictive index is then compared to a
             standard base value in order to make data-
Index?       driven predictions.

             The goals are to identify:
             • WHO are the traveler segments that appear
             receptive to travel marketing and
             • WHEN will they be ready to travel
Predictive Index Formula
           Concern for            Openness to
         Personal Health           Messaging

           Concern for            Excitement to
        Personal Finances          Travel Now

   *Normalized to a 100pt scale
Healthy Travel Outlook

                                 Neutral
70.0%
                                       Waiting to
        Not Ready to Travel                             Ready to Travel
                                        Travel
60.0%

50.0%

40.0%

30.0%

20.0%

10.0%

 0.0%
         0              1 - 25            26 - 50   51 - 75          76 - 100
                                      High Travel
Travel Outlook: Week of May 25th
                                     Neutral

70.0%                                        Waiting to
        Not Ready to Travel                                             Ready to Travel
                                              Travel
60.0%

50.0%

40.0%

30.0%

20.0%

10.0%

 0.0%
         0                  1 - 25              26 - 50             51 - 75                 76 - 100
        March 13-15   March 20-22    March 27-29 April 3-5    April 10-12     April 17-19
        April 24-26   May 1-3        May 8-10     May 15-17   May 22-24
Points of Interest:
         •   Women continue to report higher levels of safety and financial concerns

Gender
             than Men this week, though concerns for both groups show slight drops.
         •   A third of women this week again said they have no plans to travel in 2020
             (35.2% up from 33.2%) while only a quarter of men (28.8% up from 26.0%)
             said the same.

25.0

20.0

15.0

10.0                                                                      Female
                                                                          Male

 5.0

 0.0
Points of Interest:
             •   While Millennials and Boomers reported concern levels similar to
                 previous waves, this week Gen X showed a slight drop in safety concerns.

Generation   •   Contrasting from previous weeks, Gen X and Boomers rather than
                 Millennials this week show the most optimism for the severity of the
                 coronavirus situation.

25.0

20.0

15.0

                                                             Millennials or younger
10.0                                                         Gen X
                                                             Boomer or older

 5.0

 0.0
Points of Interest:
            •   Safety concerns in the West grew again this week while similar concerns
                dropped in the South.

US Region   •   Financial concerns grew in the West and Midwest and dropped in the Northeast
                and South.
            •   The South reported their biggest drop this week in openness to travel
                messaging, but even still remains more open than the Midwest and Northeast.

25.0

20.0

15.0
                                                                             WEST
10.0                                                                         MIDWEST
                                                                             NORTHEAST
                                                                             SOUTH
 5.0

 0.0
Points of Interest Impacting Index Scores:
                    •   Urban respondents returned to being the most concerned with

Type Of Residence
                        both personal safety and financial wellbeing this week.
                    •   Even with the highest concerns, Urban respondents reported
                        being the most excited to travel and are tied with Rural
                        respondents for the most open to messaging.

25.0

20.0

15.0

                                                              Suburban area
10.0                                                          Large city (urban area)
                                                              Rural area

 5.0

 0.0
Points of Interest:
Favorite      •   Travelers who love National Parks reported the lowest comparative levels of
                  safety concerns this week.

Destination   •   National Park travelers also show the most optimism this week that the
                  Coronavirus situation will improve.

Types         •   Beach travelers followed by National Park travelers report being likely to
                  travel the furthest on their next road trip.

 25.0

 20.0

 15.0

                                                           City Travelers
 10.0                                                      Beach Travelers
                                                           US National Parks Travelers

  5.0

  0.0
Benchmarking Traveler Sentiment
Destination Analysts’ The State of the American Traveler Study—begun in 2006—tracks
traveler sentiment each quarter—most recently in January 2020. In this week’s
Coronavirus Travel Sentiment Index study, we asked several identical questions to our
The State of the American Traveler Study in order to benchmark how travelers feel now
compared to in the past. These are presented following.
Leisure Travel Expectations (Trips Taken)
The proportion of leisure travelers who report that they will decrease the number of trips they will take, compared to the past 12
months, has skyrocketed in the past 4 months. Now, nearly half (44.7%) say they will travel less this year. In January, this figure stood at
8.7 percent.

                                                                                                           I expect to travel
Question: In the next 12 months, do                                                                         more for leisure
you expect to travel more or less for                                                                           14.1%
leisure than you did in the most
recent 12-month period? (Select
one)                                         I expect to travel
                                               less for leisure
(Base: Wave 11. 1,223 completed surveys.            44.7%
Data collected May 22-24, 2020)

                                                                                                          I expect to travel
                                                                                                           about the same
                                                                                                              for leisure
                                                                                                                41.2%

                                                                                                                                           Page 30
Historical Perspective: Leisure Travel Expectations (Trips Taken)
Prior to this week, the highest recorded percentage of American travelers to say they would be taking LESS leisure trips in the coming
year compared to the previous year was in July 2008, as the Great Recession loomed.

Question: In the next 12 months, do you expect to travel more or less for leisure than you did in the most recent 12-month period?

 100%

                                            I expect to travel more for leisure                 I expect to travel about the same for leisure                   I expect to travel less for leisure
 80%
                    Great
                   Recession
 60%

                                                                                                                                                                                                      44.7%
 40%
                     28.8%

 20%

                                                                                                                                                                                             8.7%
  0%

                  (Base: Wave 11. 1,223 completed surveys. Data collected May 22-24, 2020) Source for historical data, The State of the American Traveler, Destination Analysts, Inc.
                                                                                                                                                                                                         Page 31
Leisure Travel Expectations (Spending)

The percent of leisure travelers who reports that they will decrease their travel spending this year compared to the past 12 months
has also grown sharply. Now, 46.6 percent say they will reduce their travel spending. In January, this figure stood at 10.7 percent.

                                                                                                        I expect to spend
                                                                                                         more on leisure
Question: In the next 12 months, do                                                                           travel
you expect to spend more or less for                                                                          12.4%
leisure travel than you did in the
most recent 12-month period?
(Select one)
                                             I expect to spend
                                           less on leisure travel
(Base: Wave 11. 1,223 completed surveys.           46.6%
Data collected May 22-24, 2020)

                                                                                                         I expect to spend
                                                                                                        about the same on
                                                                                                            leisure travel
                                                                                                                41.0%

                                                                                                                                       Page 32
Historical Perspective: Leisure Travel Expectations (Spending)
 Prior to this week, the highest recorded percentage of American travelers to say they would be spending LESS on leisure trips in the
 coming year compared to the previous year was 28.8 percent, during the Great Recession.

 Question: In the next 12 months, do you expect to travel more or less for leisure than you did in the most recent 12-month period?
 100%
                 I expect to spend more on leisure travel                 I expect to spend about the same on leisure travel                      I expect to spend less on leisure travel
  80%                 Great
                     Recession
  60%
                                                                                                                                                                                             46.6%
  40%
                            28.8%

  20%
                                                                                                                                                                                         10.7%
   0%

                   (Base: Wave 11. 1,223 completed surveys. Data collected May 22-24, 2020) Source for historical data, The State of the American Traveler, Destination Analysts, Inc.
                                                                                                                                                                                                 Page 33
Leisure Travel as a Budget Priority
Four months ago, 59.6 percent of travelers said that leisure travel would be at least somewhat of a budget priority in the coming
year. Now, only 26.9 percent agrees. For perspective, back in January 2018, 65.3 percent said they would prioritize leisure travel in
their spending (shown on the following page).
                                                                                              Extremely high
Question: Thinking carefully about                               Extremely low                    priority
                                                                    priority                       5.6%
how you expect to spend your                                         17.4%
income in the NEXT 12 MONTHS,                                                                         High priority
                                                                                                         7.0%
please use the scale below to
describe your spending priorities in
next year.
                                                       Low Priority
                                                                                                               Somewhat high
                                                         12.8%
                                                                                                                  priority
(Base: Wave 11. 1,223 completed surveys.                                                                          14.4%
Data collected May 22-24, 2020)

                                                        Somewhat low                                   Neutral - neither
                                                           priority                                     high nor low
                                                           15.7%                                           priority
                                                                                                           27.2%

                                                                                                                                        Page 34
Historical Perspective: Leisure Travel as a Budget Priority

                                                                                Somewhat high priority                High priority           Extremely high priority
Question: Thinking carefully
about how you expect to
spend your income in the                                   100%
NEXT 12 MONTHS, please use
the scale below to describe
your spending priorities in the                             80%
next year.                                                                 65.3%                  62.0%
                                                                                                                        58.9%                  59.6%
                                                            60%             11.8%
                                                                                                   12.5%                                        11.9%
                                                                                                                         13.6%

                                                            40%             23.0%
                                                                                                   21.9%                                        19.0%
                                                                                                                         20.2%
                                                                                                                                                                      26.9%
                                                                                                                                                                       5.6%
                                                            20%                                                                                                        7.0%
                                                                            30.5%                  27.6%                 25.1%                  28.7%
                                                                                                                                                                      14.4%
                                                              0%
                                                                        Winter 2018            Spring 2018             Fall 2018            Winter 2019             This week

        (Base: Wave 11. 1,223 completed surveys. Data collected May 22-24, 2020) Source for historical data, The State of the American Traveler, Destination Analysts, Inc.

                                                                                                                                                                                Page 35
Expected Leisure Travel Spending (Next 12 Months)
Right now, the typical American traveler expects to spend $2,361 in the next 12 months on leisure travel, down 35 percent from
January when the result was $3,649. In total, 44.3 percent say they are going to spend less than $500 on leisure travel this year—a 5-
year high—and just 14.6 percent say they will spend more than $4,000—a 5-year low (shown on next page).

Question: How much IN TOTAL is the
                                                  Over $4000                                14.6%
maximum you will spend on leisure
travel (including airfare,                      $3501 - $4000          2.9%                                    Average = $2,361
accommodations and all other trip
related spending) during the NEXT               $3001 - $3500        0.9%
TWELVE (12) MONTHS?
                                                $2501 - $3000               5.1%

(Base: Wave 11. 1,223 completed surveys.        $2001 - $2500          2.9%
Data collected May 22-24, 2020)

                                                $1501 - $2000                       9.6%

                                                $1001 - $1500                5.8%

                                                 $501 - $1000                              14.0%

                                                    $0 - $500                                                                      44.3%

                                                                0%      5%         10%     15%     20%   25%    30%   35%   40%   45%      50%

                                                                                                                                                 Page 36
Expected Leisure Travel Spending (Next 12 Months)

Question: How much IN TOTAL is the maximum you will spend on leisure travel (including airfare, accommodations and all other
trip related spending) during the NEXT TWELVE (12) MONTHS?

            Average Expected Spending                                                              % in the Highest/Lowest Spending Categories

$4,000                                                                                 100%
                                                                                                                  Zero to $500                        Over $4000
                                                                  $3,649                 80%

                                                                                         60%
$3,000                                                                                                                                                                           44.3%
                                                                                         40%
                                                                                                                                                                    27.0%

                                                                      $2,361             20%
                                                                                                                                                                                 14.6%
                                                                                                                                                                      17.7%
$2,000                                                                                     0%

                  (Base: Wave 11. 1,223 completed surveys. Data collected May 22-24, 2020) Source for historical data, The State of the American Traveler, Destination Analysts, Inc.
                                                                                                                                                                                         Page 37
Leisure Travel by Destination Type (Intent to Visit, Next 12 Months)
Compared to January, more American travelers are planning to visit small towns, mountain and desert destinations, and National and
other parks. Fewer Americans plan to visit large cities, beach destinations and theme or amusement parks.

Question: In the next 12 months, HOW MANY TRIPS will you take that will include each of the following types of leisure destinations?

70%
         62.8%                                                                                              January 2020              This week
60%                                                         56.4%
                   49.9%                     50.2%                    48.8%
50%                                47.6%
                                                                                                                                                                                             43.8%
40%                                                                                           35.2%                                    35.4%                        36.6%
                                                                                                                                                                                    33.3%
                                                                                    31.0%                                                      29.1%       30.5%
30%
                                                                                                                         20.5%
20%                                                                                                            16.7%

10%

 0%
       Cities or metropolitan   Small towns, villages or          Beach                 Mountain                     Desert          Theme or amusement   U.S. National Parks   State, county or regional
                areas                     rural            destinations/resorts    destinations/resorts       destinations/resorts          parks                               parks or recreation areas
                                destinations/attractions                          (including ski resorts)

                           (Base: Wave 11. 1,223 completed surveys. Data collected May 22-24, 2020) Source for historical data, The State of the American Traveler, Destination Analysts, Inc.
                                                                                                                                                                                                    Page 38
Leisure Travel by Destination Type (Expected # of Trips in the Next 12 Months)
Not only are more travelers planning to visit National and other parks, the average number of trips they plan to take is greater,
compared to only four months ago. The number of trips Americans expect to take to cities, beaches and theme/amusement parks has
fallen.

Question: In the next 12 months, HOW MANY TRIPS will you take that will include each of the following types of leisure destinations?

                                                                          Average Number of Trips (All Respondents)
   1.50
              1.38
                                                                                        January 2020                         This week
   1.25

                                                               0.98
   1.00
                      0.84            0.88     0.87                    0.83                                                                                                                  0.80
   0.75                                                                                                                                0.65                         0.66
                                                                                                0.58                                                                                0.62
                                                                                       0.49                                                   0.51         0.51
   0.50
                                                                                                                        0.34
                                                                                                                0.27
   0.25

   0.00
          Cities or metropolitan Small towns, villages or          Beach                 Mountain                   Desert          Theme or amusement   U.S. National Parks   State, county or regional
                   areas                   rural            destinations/resorts    destinations/resorts     destinations/resorts          parks                                  parks or recreation
                                 destinations/attractions                          (including ski resorts)                                                                               areas

                         (Base: Wave 11. 1,223 completed surveys. Data collected May 22-24, 2020) Source for historical data, The State of the American Traveler, Destination Analysts, Inc.
                                                                                                                                                                                                           Page 39
Excitement for Each Destination Type (Top 3-Box Score)
Despite the travel patterns described, when asked how excited they were to visit all destination types, excitement levels are much
lower than they were in January.

Question: Thinking carefully about                                                  Top 3-Box Score (10-8, on 10-point Scale)
the destinations you are MOST                     80%
EXCITED TO VISIT IN THE NEXT
                                                                   Winter 2016               January 2017          Winter 2018                Winter 2019          This Week
TWELVE (12) MONTHS for leisure
reasons.                                                                                                                                                    60.4% 60.7% 59.0%
                                                  60%                                                                                               57.0%
                                                              53.2%
                                                                      49.2% 49.6%
Use the 10-point scale where 10 =                                                   47.1%                       45.7% 45.3%
                                                                                                        42.1%                 42.4%
"Very excited" and 1 = "Not at all                40%
excited" to state how generally                                                                                                                                                 33.9%

excited you are to visit each in the                                                                                                  24.1%
                                                                                            21.6%
upcoming year?                                    20%

                                                   0%
                                                               Cities or metropolitan areas             Small towns, villages or rural               Beach destinations/resorts
                                                                                                          destinations/attractions

                    (Base: Wave 11. 1,223 completed surveys. Data collected May 22-24, 2020) Source for historical data, The State of the American Traveler, Destination Analysts, Inc.
                                                                                                                                                                                          Page 40
Excitement for Each Destination Type (Top 3-Box Score)

Question: Thinking carefully                                                   Top 3-Box Score (10-8, on 10-point Scale)
about the destinations you are
MOST EXCITED TO VISIT IN THE                80%
NEXT TWELVE (12) MONTHS                                         Winter 2016           January 2017            Winter 2018          Winter 2019           This Week
for leisure reasons.
                                            60%
Use the 10-point scale where                                                                                                                                49.0%
                                                                                                                                                                 45.8%
10 = "Very excited" and 1 =                                40.0%
                                                                42.0%40.8%                                                  42.2%42.7%40.8%
                                                                                                                                                       40.4%
                                                                                                                                                                      42.8%
                                                      39.5%                                                            39.6%
"Not at all excited" to state               40%
how generally excited you are                                                               30.3%31.0%
                                                                          26.6%                       28.1%
                                                                                       24.8%                                                                               24.0%
to visit each in the upcoming
                                            20%                                                                                            18.6%
year?                                                                                                      13.9%

                                             0%
                                                             Mountain               Desert destinations/resorts Theme or amusement parks                 U.S. National Parks
                                                        destinations/resorts

                  (Base: Wave 11. 1,223 completed surveys. Data collected May 22-24, 2020) Source for historical data, The State of the American Traveler, Destination Analysts, Inc.
                                                                                                                                                                                        Page 41
General Interest in Travel Experiences (Top 2-Box Score)
Interest in all types of travel experiences is greatly muted at the moment. In January and this past week, American travelers were asked
about their general interests in various travel experiences. Sadly, all travel experiences are of less interest now than four months ago.

                                      Top 2-Box Score (Interested or Very interested)                                     January 2020          This Week            % CHNG
                                      Enjoying scenic beauty                                                                   73.2%               61.7%               -15.7%
Question: In general how              Outdoor activities (warm weather)                                                        68.0%               53.4%               -21.5%
interested are you in                 Visits to beach destinations or resorts                                                  65.1%               51.0%               -21.8%
taking LEISURE TRIPS                  Take Road Trips                                                                          60.3%               50.5%               -16.3%
which would include the               Cuisine and food experiences                                                             56.2%               47.4%               -15.6%
                                      Visit U.S. National Parks                                                                57.7%               46.7%               -19.2%
following.
                                      Visiting historical attractions                                                          58.4%               46.5%               -20.5%
                                      Visit State, local or regional parks                                                     53.2%               45.2%               -15.0%
                                      Small towns, villages or rural destinations/attractions                                  52.2%               40.6%               -22.2%
                                      Big city experiences                                                                     46.0%               34.3%               -25.5%
                                      Visits to mountain destinations/resorts (including ski resorts)                          44.2%               34.1%               -22.8%
                                      Attend Festivals and Special Events                                                      45.9%               33.2%               -27.6%
                                      Arts & culture                                                                           45.9%               31.7%               -31.0%
                                      Visits to foreign countries                                                              47.5%               30.4%               -36.0%
                                      Theme or amusement parks                                                                 44.9%               30.1%               -33.0%
                                      Visits to desert destinations or resorts                                                 36.6%               23.8%               -34.9%
                                      Outdoor activities (winter)                                                              28.5%               23.1%               -19.1%

                   (Base: Wave 11. 1,223 completed surveys. Data collected May 22-24, 2020) Source for historical data, The State of the American Traveler, Destination Analysts, Inc.
                                                                                                                                                                                         Page 42
Drivers of Destination Aspiration (Top 3-Box Score)
The coronavirus pandemic appears to be draining much of the joy out of travel aspiration. Survey respondents were asked to name the
destination they most wanted to visit in the next year (one that they reasonably expected to visit), and then asked to select from a list of
reasons which represented why they aspired to visit that particular destination. Only two reasons saw increases—beaches/water sports
and connecting with nature. American travelers are now less likely to say any other reasons were driving their travel aspirations.

Question: On the last page you                                                           January 2020 This Week   % CHNG
said you would like to visit                 Beaches or water sports                        20.1%       22.7%       13.4%     Only two
 in                      Connecting with nature                         17.5%       18.2%        4.4%     reasons
the next year.                               Friends or family are there                    32.8%       30.4%       -7.6%
                                             Bucket list destination                        11.5%        9.7%      -16.3%
                                                                                                                              increased
                                             Music scene                                     9.0%        7.3%      -19.2%     between
Which of the following are                   Romance                                         8.5%        6.7%      -21.1%     January to
reasons you want to visit                    Adventure                                      20.8%       16.0%      -23.0%     this week.
 this                    Food & cuisine                                 27.0%       20.5%      -24.0%
year?                                        Winter fun (skiing, snowboarding etc.)          4.4%        3.3%      -25.3%
                                             Shopping                                       18.8%       13.7%      -27.1%
(Base: Wave 11. 1,223 completed surveys.     History                                        17.5%       12.7%      -27.4%
Data collected May 22-24, 2020) Source for   Arts & culture                                 14.3%       10.3%      -28.1%
historical data, The State of the American
                                             General atmosphere                             30.1%       21.4%      -28.7%
Traveler, Destination Analysts, Inc.
                                             Visited before and want to return              36.2%       25.7%      -28.9%
                                             It's mysterious or exotic                       7.8%        5.5%      -29.3%
                                             Nightlife                                      13.0%        9.2%      -29.5%
                                             Special event, sporting event or festival      13.2%        8.8%      -33.5%
                                             Theme or amusement park                        16.5%        9.7%      -41.3%
                                             Word of mouth                                   9.7%        4.9%      -49.6%
                                                                                                                                           Page 43
Questions?     • We’re here for you. Please email us at info@destinationanalysts.com.

Need More
               • Our full hub of insights is available at
Information?     https://www.destinationanalysts.com/covid-19-insights/
15-minute presentations
for your board and
stakeholders
info@destinationanalysts.com
You can also read