DATA-ENABLED CRYPTOCURRENCY MARKET ANALYSIS AND VISUALIZATION PLATFORM - IHCI 2021
←
→
Page content transcription
If your browser does not render page correctly, please read the page content below
International Conferences Computer Graphics, Visualization, Computer Vision and Image Processing 2021;
                                                                                       Connected Smart Cities 2021;
                                           and Big Data Analytics, Data Mining and Computational Intelligence 2021

          DATA-ENABLED CRYPTOCURRENCY MARKET
           ANALYSIS AND VISUALIZATION PLATFORM

                    Ningbo Zhu, Fei Yang, Mingzhi Zhu, Xinyao Sun and Irene Cheng
                      University of Alberta, Computing Science Department, Multimedia Program
                   2-32 Athabasca Hall, University of Alberta, Edmonton, Alberta, T6G 2E8, Canada

ABSTRACT
The cryptocurrency industry has evolved rapidly in recent years, and it is increasingly popular as a convenient tool to
complement the traditional stock and futures exchanges. Accurate market research enables traders to make more
informed decisions and benefit from their investments. Our objective is to introduce a web platform for aggregating
various types of cryptocurrency data, both on- and off-chain. Its novelty lies in offering a visual representation of market
data analysis, which is driven by multi-modal data fusion and representation techniques, as well as artificial intelligence.
We propose a full-stack framework that consists of a front-end web application for user interaction and visualization, and
a backend server for data fetching, preprocessing, and analysis. In our implementation, we used data from the
cryptocurrency market, on-chain statistics, and textual data from social media, to create a deep-learning-based market
trend model. For market prediction, our data analysis module processed high-frequency vocabulary extracted from social
media, sentiment analysis of social media content, historical price trend, and historical hash rates. Investors and market
analysts can benefit from our platform by directly observing the dynamic of multi-modal cryptocurrency data and easily
exploring market trends, generated by our market prediction model delivered by a front-end application. The complete
implementation can be found in our publicly available GitHub link upon request.

KEYWORDS
Cryptocurrency, Price Prediction, Data Visualization, Neural Language Processing, Sentiment Analysis, Machine
Learning

1. INTRODUCTION
The values of cryptocurrencies soared in recent years as a result of recent super-exponential rise in their
market capitalization. There are now over 1,500 cryptocurrencies that are regularly exchanged.
Cryptocurrencies can be purchased using fiat currency in a variety of online markets. The daily transaction
amount has surpassed $35 billion. With the prices of cryptocurrencies (e.g. Bitcoin) rapidly rising, the lack of
an efficient tool for effective data analysis is a big challenge in this research and market domain.
    The development of a self-organized market for virtual currency and/or commodity, whose worth is
largely determined by social consensus has attracted the attention of the scientific community. Mohapatra et
al. (2019) conducted real-time cryptocurrency market prediction using Twitter sentiment. They used
decision-tree based algorithms for prediction. Between the real and expected Bitcoin prices, their model's
overall Root-Mean-Square Error (RMSE) is $10. Rodolfo Saldanha (2020) used two separate versions of
Recurrent Neural Networks (RNNs) to forecast Amazon's potential stock values based on historical data,
which achieved perfect performance. His data preprocessing and training model development serve as our
reference for developing a benchmark for our project. Saad et al. (2021) predicted the Bitcoin (BTC) and
Ethereum (ETH) prices using a multivariate regression model and Long Short-Term Memory (LSTM)
network (Hochreiter & Schmidhuber, 1997). They used the price, mining complexity, hash rate, and user
count, as features. Their model had a Mean Absolute Error (MAE) of 0.0162 on BTC and 0.0563 on ETH.
Jay et al. (2020) applied stochastic Multi-Layer Perception (MLP) and LSTM networks by randomizing the
activation functions at runtime. The stochastic module had incorporated market responses to improve the
expected outcome. Phaladisailoed et al. (2018) compared the effectiveness of many machine learning
techniques to forecast Bitcoin prices. They created the models based on Bitcoin prices using the Scikit-learn

                                                                                                                       133
ISBN: 978-989-8704-32-0 © 2021
library, Theil-Sen, and Huber regression models, and LSTM and Gated Recurrent Unit (GRU) deep learning
models.
Despite the above efforts, current methods do not provide an intuitive picture to the investors. Their
numerical results lack a clear development trend of cryptocurrency, to show the historical price changes and
the predicted price trends. To address this issue, we develop a web interface for visualizing
cryptocurrency-related data using the latest state-of-the-art intelligent data processing and analysis
methodologies.
2. PROPOSED PLATFORM
The visualization of historical market trends can reflect the social confidence (investor sentiment) in a
cryptocurrency. The long-term pricing pattern provides insight into prospective market movements. Our
objective is to analyze the price patterns and provide visualization for the last seven years of the Bitcoin
market. Apart from the historical patterns, reliable price predictions are important, based on which investors
decide to commit their transactions. In this work, we present three different machine-learning based
forecasting frameworks for cryptocurrency. Because cryptocurrency is a decentralized currency, we also
examine the relationship between the cryptocurrency's price shift rate and social network-based sentiment
data. A careful analysis of social media data often leads to the discovery of high-frequency vocabularies,
associated with popular social interests (conversations), which can reflect a trigger of significant market
fluctuations. For this reason, our platform focuses on the description and visualization of high-frequency
terms, and conducts a hybrid analysis, incorporating both quantitative and textual sentiment information to
better explore the market sentiment.
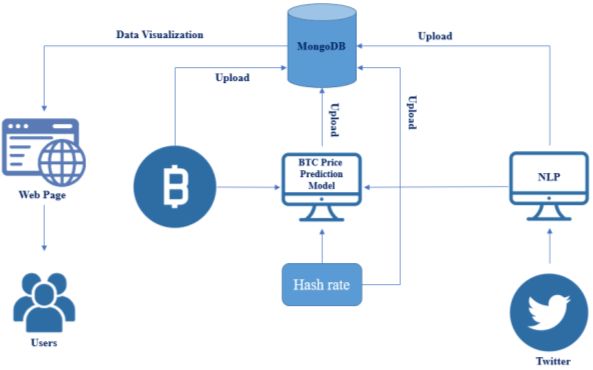
Our platform is composed of three main components: (1) Data Fetching and Preprocessing, (2) Price
Prediction, and (3) Data Visualization. Figure 1 shows the architecture of our proposed platform.
Figure 1. Platform Architecture
2.1 Data Fetching and Preprocessing
We use Bitcoin to demonstrate the performance of our platform because it is the most widely used and
representative cryptocurrency. We obtained the daily exchange market data from January 1, 2014, to
December 31, 2021 via Coindesk (Coindesk, 2021) as off-chain data, and the Bitcoin hash rates for the same
period from Quandl (Quandl, 2021) as on-chain data. Our backend server obtained social media information
by crawling Twitter tweets using Twint (Poldi, 2020). Models based on neural networks have delivered
impressive results, including Natural Language Processing (NLP) applications. Thus, we used an NLP based
analytics library NLTK (Bird et al., 2009) to formalize tweets into keywords, enable machines to
comprehend simple sentences. To achieve Bitcoin price prediction, we extracted a one-hot vector of
high-frequency vocabularies over time, that may have a relationship with the pace at which the Bitcoin price
increases. We incorporated them into the training model as a function. We observed that a significant cluster
of positive or negative sentiments appearing in social media can indicate a potential change in the
134International Conferences Computer Graphics, Visualization, Computer Vision and Image Processing 2021;
Connected Smart Cities 2021;
and Big Data Analytics, Data Mining and Computational Intelligence 2021
cryptocurrency price. We fed the sentences into a sentiment analysis model called vaderSentiment (Hutto
& Gilbert, 2014), which computed the sentiment strengths of the sentences. We set seven days as a training
batch for the model. After each batch, we shifted one day and collected the next batch. The same procedure
was applied on other features. Normalization was the next stage of preprocessing. Each seven-day
combination of the input data was normalized using the Min-max method. The hash rate was normalized
similar to the price. Additionally, we shuffled the normalized sliced data to ensure the robustness of the
trained model.
2.2 Price Prediction
For price prediction, we compared three different machine-learning models in this work: LSTM, bi-LSTM,
and GRU. Additionally, we evaluated different feature combinations to forecast the trends of Bitcoin price.
Recurrent Neural Networks (RNNs) are a subclass of artificial neural networks capable of solving problems
such as prediction, machine translation, and emotion classification, by making repeated use of sequential
data. However, RNNs have limited short-term memory and are incapable of training very long input
sequences. As the training of long sequence data progresses, the vanishing gradient problem becomes
obvious. The gradient is used to update the neural network's weights. If the gradient is too small, each
update's weight has a more negligible effect on subsequent training, and the model stops learning or learns
very slowly.
LSTM aims to address this issue by storing and restoring long-term data without consuming excessive
memory. LSTM has three gates, while GRU has just two. As a result, GRU has fewer parameters and is thus
simpler to converge. The bi-LSTM (Reimers & Gurevych, 2017) model contains one more collection of
LSTM layers than the LSTM model. It consists of a forward and a backward LSTM. Bi-LSTMs significantly
increase the amount of information extracted and enhance the network content availability. Root Mean
Square Error (RMSE) was used as the loss function in training and validation for the weight backpropagation
in each epoch. The training and validation losses were plotted to determine if the model converged well.
After completing model training, we used the trained model to analyze the historical price data from
January 2014 to December 2020 in order to determine the Predicted Rate in Equation (1). We then obtained
the predicted price, which was passed to the Visualization Module of our web application to assist users
making cryptocurrency purchase decisions.
Predicted Price = Analyzed Historical Price (1+Predicted Rate) (1)
2.3 Data Visualization
Figure 2. Price Prediction with Recharts Figure 3. Word count with World-cloud
Our front-end web application is constructed using the React-Router-Dom, Sass, and AntD (Ant-Design,
2015) frameworks. Charts are used to visualize all numerical data using the Recharts library.
The line chart page in Figure 2 allows the users to select a date range to visualize the data and let them
select any of the three models to see the trend predication. We also provide tabs for users to view details on
four additional pages, each of which has its own set of trend features. By comparing different maps, investors
can make informed investment decisions.
135ISBN: 978-989-8704-32-0 © 2021
Since tweets are used as input in our prediction model, users might be curious about the types of
keywords listed and their frequency of occurrence. For users to understand the social sentiment, we provide a
React-Word Cloud tab as illustrated in Figure 3. Users can check the cryptocurrency keywords most
discussed on Twitter through this tab.
3. RESULTS AND DISCUSSION
Tables 1 and 2 summarize the results of the three models for Bitcoin price predication. In Table.1, "Sign
Correct" denotes the proportion of correctness when predicting whether the change in price rate is positive or
negative. "Error< 0.05" indicates that the difference between the expected and ground-truth rates is less than
5%. In other words, the predicted outcome is considered accurate if it has the same sign as the ground-truth
and the difference is less than 5%. To keep investor decisions in the loop, our system also lists predictions
with “Sign Correct” or “Error < 0.05” so that users can make their judgements. Note that GRU has the best
prediction output. When p (price) is used as an input feature, it has 72.35 % accuracy on the "Sign Correct"
and "Error < 0.05" criteria. In general, it also outperforms the other models when using other features or
combination of features. Table.2 shows the evaluation of the training, validation, and test prediction results of
the three models. We use RMSE and Mean-Square Error (MSE) (Sammut & Webb, 2011) to evaluate the
results.
Table 1. Prediction results of LSTM, bi-LSTM, and GRU (p: Price, hr: Hash rate, t-sen: Twitter Sentiment Intensity,
t-key: Twitter Keywords)
LSTM bi-LSTM GRU
Sign Sign Sign
Features Processing Sign Error< Correct Sign Error< Correct Sign Error< Correct
Correct 0.05 & Error Correct 0.05 & Error Correct 0.05 & Error
< 0.05 < 0.05 < 0.05
Train 0.7830 0.9675 0.7560 0.8197 0.9828 0.8056 0.7793 0.9510 0.7382
p Validation 0.7083 0.8627 0.6127 0.7353 0.8603 0.6446 0.7819 0.9118 0.7132
Test 0.7725 0.9235 0.7098 0.7706 0.9235 0.7000 0.7863 0.9255 0.7235
Train 0.5383 0.8676 0.4746 0.5303 0.8719 0.4641 0.5267 0.8657 0.4629
hr Validation 0.4975 0.8284 0.4093 0.4779 0.8284 0.3995 0.4951 0.8284 0.4093
Test 0.5412 0.8549 0.4588 0.5510 0.8549 0.4725 0.5412 0.8549 0.4588
Train 0.7474 0.9761 0.7284 0.7836 0.9859 0.7713 0.7284 0.9626 0.7032
p + hr Validation 0.7034 0.8725 0.6029 0.6838 0.8431 0.5760 0.6961 0.8750 0.6078
Test 0.7196 0.9039 0.6431 0.7235 0.8941 0.6431 0.7392 0.9098 0.6706
p + hr Train 0.5310 0.8688 0.4697 0.5395 0.8700 0.4776 0.5671 0.8749 0.4954
+ t-sen Validation 0.5049 0.8309 0.4314 0.4632 0.8309 0.3922 0.5294 0.8260 0.4485
+ t-key Test 0.5353 0.8549 0.4529 0.5235 0.8608 0.4529 0.5373 0.8510 0.4706
Table 2. MSE and RMSE of BTC Prediction Result of LSTM, bi-LSTM, GRU
RMSE MSE
Features Model
price price increasing rate price price increasing rate
LSTM 479.24666 0.02966 229677.36324 0.00088
p bi-LSTM 472.48233 0.02954 223239.55571 0.00087
GRU 469.90102 0.02878 220806.96473 0.00083
LSTM 354.78032 0.04035 125869.07334 0.00163
hr bi-LSTM 354.50125 0.04033 125671.13781 0.00163
GRU 354.65508 0.04034 125780.22648 0.00163
LSTM 472.55968 0.03327 223312.64773 0.00111
p + hr bi-LSTM 509.86317 0.03433 259960.45556 0.00118
GRU 482.64162 0.03332 232942.93189 0.00111
p + hr LSTM 357.16888 0.04028 127569.61041 0.00162
+ t-sen bi-LSTM 357.72260 0.04034 127965.46017 0.00163
+ t-key GRU 359.60044 0.04038 129312.47500 0.00163
136International Conferences Computer Graphics, Visualization, Computer Vision and Image Processing 2021;
Connected Smart Cities 2021;
and Big Data Analytics, Data Mining and Computational Intelligence 2021
4. CONCLUSION
We propose a full-stack platform for cryptocurrency market data analysis and visualization. Using Bitcoin as
a use case, we examine a complete data processing pipeline, from data aggregation to historical data analysis,
future trend prediction and output visualization embedded in a user friendly web interface. We use a set of
intelligent data analysis techniques, including machine learning and neural language processing, to assist
users to understand market trends and make informed decisions. By incorporating social sentiment in data
analysis, the experimental results demonstrate a promising outcome. Our front-end web application, which
involves investors in the loop, allows users to visualize both on-chain and off-chain data, as well as social
media and data analysis rationale, e.g., high-frequency keywords in social media. In future work, we will
extend the framework to include additional cryptocurrencies beyond Bitcoin.
ACKNOWLEDGEMENT
The technical advice of Hengming Zhang from WhiteMatrix LTD. (Nanjing, Jiangsu, China) is gratefully
acknowledged.
REFERENCES
Ant-Design. (2015). ant-design/ant-design. GitHub. https://github.com/ant-design/ant-design/.
Bitcoin Price Index - CoinDesk 20. CoinDesk. (2021, June 24). https://www.coindesk.com/price/bitcoin.
Bird, S., Klein, E., & Loper, E. (2009). Natural language processing with Python: analyzing text with the natural
language toolkit. " O'Reilly Media, Inc.".
Hutto, C., & Gilbert, E. (2014, May). Vader: A parsimonious rule-based model for sentiment analysis of social media
text. In Proceedings of the International AAAI Conference on Web and Social Media (Vol. 8, No. 1).
Hochreiter, S., & Schmidhuber, J. (1997). Long short-term memory. Neural computation, 9(8), 1735-1780.
Jay, P., Kalariya, V., Parmar, P., Tanwar, S., Kumar, N., & Alazab, M. (2020). Stochastic neural networks for
cryptocurrency price prediction. IEEE Access, 8, 82804-82818.
Mohapatra, S., Ahmed, N., & Alencar, P. (2019, December). KryptoOracle: A Real-Time Cryptocurrency Price
Prediction Platform Using Twitter Sentiments. In 2019 IEEE International Conference on Big Data (Big Data)
(pp. 5544-5551). IEEE.
Phaladisailoed, T., & Numnonda, T. (2018, July). Machine learning models comparison for bitcoin price prediction.
In 2018 10th International Conference on Information Technology and Electrical Engineering (ICITEE)
(pp. 506-511). IEEE.
Quandl. quandl.com. (2021). https://www.quandl.com/data/BCHAIN/HRATE-Bitcoin-Hash-Rate.
Reimers, N., & Gurevych, I. (2017). Optimal hyperparameters for deep lstm-networks for sequence labeling tasks. arXiv
preprint arXiv:1707.06799.
Saad, M., Choi, J., Nyang, D., Kim, J., & Mohaisen, A. (2019). Toward characterizing blockchain-based cryptocurrencies
for highly accurate predictions. IEEE Systems Journal, 14(1), 321-332.
Saldanha, R. (2020, June 3). Stock Price Prediction with PyTorch. Medium. https://medium.com/swlh/stock-price-
prediction-with-pytorch-37f52ae84632.
Sammut, C., & Webb, G. I. (Eds.). (2011). Encyclopedia of machine learning. Springer Science & Business Media.
Poldi, F. (2020). Twint-twitter intelligence tool. URL: https://github. com/twintproject/twint (visited on 01/02/2020).
137You can also read