An Introduction to the Impact and Classification of Injuries - Linda Yenssen, Manager Ontario Injury Prevention Resource Centre
←
→
Page content transcription
If your browser does not render page correctly, please read the page content below
An Introduction to the Impact
and Classification of Injuries

             Linda Yenssen, Manager
     Ontario Injury Prevention Resource Centre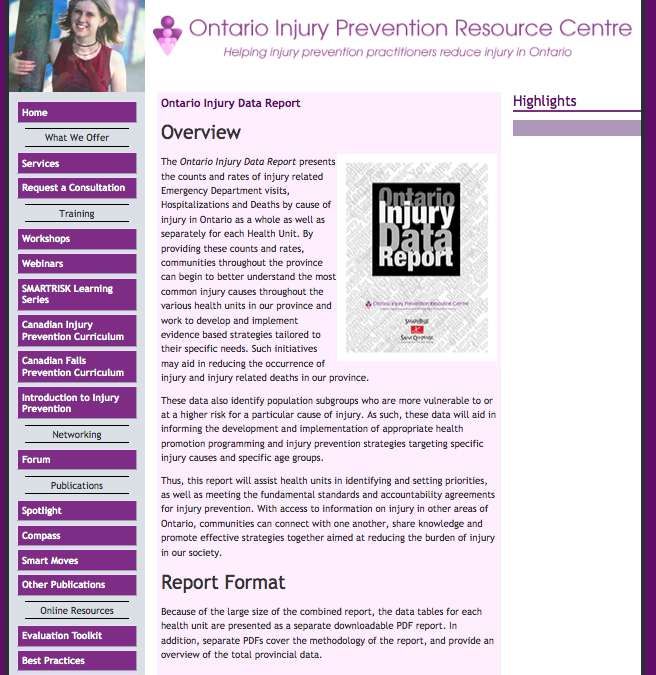
Learning Outcomes

    • Understand stages of evaluation and how it relates to
      the public health approach
    • Understand the importance of completing a needs
      assessment
    • Understand where you can look for injury data
    • Understand the types of injury data available
    • Learn the strengths and limitations of data
    • Understand other factors to consider in defining the
      problem

2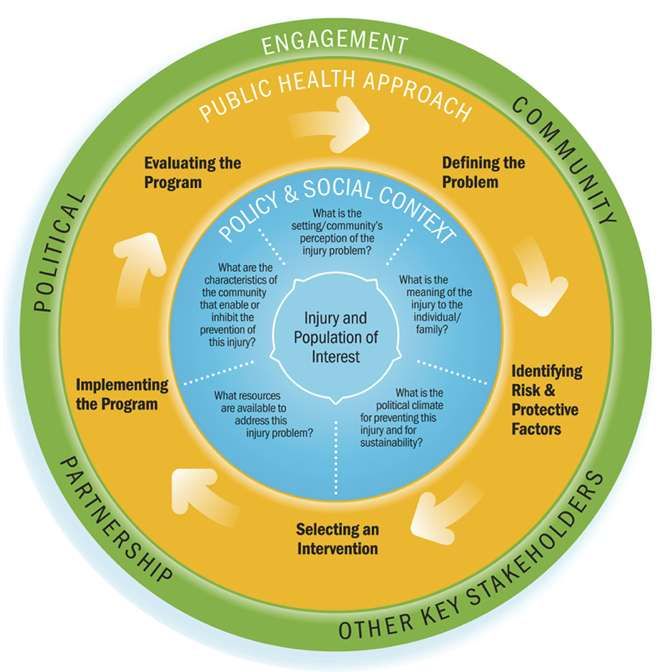
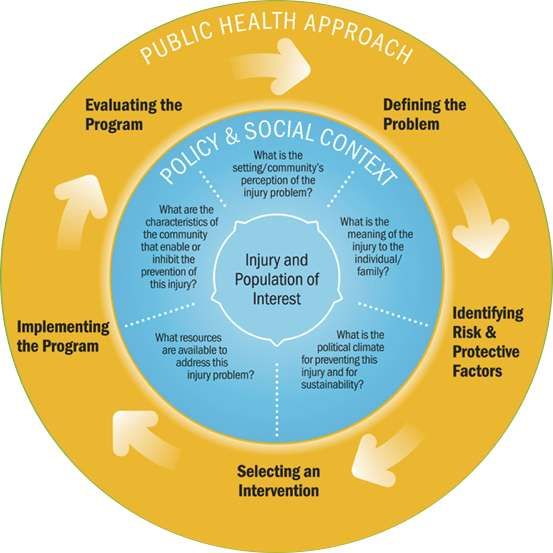
The Context

3
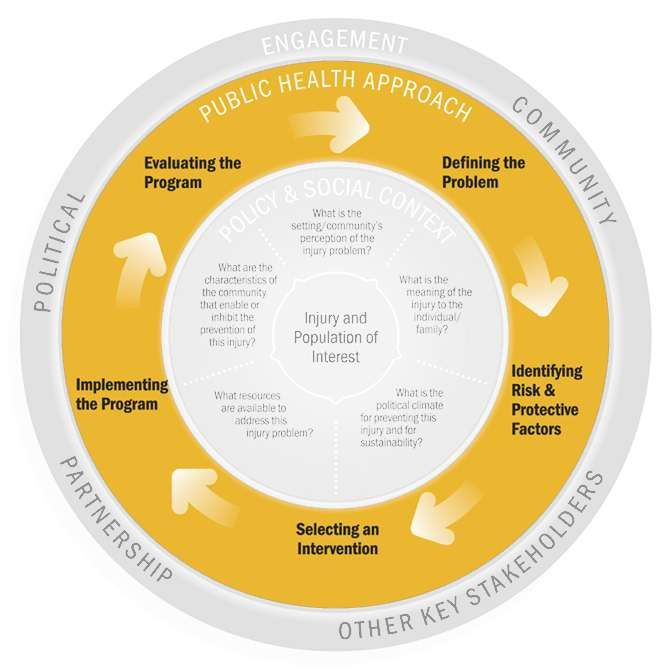
A Public Health Approach

4
Levels of Engagement

5
What this means for Injury Prevention

    • Injuries are an important and preventable
      problem
    • Best practice means that scientific evidence must
      be combined with practitioner expertise and lived
      experience
    • Strengths exist within every community to
      facilitate action
    • A healthy policy environment is fundamental
    • Collaboration and partnerships are essential

6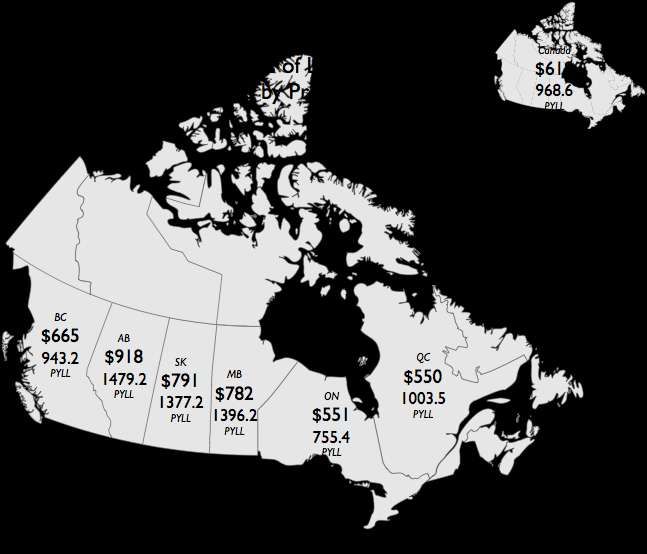
Define the Problem
    If you do not start out with a clear and focused problem
    definition, the program will get into trouble.

            If you don't know where you are going,
            you might wind up someplace else.

                                         -Yogi Berra

7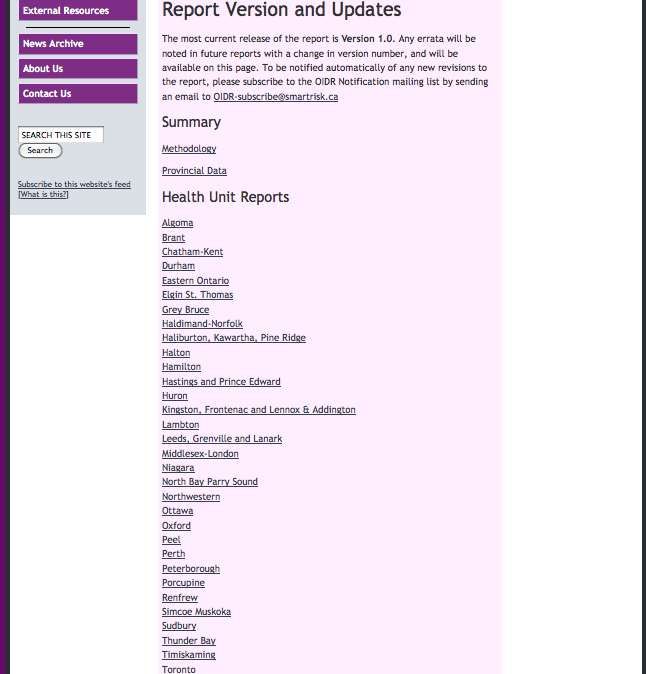
Needs Assessment
    • Part of defining the problem, and identifying
      risk factors
    • Use of locally relevant data
    • Public interpretation of the problem
    • Public will
    • Political will

       ...Your social and policy context!
8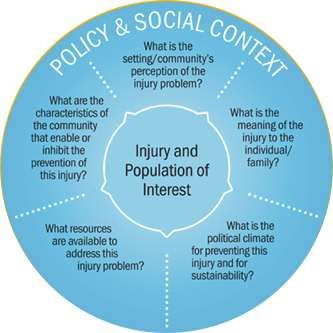
The Burden of Injury
    • Frequency
    • Rates
    • Costs
    • Population-based costs:
     – Potential Years of Life Lost (PYLL)

    • Ontario Injury Data Report – contains rates
      and frequencies – will be introduced later in
      presentation

9
Frequency
The number of injuries in a specific time period.
Examples:

     • In 2003, 13,906 Canadians died as a result
       of injuries.
     • Injuries are the leading cause of death for
       Canadians between the ages of 1 and 44
       and the fourth leading cause of death for
       Canadians of all ages.*
10   *Injury and Child Maltreatment Section, Public Health Agency of Canada analysis of Statistics Canada data.
Rates
The frequency of injuries:
• within a given population
• within a given period of time
Example: Calculating rates per 100,000:
Total # of Injuries X 100,000
Population
11Rates
Examples:
• Rates of unintentional deaths due to house
fires are highest among ages 80+ years at
3.2 per 100,000 per year, with children aged
0 to 4 the next highest at 2.9 per 100,000
per year.
• From 1996 to 1997, the fall-related
hospitalization rate for ages 65-74 was 837
per 100,000 but for those over 85 years of
12
age it was 6,281 per 100,000.Frequency Versus Rates
Community A Community B
# of injuries in May: 5 # of injuries in May: 1,650
Population: 1,500 Population: 500,000
Rate/100,000 Population: 333 Rate/100,000 Population: 330
13Rates based on Exposure vs
population
• Not everyone in the population is equally likely to get
hurt in a given way
• Population based rates don’t take this into account
• Can express rates in terms of exposure to risk
instead, for example
–# of MVC injuries / 1000km driven
–# of MVC injuries / 1000 hours spent in a car
14Costs of Injury
• Human Costs
– E.g., Loss of independence
• Direct Costs
– E.g., Hospital costs
• Indirect Costs
– E.g., Loss of productivity
15Annual Costs of Injury in Canada
Type of Information
Injury Deaths 13,667
Hospitalized Injuries 211,768
Non-Hospitalized Injuries 3,134,025
Injuries resulting in Partial Permanent Disability 62,563
Injuries Resulting in Total Permanent Disability 5,023
Total Annual Cost of Injuries $19.8 billion
(direct and indirect costs)
Source: Economic Burden of Injury in Canada (2009), SMARTRISK, ON
16Annual Costs of Injury in Ontario
Type of Information
Injury Deaths 4,643
Hospitalized Injuries 71,727
Non-Hospitalized Injuries 1,196,505
Injuries resulting in Partial Permanent Disability 22,030
Injuries Resulting in Total Permanent Disability 1,741
Total Annual Cost of Injuries $6.8 billion
(direct and indirect costs)
Source: Economic Burden of Injury in Canada (2009), SMARTRISK, ON
17Potential Years of Life Lost
(PYLL)
• PYLL: # of years that an individual lost because they died
before reaching normal life expectancy (usually
standardized to 75)
– e.g., Person who dies in a car crash at age 45 has 30
PYLL
• It’s a frequency, so it can be turned into a rate
1819
Questions to ask about injury

               WHAT happened?

               To WHOM?

               WHEN?

               WHERE?

               WHY?

20
Scenario
• A male, 17 year old driver, with 4 other teen passengers are involved
in a single car crash
• Rural road at 3 a.m. on an overcast night.
• The driver was taken to the local emergency department, treated for
minor injuries and released.
• One passenger hospitalized with severe injuries - transferred to a lead
trauma facility.
• Three passengers killed instantly.
• Speed and alcohol/drugs are being investigated. Seatbelt use is
unknown. The vehicle was an eight year old compact car.
• Questions:
– Who is getting hurt and how?
– Where can we obtain this information?
21Information about who died
• Vital Statistics (Deaths)
– Population based
– Basic information (age, sex, geography, date, cause
and nature of injury)
• Coroners’ / Medical Examiners’ Reports
– Coroner investigation
– Basic information + individual reports can be quite
detailed
22Information about all
Hospitalized Injuries
• Discharge Abstract Database
– Administrative database of all acute care facilities
– Minimal Dataset of Trauma Registry contains these
records for injury cases
– Basic information (age, sex, geography, date, cause
and nature of injury, treatment given, discharge status)
– Population based
23Information about Major Injuries
• Trauma Registry Comprehensive Dataset
– Collected by lead trauma facilities
– Basic information (age, sex, geography, date, cause
and nature of injury, treatment given, discharge status)
+ information on risk factors (e.g., blood alcohol
concentration, seat belt use)
– Not population based
• only those admitted to participating facilities,
• only those admitted for trauma (e.g., poisoning is an injury but
not a trauma) of sufficient severity
24Information on Emergency
Department Visits for Injury
• National Ambulatory Care Reporting System (NACRS)
– Population based for Ontario ED visits
– Alberta has separate system
– Basic information
• Canadian Hospitals Injury Reporting and Prevention
Program (CHIRPP)
– 14 select facilities (10 pediatric)
– Detailed reports of circumstances surrounding injury event of patients in ED,
independent of regular hospital administrative records
25The ICD-10 CA
• A standard coding system for diseases and
health conditions, used internationally
• Developed by the WHO
• Captures nature of injury
• Captures external cause of injury
• Requires detailed documentation
26Comparing Injury Information
• Using ICD-10 • Not using ICD-10
– Vital Statistics – Coroners’ Reports
– Comprehensive – CHIRPP
Dataset
– Discharge
Abstract
Database
– NACRS
27Injury Outcomes
Deaths: Vital Statistics, Coroner’s Data
Severe Trauma: Trauma Registries
All Hospital Admissions: Discharge Abstracts
Emergency Visits: NACRS, CHIRPP
Treated in Physicians’ Offices,
elsewhere, at home or never treated:
Population Health Surveys
28Where else to get information
• Police / Ministries of Transportation
– Crash reports / investigations often
contain detail about circumstances of the
injury event
• Insurance Sector
– Information about driving habits, risk
profiles, costs of collisions
• Surveys
– Population health surveys contain
information on some risk behaviours and
also on injuries not reported elsewhere
– Research surveys on special topics (e.g.,
Student Drug Use Survey, Road Safety
Monitor)
29General Issues
• Population based versus not
– Data sets may have different population definitions
– Trade-offs exist, between coverage and level of detail
• Databases collected for particular purpose
(not injury prevention)
– E.g., Hospital data is about resource utilization not
causes of injury
• Coding differences may exist within and
between jurisdictions
30Other Approaches to Injury
Data Collection
• Special surveys
• Addition to existing collection tools
• Special studies
• Questionnaires, interviews, observation
surveys, focus groups
• Geographic Information Systems (G.I.S.)
31When Do You Have Enough
Data?
• Data are the means, not the end
• Decide at the beginning what data and
information you need to define your problem
and to move forward
• When you find what you need, stop looking
Don’t get stuck at this step!
32Consult Experts Data analysis is an important part of your approach to injury prevention. Talk to the experts if you have any questions or require assistance with your analysis Examples: • local universities and other research centres • hospital health record departments • provincial or local health departments etc. 33
Review
     • What questions do we ask in identification
       and definition of an injury problem?
     • What is injury surveillance and why is it
       important?
     • What are the principal sources and types of
       data that can be used to develop injury
       prevention and control programs?

34
New
Surveillance
Tool
Ontario Injury
Data Report
(OIDR)
Jayne Morrish, Research Associate
SMARTRISK
Ontario Injury Prevention Resource CentreIntroductions Jayne Morrish – Research Associate at SMARTRISK and the Ontario Injury Prevention Resource Centre
Learning Outcomes

• History behind OIDR
• Introduction to injury
• Purpose of OIDR
• Layout of OIDR
• Reading the OIDR
• Methodology
• Data trends
History Behind OIDR • Requests: Public Health Stakeholders Media General public • Provide injury frequencies & rates by HU area & province • Report is final product of 2 years of work
Introduction to Injury

• Leading cause of death for Canadians
  between ages 1 and 44       Statistics Canada, 1998

• Great personal and financial cost
  – 4,643 lives and $6.8 billion to the economy
   in Ontario in 2004 SMARTRISK, 2009
What is an Injury?

   An injury is the physical damage that results
    when a human body is suddenly or briefly
 subjected to intolerable levels of energy. The
 time between exposure to the energy and the
         appearance of an injury is short.
Forms of Injury • Thermal energy – burns, scalds, etc. • Mechanical energy - falls, motor vehicle crashes, gashes, etc. • Electrical energy – electrical shocks, etc. • Chemical energy – poisonings, etc. • Absence of heat or oxygen – hypothermia, suffocation, drowning, etc.
External Causes of Injury

• Intentional (self-inflicted or other inflicted) –
  self-harm or assault
• Unintentional - motor vehicle collisions, falls,
  drowning and poisoning when there is no
  intent to harm
• Both categories have unique risk factors and
  are receptive to interventions
• OIDR includes both categories
Are Injuries Accidents?

• Occur in great numbers
• Widespread misconception that they are
  “accidents” which are part of everyday life   Sattin &
 Corso, 2007
Injuries Are Not
Accidents
• Truth: injuries are not accidents
  –Accidents are unavoidable acts of fact
  –Injuries are causally related to specific events
    and factors (e.g., age, gender, risk perception,
    SES, injury mechanisms, etc.)
• Injuries are both predictable and preventable
Purpose of OIDR • Help you to do something to reduce injuries • Provide frequencies/counts and rates of injury related ER visits, hospitalizations and deaths –Broken down by cause and age-group –Ontario as a whole & separately for each HU • Better understanding of causes of injuries –Evidence based strategies for specific needs –Aid in reducing injuries
Purpose of OIDR Cont’d

• Identifies vulnerable subgroups (e.g., age-
  groups)
  – Development and implementation of strategies
    targeting specific injury causes and age groups
• Identify and set priorities
• Meet standards and accountability agreements
• Connect with one another
  – Share knowledge, promote effective strategies, talk
    same language
Purpose of OIDR Cont’d • Not a better practices piece –OIPRC can provide similar services –www.oninjuryresources.ca
Layout of OIDR

• Sections
  –Summary section
  –Tables grouped by health unit
    • Ontario tables have totals across all 36 health units
    • All tables have the exact same format (e.g., table 1
      in your health unit showcases the same injury as
      table 1 in all other health units)

• All available from the OIPRC’s website
• Sign-up for updates
Layout of OIDR Cont’d • Tables 1 & 2 – All injuries • Tables 3, 4 & 5 – Fall related injuries • Tables 6 & 7 – On-road motor vehicle collisions • Tables 8 & 9 – Off-road motor vehicle collisions • Tables 10 & 11 – Sports & recreation • Tables 12 & 13 – Intentional interpersonal • Tables 14 & 15 – Intentional self-harm
Reading the Report

• Blanks – represent injury categories where there
  was no data
• Rates – rounded to one decimal place
  –Rates below .05 represented by “
Reading the Report
Cont’d
Reading the Report
Cont’d
Reading the Report
Cont’d
Reading the Report
Cont’d
Reading the Report
Cont’d
Reading the Report
Cont’d
Reading the Report
Cont’d
Reading the Report
Cont’d
Reading the Report
Cont’d
Reading the Report
Cont’d
Reading the Report
Cont’d
Reading the Report
Cont’d
Reading the Report
Cont’d
• ER visit and Hospitalization data contained on
  same tables
• Corresponding Death data contained on table
  immediately following
   –e.g., Table 1 contains ER visit and
    Hospitalization data for all injuries and Table 2
    contains Death data for all injuries
   –System has been implemented throughout the
    report
Reading the Report Cont’d
• Injury frequncies are shown on top of their corresponding rates
Reading the Report Cont’d Rates are very important to look at when you are doing comparisons
Reading the Report
Cont’d
• Tables continue to further breakdown injury data
  by category
  –e.g., Tables 3, 4 and 5 breakdown fall related
    injuries
• Read the titles of each table to be sure about
  what data is being shown in it
  –e.g., Table 1 contains ER and Hospitalizations
   across all injury categories and table 2
   contains Deaths across all injury categories
Definitions Used • Hospitalizations - total number of hospital separations from selected causes of injury • Emergency Room Visits (ER) - total number of Emergency Department visits from selected causes of injury. • Deaths - total number of deaths each from selected causes of injury
Years Reported

• Most recent years available from IntelliHEALTH
• Hospitalizations and ER visits – fiscal years
  2007/2008 and 2008/2009; 2 fiscal years
  –FY 2007-2009
• Deaths – calendar years 2001-2005; 5 calendar
  years
   –CY 2001-2005
Methodology

• Advisory committee
• Data source: IntelliHEALTH Database
• Extraction: done at Public Health Ontario
  by trained and authorized IntelliHEALTH
  users
• 4 Databases used
Methodology Cont’d

 • Population estimate data – “Pop Est Summary PHU County
   Municip” database
    – Calendar year population data used

   – Age-Specific Annual Rate per 100,000 for calendar year
   – How many people per 100,000 were injured
Methodology Cont’d
• ICD10 Codes used – full list available in summary document
• Quality assurance – robust checking process
• Residual disclosure – occurs when previously unknown
information about an individual can be deduced based on
combination of information sources
– IntelliHEALTH release guidelines require cell sizes less
than 5 should be suppressed
– In OIDR any cell frequencies less than 5, but greater than
zero, have been suppressed and replaced with “Methodology Cont’d
Data Trends - Ontario

 • Next slides will contain some tables that
   have been created using data from the
   OIDR tables
Data Trends - Ontario

 Top five mechanisms of injury resulting in the largest proportion of
   injury related emergency room visits, Ontario, fiscal year 2007-
                                 2009
Data Trends - Ontario Falls resulting in injury related emergency room visits broken down by age group, Ontario, fiscal year 2007-2009
Data Trends - Ontario

  Falls resulting in injury related emergency room visits
  broken down by age group, Ontario, fiscal year 2007-2009
REMEMBER: Rates are very important to look at
when doing comparisons and looking at
trends!Data Trends – Example – Middlesex & London Falls resulting in injury related emergency room visits broken down by age group, Ontario, fiscal year 2007-2009 Falls resulting in injury related emergency room visits broken down by age group, Middlesex & London, fiscal year 2007-2009
Data Trends – Comparisons

• All tables are laid out the exact same
  way and in same order for each health
  unit
 – Only difference is that the data is specific to the
   health unit area

• Can now compare across health units and
  to the Ontario totals
 – Speaking same language
 – Comparing same injuries and injury breakdowns
Data Trends – Comparisons

• Can simply compare across all health
  units by looking at same tables for any
  areas of interest
Data Trends - Ontario

 Top five mechanisms of injury resulting in the largest proportion of
         injury related hospitalizations, Ontario, FY 2007-2009
Data Trends - Ontario Falls resulting in injury related hospitalizations broken down by age group, Ontario, FY 2007-2009
Data Trends - Ontario

  Falls resulting in injury related hospitalizations broken down by
  age group, Ontario, FY 2007-2009
Data Trends – Example –
Durham
  Falls resulting in injury related hospitalizations broken down by
  age group, Ontario, FY 2007-2009

  Falls resulting in injury related hospitalizations broken down by
  age group, Durham, FY 2007-2009
Data Trends - Ontario

 Top five mechanisms of injury resulting in the largest proportion of
            injury related deaths, Ontario, CY 2001-2005
Data Trends - Ontario Self-harm injuries resulting in death broken down by age group, Ontario, CY 2001-2005
Data Trends - Ontario

  Self-harm injuries resulting in death broken down by age group,
  Ontario, CY 2001-2005
Data Trends – Example –
Ottawa
  Self-harm injuries resulting in death broken down by age group,
  Ontario, CY 2001-2005

  Self-harm injuries resulting in death broken down by age group,
  Ottawa, CY 2001-2005
What OIDR Allows For:

• Easy comparisons
  – Tables have exact same layout across HUs
  – Comparing apples to apples
  – Common language with common data
  – Easy to isolate and compare trends within injuries and specific
    age-groups

• First report of its kind in Ontario
• Has created experts with this data
• First step is developing an automated process
Additional Resources • www.onInjuryresources.ca – Forum – The Economic Burden of Injury in Canada – Ontario Injury Data Report • Canadian Falls Prevention Curriculum • Canadian Injury Prevention Curriculum • Workshops
Linda Yenssen – lyenssen@smartrisk.ca

Jayne Morrish – jmorrish@smartrisk.ca

      www.OnInjuryResources.ca
You can also read