National Prescribing Indicators 2018-2019 - Analysis of Prescribing Data to June 2018 - AWMSG
←
→
Page content transcription
If your browser does not render page correctly, please read the page content below

National Prescribing
Indicators 2018–2019
Analysis of Prescribing Data to June 2018
This report has been prepared by the Welsh Analytical
Prescribing Support Unit (WAPSU), part of the All Wales
Therapeutics and Toxicology Centre (AWTTC).
Please direct any queries to AWTTC:
All Wales Therapeutics and Toxicology Centre (AWTTC)
University Hospital Llandough
Penlan Road
Llandough
Vale of Glamorgan
CF64 2XX
awttc@wales.nhs.uk
029 2071 6900
National Prescribing Indicators 2018–2019. Analysis of Prescribing Data to June 2018

                                                                     EXECUTIVE SUMMARY

The All Wales Medicines Strategy Group (AWMSG) has endorsed the National Prescribing Indicators (NPIs) as a means of promoting safe and cost-effective
prescribing since 2003. NPIs for 2018–2019 include indicators for primary and secondary care, and have been categorised as safety, stewardship or efficiency
indicators.

Background information supporting the choice of NPIs is detailed in the document National Prescribing Indicators 2018–2019.

This report contains data relating to the NPIs for the first quarter of 2018–2019. Unit of measure and targets for each NPI are included in Appendix 1 and primary
care NPI prescribing data for GP clusters is presented in Appendix 2.

SAFETY INDICATORS
For 2018–2019 there are four safety NPIs:
     •   The Prescribing Safety Indicators in primary care are new for 2018–2019, no targets have been set for these indicators.
     •   Prescribing of hypnotics and anxiolytics (ADQs per 1,000 STAR-PUs) in primary care reduced by 7.16% across Wales, compared with the equivalent
         quarter of the previous year.
     •   Analgesics in primary care:
              o Tramadol (DDDs per 1,000 patients) reduced by 8.31% across Wales, compared with the equivalent quarter of the previous year.
              o Opioid patches (as a percentage of all opioid prescribing) reduced by 2.45% across Wales, compared with the equivalent quarter of the previous
                  year.
              o Gabapentin and pregabalin (DDDs per 1,000 patients) demonstrated an increase of 7.51% across Wales, compared with the equivalent quarter
                  of the previous year, despite the aim of the indicator being to reduce prescribing.
     •   Yellow Card reporting. Annual targets have been set for these indicators, with the aim of increasing the number of Yellow Card reports submitted. Quarter
         one data demonstrates:
              o A 36% increase in reporting by GP practices across Wales, compared with the equivalent quarter of the previous year.
              o A 42% reduction in secondary care reporting across Wales, compared with the equivalent quarter of the previous year.
              o A 4% increase in reporting by health boards across Wales, compared with the equivalent quarter of the previous year.
              o A 9% increase in reporting by members of the public across Wales, compared with the equivalent quarter of the previous year.
              o The number of reports summited by community pharmacy are also included in the report; however, targets have not been set.

STEWARDSHIP INDICATORS
Stewardship indicators for 2018–2019 focus on antimicrobial prescribing in primary and secondary care, with the aim of reducing inappropriate prescribing and
variation in primary care, and encouraging appropriate antimicrobial prophylaxis for colorectal surgical patients in secondary care. Specific targets have been set
for these indicators, either at health board or GP practice level:
     •    Total antibacterial items per 1,000 STAR-PUs in primary care: Six out of the seven health boards achieved the target of a 5% reduction against the
          baseline of quarter 1 2016–2017.
     •    4C (co-amoxiclav, cephalosporins, fluoroquinolones and clindamycin) antimicrobial prescribing in primary care includes two measures which should be
          considered together:
               o The number of 4C items per 1,000 patients decreased across Wales by 13.7%, compared with the baseline of quarter 1 2016–2017.
               o The number of 4C items as a percentage of total antibacterial items reduced across Wales by 6.42%, compared with the baseline of quarter 1
                   2016–2017.
     •    The proportion of elective colorectal patients receiving a single dose antimicrobial for surgical prophylaxis in secondary care: one health board achieved
          the target of an absolute measure of ≥90%, or a proportional increase of 20%, compared with the equivalent quarter of 2017–2018.

                                                                                                                                                           Page 1 of 40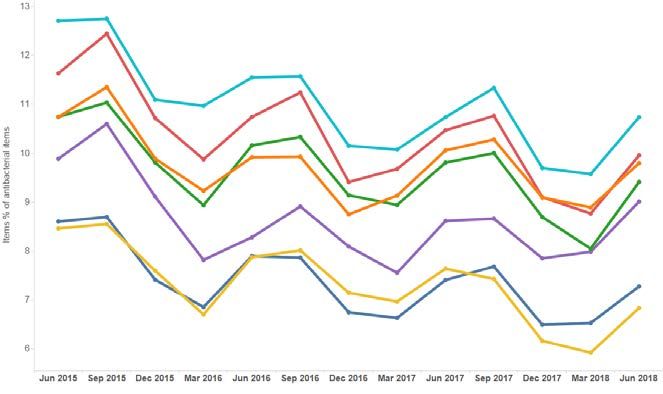
Welsh Analytical Prescribing Support Unit

   EFFICIENCY INDICATORS
   There are three efficiency indicators for 2018–2019, covering primary and secondary care:
       •   Proton pump inhibitor (PPI) prescribing (DDDs per 1,000 PUs) in primary care, which aims to encourage appropriate use of PPIs, demonstrated a 3.44%
           reduction across Wales compared with the equivalent quarter of 2017–2018.
       •   Prescribing of long-acting insulin analogues increased in secondary care compared with the equivalent quarter of the previous year; however, there was
           a decrease in primary care usage, in line with the aim of the NPI.
       •   There was an increase in the overall use of each of the four biosimilar medicines being monitored (infliximab, etanercept, rituximab, insulin glargine)
           compared with the equivalent quarter of the previous year, in line with the aim of the NPI.

The 2018–2019 NPI report for quarter ending September 2018 will be available on 25th January 2019.

  SHARE – AWTTC’s Online Community

Please sign up to SHARE – AWTTC’s Online Community to share and discuss examples of good practice: https://share.awttc.org/

Page 2 of 40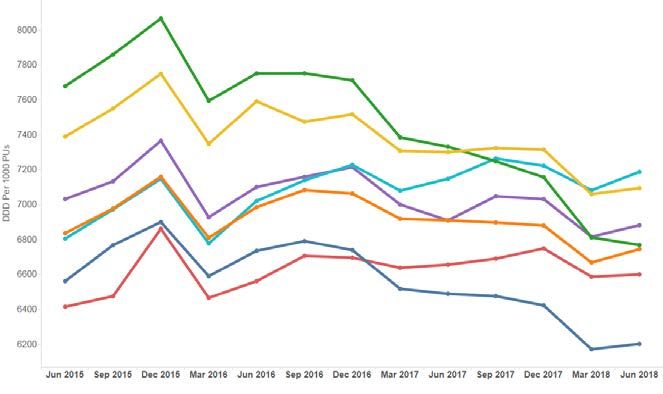
National Prescribing Indicators 2018–2019. Analysis of Prescribing Data to June 2018

CONTENTS

   HEALTH BOARDS/PRACTICES ACHIEVING INDICATOR TARGETS/THRESHOLDS ...........................................................................5

SAFETY INDICATORS ................................................................................................................................................................................6

   1.0 PRESCRIBING SAFETY INDICATORS..............................................................................................................................................6

   2.0 HYPNOTICS AND ANXIOLYTICS ......................................................................................................................................................8

   3.0 ANALGESICS .....................................................................................................................................................................................8

      3.1 Tramadol .........................................................................................................................................................................................9

      3.2 Opioid patches ................................................................................................................................................................................9

      3.3 Gabapentin and pregabalin ...........................................................................................................................................................11

   4.0 YELLOW CARD REPORTING ..........................................................................................................................................................12

STEWARDSHIP INDICATORS ..................................................................................................................................................................15

   5.0 ANTIMICROBIAL STEWARDSHIP ...................................................................................................................................................15

      5.1 Total antibacterial items.................................................................................................................................................................15

      5.2 4C antimicrobials ...........................................................................................................................................................................16

      5.3 Prophylaxis in colorectal surgery ...................................................................................................................................................18

EFFICIENCY INDICATORS .......................................................................................................................................................................19

   6.0 PROTON PUMP INHIBITORS ..........................................................................................................................................................19

   7.0 INSULIN ...........................................................................................................................................................................................20

   8.0 BIOSIMILARS ...................................................................................................................................................................................23

      2.1 Infliximab .......................................................................................................................................................................................24

                                                                                                                                                                                             Page 3 of 40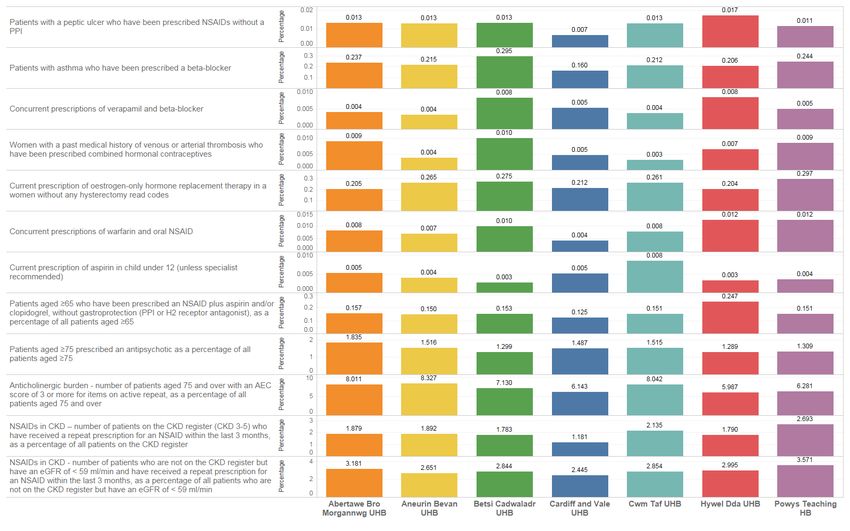
Welsh Analytical Prescribing Support Unit

     2.2 Etanercept .....................................................................................................................................................................................25

     2.3 Rituximab ......................................................................................................................................................................................26

     2.4 Insulin glargine ..............................................................................................................................................................................27

     2.5 Total biosimilar usage ...................................................................................................................................................................28

  CAUTION WITH INTERPRETING NPI MONITORING DATA .................................................................................................................29

  GLOSSARY ............................................................................................................................................................................................30

  APPENDIX 1. AWMSG NATIONAL PRESCRIBING INDICATORS 2018–2019 .....................................................................................31

  APPENDIX 2. PRIMARY CARE NPI PRESCRIBING BY GP CLUSTER ................................................................................................33

Page 4 of 40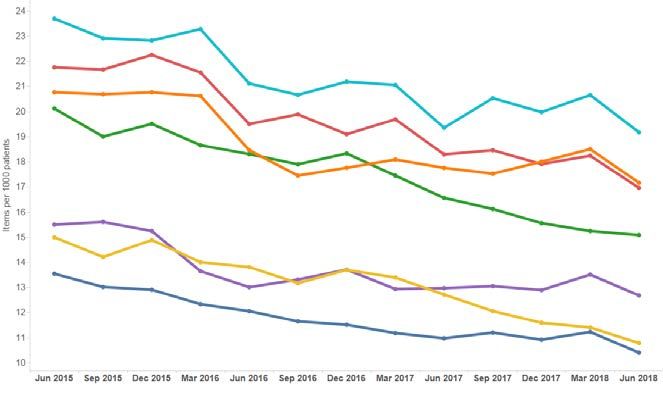
National Prescribing Indicators 2018–2019. Analysis of Prescribing Data to June 2018
HEALTH BOARDS/PRACTICES ACHIEVING INDICATOR TARGETS/THRESHOLDS
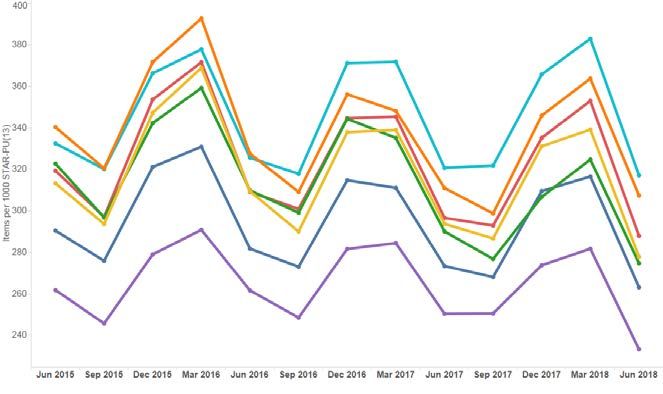
The table below shows the extent to which practices in each health board met the target or indicator thresholds:
• The figure in the cell is the number of practices in each health board meeting the target or indicator threshold.
• The percentage figure and cell colour represent the proportion of practices in each health board meeting the target or indicator threshold.
The targets for antibacterial items per 1,000 STAR-PUs and prophylactic antibiotics in colorectal surgery are by health board, therefore the tick or cross demonstrates
achievement.
Health boards/practices achieving the indicator targets/thresholds – Quarter ending June 2018
Percentage of practices meeting threshold
Page 5 of 40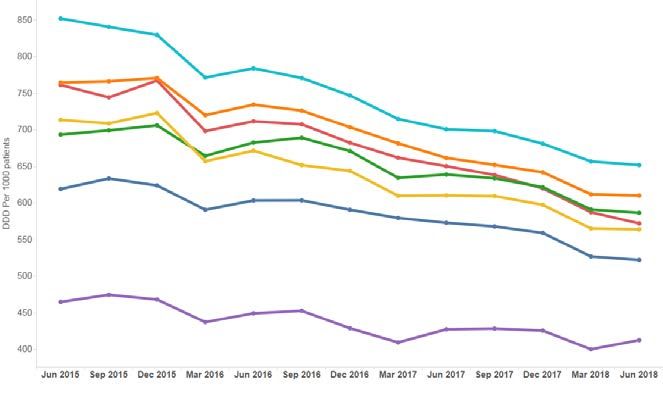
Welsh Analytical Prescribing Support Unit

                                                                                  In the UK, it is estimated that around 6.5% of hospital admissions are related to
SAFETY INDICATORS                                                                 adverse drug reactions (ADRs). ADRs can often be predictable making it possible
                                                                                  to identify potential causes and address them before actual patient harm occurs.
1.0 PRESCRIBING SAFETY INDICATORS                                                 This new NPI for 2018–2019 provides a process of identifying patients
                                                                                  electronically, enabling intervention and helping to avoid patient harm.
 Purpose: To identify patients at high risk of adverse drug reactions (ADRs)
 and medicines-related harm in primary care.                                      No target has been set for this NPI; however, data can provide a baseline for
                                                                                  future quarters.
 Units of measure:
     1. Number of patients with a peptic ulcer who have been prescribed
          NSAIDs without a PPI, as a percentage of all patients.
     2. Number of patients with asthma who have been prescribed a beta-
          blocker, as a percentage of all patients.
     3. Number of patients with concurrent prescriptions of verapamil and a
          beta-blocker, as a percentage of all patients.
     4. Number of female patients with a past medical history of venous or
          arterial thrombosis who have been prescribed combined hormonal
          contraceptives, as a percentage of all female patients.
     5. Number of female patients with a current prescription of oestrogen-
          only hormone replacement therapy without any hysterectomy
          READ/SNOMED codes, as a percentage of all female patients.
     6. Number of patients with concurrent prescriptions of warfarin and an
          oral NSAID, as a percentage of all patients.
     7. Number of patients under 12 with a current prescription of aspirin, as
          a percentage of all patients.
     8. Number of patients aged 65 years or over prescribed an NSAID plus
          aspirin and/or clopidogrel but without gastroprotection (PPI or H2
          receptor antagonist), as a percentage of all patients aged 65 years
          or over.
     9. Number of patients aged 65 years or over prescribed an
          antipsychotic, as a percentage of all patients aged 65 years or over.
     10. Number of patients aged 75 and over with an Anticholinergic Effect
          on Cognition (AEC) score of 3 or more for items on active repeat, as
          a percentage of all patients aged 75 and over.
     11. Number of patients on the CKD register (CKD stage 3–5) who have
          received a repeat prescription for an NSAID within the last 3 months,
          as a percentage of all patients on the CKD register.
     12. Number of patients who are not on the CKD register but have an
          eGFR of < 59 ml/min and have received a repeat prescription for an
          NSAID within the last 3 months, as a percentage of all patients who
          are not on the CKD register but have an eGFR of < 59 ml/min.

 Aim: To review patients identified as being at high risk of ADRs and reduce
 inappropriate prescribing.

Page 6 of 40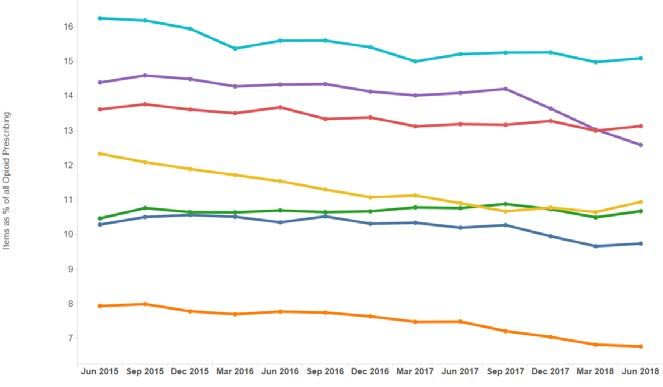
National Prescribing Indicators 2018–2019. Analysis of Prescribing Data to June 2018

Table 1. Prescribing Safety Indicators – Quarter ending June 2018

                                                                                                                                           Page 7 of 40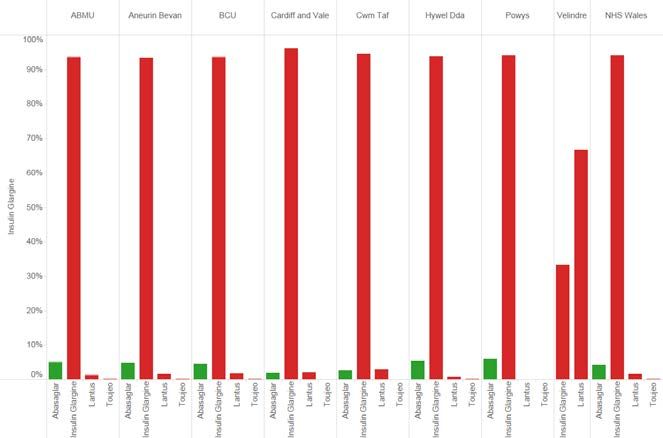
Welsh Analytical Prescribing Support Unit

2.0 HYPNOTICS AND ANXIOLYTICS                                                    Table 2. Hypnotic and anxiolytic ADQs per 1,000 STAR-PUs

                                                                                                                  2017–2018        2018–2019
 Purpose: To encourage a reduction in the inappropriate prescribing of                                                                               % Change
                                                                                                                    Qtr 1            Qtr 1
 hypnotics and anxiolytics in primary care.
                                                                                  Cardiff and Vale                   2,188            1,958           -10.5%
 Unit of measure: Hypnotic and anxiolytic ADQs per 1,000 STAR-PUs.                Hywel Dda                          3,325            3,017           -9.27%
                                                                                  Aneurin Bevan                      3,133            2,843           -9.25%
 Aim: To reduce prescribing
                                                                                  Betsi Cadwaladr                    3,272            3,019           -7.72%
There has been ongoing concern with regard to the high level of hypnotic and      Cwm Taf                            3,621            3,442           -4.96%
anxiolytic prescribing within NHS Wales. Some prescribing may be inappropriate    Powys                              2,171            2,076           -4.36%
and contribute to the problem of physical and psychological dependence, and/or    Abertawe Bro Morgannwg             3,141            3,061           -2.54%
may be responsible for masking underlying depression.
                                                                                  Wales                              3,059            2,840           -7.16%
    •   Across Wales, the prescribing of hypnotics and anxiolytics decreased
        by 7.16% for the quarter ending June 2018 compared with the
        equivalent quarter of the previous year, in line with the aim of this               Figure 1. Trend in hypnotic and anxiolytic prescribing
        indicator.                                                                                        ADQs per 1,000 STAR-PUs
    •   For the quarter ending June 2018, hypnotic and anxiolytic prescribing
        ranged from 1,958 to 3,442 ADQs per 1,000 STAR-PUs across the
        health boards.
    •   The health board with the lowest prescribing was Cardiff and Vale UHB,
        whilst the highest prescribing was seen in Cwm Taf UHB.
    •   Hypnotic and anxiolytic prescribing decreased compared with the
        equivalent quarter of the previous year in all of the health boards.
    •   The largest percentage decrease was seen in Cardiff and Vale UHB,
        and the smallest percentage decrease was seen in Abertawe Bro
        Morgannwg UHB.

Page 8 of 40
National Prescribing Indicators 2018–2019. Analysis of Prescribing Data to June 2018
3.0 ANALGESICS Table 3. Tramadol DDDs per 1,000 patients
There are three NPIs monitoring the usage of medicines used for the treatment 2017–2018 2018–2019
% Change
of pain for 2018–2019: Qtr 1 Qtr 1
1. Tramadol Hywel Dda 650 572 -12.0%
2. Opioid patches
3. Gabapentin and pregabalin Cardiff and Vale 573 522 -8.85%
Betsi Cadwaladr 639 587 -8.19%
3.1 Tramadol Abertawe Bro Morgannwg 662 610 -7.77%
Aneurin Bevan 610 564 -7.60%
Purpose: To encourage the appropriate use and review of tramadol in primary Cwm Taf 701 652 -6.97%
care, minimising the potential dependence, diversion, misuse and ADRs.
Powys 427 413 -3.46%
Unit of measure: Tramadol DDDs per 1,000 patients. Wales 625 573 -8.31%
Aim: To reduce prescribing Figure 2. Trend in tramadol prescribing
DDDs per 1,000 patients
Whilst there is a recognised place in pain management for tramadol, there are
concerns regarding the risks associated with dependence, diversion, misuse and
ADRs. This NPI promotes a prudent approach to prescribing tramadol, taking into
account the risks and benefits, and encouraging timely review.
• Across Wales, prescribing of tramadol was 8.31% lower in the quarter
ending June 2018, than in the equivalent quarter of the previous year.
This is in line with the aim of the indicator.
• For the quarter ending June 2018, tramadol prescribing ranged from
413 to 652 DDDs per 1,000 patients across the health boards.
• The health board with the lowest prescribing was Powys Teaching HB,
whilst the highest prescribing was seen in Cwm Taf UHB.
• Tramadol prescribing decreased compared with the equivalent quarter
of the previous year in all of the health boards.
• The largest percentage decrease was seen in Hywel Dda UHB and the
smallest percentage decrease was seen in Powys Teaching HB.
Page 9 of 40Welsh Analytical Prescribing Support Unit
3.2 Opioid patches Table 4. Opioid patch items as a percentage of all opioid prescribing
Purpose: To encourage the appropriate use and review of opioid patches in 2017–2018 2018–2019
% Change
primary care, minimising the potential for diversion, misuse and ADRs. Qtr 1 Qtr 1
Powys 14.1 12.6 -10.6%
Unit of measure: Opioid patch items as a percentage of all opioid prescribing. Abertawe Bro Morgannwg 7.49 6.77 -9.55%
Aim: To reduce prescribing Cardiff and Vale 10.2 9.74 -4.51%
Betsi Cadwaladr 10.8 10.7 -0.82%
Opioid patches are recommended as a treatment option only where analgesic Cwm Taf 15.2 15.1 -0.79%
requirements are stable and where oral opioids are unsuitable. Prescribers Hywel Dda 13.2 13.1 -0.43%
should make evidence-based, informed decisions based on the individual needs
Aneurin Bevan 10.9 10.9 0.34%
of the patient. Prescribers should ensure that when an opioid patch is indicated,
the patch with the lowest acquisition cost is initiated. Wales 11.1 10.8 -2.45%
• Across Wales, use of opioid patches as a percentage of all opioid Figure 3. Trend in opioid patch items as a percentage of all opioid
prescribing was 2.45% lower in the quarter ending June 2018 than in prescribing
the equivalent quarter of the previous year. This is in line with the aim
of the indicator.
• For the quarter ending June 2018, the proportion of opioid patch
prescribing ranged from 6.77% to 15.1%.
• The health board with the lowest proportion was Abertawe Bro
Morgannwg UHB, whilst the highest proportion was seen in Cwm Taf
UHB.
• The proportion of opioid patches prescribed decreased compared with
the equivalent quarter of the previous year in six out of the seven health
boards.
• The largest percentage decrease was seen in Powys Teaching HB.
Aneurin Bevan UHB demonstrated a small increase in prescribing.
Page 10 of 40National Prescribing Indicators 2018–2019. Analysis of Prescribing Data to June 2018
3.3 Gabapentin and pregabalin Table 5. Gabapentin and pregabalin DDDs per 1,000 patients
Purpose: To encourage the appropriate use and review of gabapentin and 2017–2018 2018–2019
% Change
pregabalin, minimising the potential for dependence, diversion, misuse and Qtr 1 Qtr 1
ADRs. Hywel Dda 1,305 1,364 4.51%
Cardiff and Vale 1,041 1,090 4.73%
Unit of measure: Gabapentin and pregabalin DDDs per 1,000 patients.
Betsi Cadwaladr 1,248 1,323 6.05%
Aim: To reduce prescribing Powys 1,045 1,111 6.33%
Aneurin Bevan 1,639 1,760 7.38%
Gabapentin and pregabalin have a well-defined role in the management of a Cwm Taf 1,787 1,964 9.90%
number of conditions including epilepsy and neuropathic pain, and pregabalin
Abertawe Bro Morgannwg 1,520 1,692 11.3%
also has a role in treatment of generalised anxiety disorder. Both gabapentin and
pregabalin have known psychiatric side effects and there is a potential risk of Wales 1,384 1,488 7.51%
dependence, diversion, misuse and ADRs. Prescribers should make evidence-
based, informed decisions on whether to prescribe, taking into account the risks Figure 4. Trend in gabapentin and pregabalin prescribing
and benefits of these medicines. DDDs per 1,000 patients
• Across Wales, for the quarter ending June 2018, prescribing of
gabapentin and pregabalin increased by 7.51% compared with the
same quarter of the previous year.
• For the quarter ending June 2018, gabapentin and pregabalin
prescribing ranged from 1,090 to 1,964 DDDs per 1,000 patients across
the health boards.
• The health board with the lowest prescribing was Cardiff and Vale UHB,
whilst the highest prescribing was seen in Cwm Taf UHB.
• Gabapentin and pregabalin prescribing increased compared with the
equivalent quarter of the previous year in all of the health boards.
• The smallest percentage increase was seen in Hywel Dda UHB and the
largest percentage increase was seen in Abertawe Bro Morgannwg
UHB.
Page 11 of 40Welsh Analytical Prescribing Support Unit
4.0 YELLOW CARD REPORTING GP practices
• The number of Yellow Cards submitted by GP practices in Wales
increased by 36% compared with the equivalent quarter of the previous
Purpose: To encourage an increase in the number of Yellow Cards submitted year.
in Wales.
• The largest percentage increase in GP practice Yellow Card reporting
was seen in Cwm Taf UHB. The largest percentage decrease was seen
Unit of measure: Number of Yellow Cards submitted per GP practice, per
in Aneurin Bevan UHB.
hospital, per health board and by members of the public.
Number of Yellow Cards submitted by community pharmacies, by health Table 6. Number of Yellow Cards submitted by GP practices
board.
2017–2018 2018–2019
Aim: To increase reporting % Change
Qtr 1 Qtr 1
Cwm Taf 7 55 686%
The Yellow Card Scheme is vital in helping the Medicines and Healthcare
Hywel Dda 31 108 248%
products Regulatory Agency (MHRA) monitor the safety of medicines and
vaccines that are on the market. Abertawe Bro Morgannwg 62 87 40%
Betsi Cadwaladr 90 113 26%
Yellow Card reporting supports the identification and collation of ADRs, which Cardiff and Vale 88 71 -19%
might not have been known about before.
Powys 5 4 -20%
A strong safety culture requires good reporting of adverse events and critical Aneurin Bevan 76 50 -34%
incidents from across all professions and healthcare settings, as well as from Wales 359 488 36%
patients.
Figure 5. Number of Yellow Cards submitted by GP practices per 100,000
health board population
Page 12 of 40National Prescribing Indicators 2018–2019. Analysis of Prescribing Data to June 2018
Secondary care Health boards
• The number of Yellow Cards submitted by secondary care decreased • The number of Yellow Cards submitted by health boards increased by
by 42% compared with the equivalent quarter of the previous year. 4% compared with the equivalent quarter of the previous year.
• The largest percentage increase in secondary care reporting was seen • The largest percentage increase in health board reporting was seen in
in Powys Teaching HB. The largest percentage decrease was seen in Cwm Taf UHB. The largest percentage decrease was seen in Cardiff
Hywel Dda UHB. and Vale UHB.
Table 7. Number of Yellow Cards submitted by secondary care Table 8. Number of Yellow Cards submitted by health board/NHS Trust
2017–2018 2018–2019 2017–2018 2018–2019
% Change % Change
Qtr 1 Qtr 1 Qtr 1 Qtr 1
Powys 1 3 200% Cwm Taf 28 70 150%
Abertawe Bro Morgannwg 10 16 60% Hywel Dda 106 139 31%
Aneurin Bevan 14 16 14% Abertawe Bro Morgannwg 90 118 31%
Betsi Cadwaladr 42 31 -26% Betsi Cadwaladr 159 163 3%
Cwm Taf 7 4 -43% Powys 11 9 -18%
Cardiff and Vale 70 26 -63% Aneurin Bevan 109 89 -18%
Hywel Dda 66 21 -68% Cardiff and Vale 177 115 -35%
Velindre 0 4 N/A Velindre 0 4 N/A
Wales 210 121 -42% Wales 680 707 4%
Figure 6. Number of Yellow Cards submitted by secondary care – Quarter Figure 7. Number of Yellow Cards submitted by health boards per 100,000
ending June 2018 versus quarter ending June 2017 health board population
Page 13 of 40Welsh Analytical Prescribing Support Unit
Members of the public Community pharmacy
• The number of Yellow Cards submitted by members of the public • Across Wales, a total of 13 Yellow Card reports were submitted by
increased by 9% compared with the equivalent quarter of the previous community pharmacies during the quarter ending June 2018.
year. • The number of Yellow Card reports submitted by community
• The largest percentage increase in member of the public reporting was pharmacies ranged from 5 to 0.
seen in Cardiff and Vale UHB. The largest percentage decrease was
seen in Powys Teaching HB. Table 10. Number of Yellow Cards submitted by community pharmacies
Table 9. Number of Yellow Cards submitted by members of the public 2018–2019 Qtr 1
2017–2018 2018–2019 Aneurin Bevan 5
% Change
Qtr 1 Qtr 1 Cwm Taf 1
Cardiff and Vale 8 14 75% Hywel Dda 1
Aneurin Bevan 14 16 14% Abertawe Bro Morgannwg 1
Abertawe Bro Morgannwg 11 12 9% Betsi Cadwaladr 2
Cwm Taf 8 8 0% Cardiff and Vale 3
Betsi Cadwaladr 14 13 -7% Powys 0
Hywel Dda 7 6 -14% Wales 13
Powys 3 2 -33%
Figure 9. Number of Yellow Cards submitted by community pharmacy –
Wales 65 71 9%
Quarter ending June 2018
Figure 8. Number of Yellow Cards submitted by members of the public –
Quarter ending June 2018 versus quarter ending June 2017
Page 14 of 40National Prescribing Indicators 2018–2019. Analysis of Prescribing Data to June 2018
Table 11. Total antibacterial items per 1,000 STAR-PUs
STEWARDSHIP INDICATORS
2016–2017 2018–2019
5.0 ANTIMICROBIAL STEWARDSHIP Qtr 1 Qtr 1
% Change
Betsi Cadwaladr 310 275 -11.3%
There are three antimicrobial NPIs for 2018–2019: Powys 262 233 -10.8%
1. Total antibacterial items per 1,000 STAR-PUs Aneurin Bevan 309 278 -10.2%
2. 4C antimicrobials (co-amoxiclav, cephalosporins, fluoroquinolones and
clindamycin) Hywel Dda 309 288 -6.86%
a. Items per 1,000 patients Cardiff and Vale 282 263 -6.60%
b. Items as a percentage of total antibacterial prescribing Abertawe Bro Morgannwg 328 307 -6.15%
3. Proportion of elective colorectal patients receiving a single dose
antimicrobial for surgical prophylaxis. Cwm Taf 326 317 -2.60%
Wales 308 283 -8.06%
5.1 Total antibacterial items
Figure 10. Trend in antibacterial prescribing items per 1,000 STAR-PUs
Purpose: To encourage the appropriate prescribing of all antibiotics in primary
care.
Unit of measure: Total antibacterial items per 1,000 STAR-PUs.
Aim: To reduce prescribing
• Across Wales, for the quarter ending June 2018, total antibacterial items
per 1,000 STAR-PU reduced by 8.06%, compared with the quarter
ending June 2016. This is in line with the indicator target.
• For the quarter ending June 2018, the total number of antibacterial items
per 1,000 STAR-PUs ranged from 233 to 317 across the health boards.
• The health board with the lowest prescribing was Powys Teaching HB,
whilst the highest prescribing was seen in Cwm Taf UHB.
• For the quarter ending June 2018, six out of the seven health boards
achieved the target of a 5% reduction against the baseline of quarter 1
2016–2017. The health board that did not achieve the target was Cwm
Taf UHB.
• Betsi Cadwaladr UHB demonstrated the greatest percentage reduction
in prescribing, compared with June quarter 2016.
• Cwm Taf UHB demonstrated the smallest percentage reduction in
prescribing, compared with June quarter 2016.
Page 15 of 40Welsh Analytical Prescribing Support Unit
5.2 4C antimicrobials Table 12. 4C antimicrobial items per 1,000 patients
Purpose: To encourage a reduction in variation and reduce overall 2016–2017 2018–2019
% Change
prescribing of the 4C antimicrobials (co-amoxiclav, cephalosporins, Qtr 1 Qtr 1
fluoroquinolones and clindamycin). Aneurin Bevan 13.8 10.8 -21.9%
Betsi Cadwaladr 18.3 15.1 -17.6%
Unit of measure: This antibacterial indicator is monitored using two measures
which should be considered together: Cardiff and Vale 12.1 10.4 -13.7%
1. 4C items per 1,000 patients Hywel Dda 19.5 17.0 -13.0%
2. 4C items as a percentage of total antibacterial items Cwm Taf 21.1 19.2 -9.17%
Aim: To reduce prescribing Abertawe Bro Morgannwg 18.5 17.2 -7.00%
Powys 13.0 12.7 -2.53%
Wales 16.7 14.4 -13.7%
The use of simple generic antibiotics and the avoidance of these broad-spectrum Figure 11. Trend in 4C antimicrobial items per 1,000 patients
antibiotics preserve them from resistance and reduce the risk of C. difficile, MRSA
and resistant urinary tract infections.
5.2.1 4C antimicrobial items per 1,000 patients
• Across Wales, for the quarter ending June 2018, the number of 4C
antimicrobial items per 1,000 patients decreased by 13.7%, compared
with the quarter ending June 2016, in line with the aim of this indicator.
• For the quarter ending June 2018, 4C prescribing ranged from 10.4 to
19.2 items per 1,000 patients across the health boards.
• The health board with the lowest prescribing was Cardiff and Vale UHB,
whilst the highest prescribing was seen in Cwm Taf UHB.
• 4C prescribing decreased, compared with quarter ending June 2016, in
all seven health boards.
• The largest percentage decrease was seen in Aneurin Bevan UHB.
• The smallest percentage decrease was seen in Powys Teaching HB.
Page 16 of 40National Prescribing Indicators 2018–2019. Analysis of Prescribing Data to June 2018
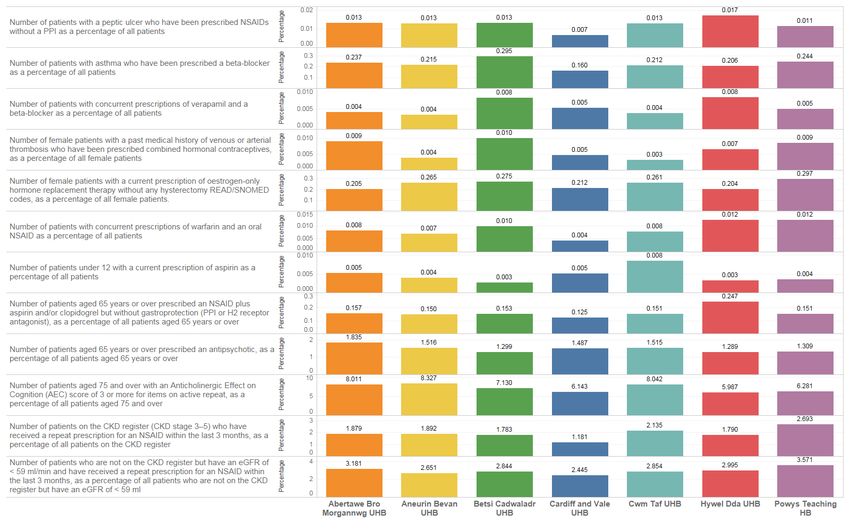
5.2.2 4C antimicrobials as a percentage of total antibacterial items Table 13. 4C antimicrobial items as a percentage of total antibacterial items
• Across Wales, for the quarter ending June 2018, the number of 4C
antimicrobials as a percentage of total antibacterial items decreased by 2016–2017 2018–2019
6.42%, compared with the quarter ending June 2016, in line with the % Change
Qtr 1 Qtr 1
aim of this indicator. Aneurin Bevan 7.87 6.84 -13.2%
• For the quarter ending June 2018, the number of 4C antimicrobials as
a percentage of total antibacterial items ranged from 6.84% to 10.7% Cardiff and Vale 7.90 7.28 -7.84%
across the health boards. Betsi Cadwaladr 10.2 9.41 -7.35%
• The health board with the lowest percentage was Aneurin Bevan UHB, Hywel Dda 10.7 10.0 -7.33%
whilst the highest percentage was seen in Cwm Taf UHB.
Cwm Taf 11.5 10.7 -7.02%
• For the quarter ending June 2018, the percentage of 4C antimicrobials
decreased in six out of the seven health boards, compared with June Abertawe Bro Morgannwg 9.92 9.80 -1.22%
quarter 2016. Powys 8.28 9.01 8.81%
• The health board with the greatest percentage reduction, compared with Wales 9.51 8.90 -6.42%
June quarter 2016, was Aneurin Bevan UHB.
• Powys Teaching HB demonstrated an increase, compared with June
quarter 2016.
Figure 12. Trend in 4C antimicrobial items as a percentage of total
antibacterial items
Page 17 of 40Welsh Analytical Prescribing Support Unit
5.3 Prophylaxis in colorectal surgery Table 14. Percentage of patients receiving a single dose antimicrobial for
colorectal surgical prophylaxis
Purpose: To encourage appropriate antimicrobial prophylaxis for colorectal
surgical patients in secondary care. 2017–2018 2018–2019
% Change
Qtr 1 Qtr 1
Unit of measure: Proportion of elective colorectal patients receiving a single Abertawe Bro Morgannwg 70 80 14%
dose antimicrobial for surgical prophylaxis. Aneurin Bevan 80 85 6%
Aim: To increase percentage Hywel Dda 65 64 -2%
Cardiff and Vale 100 90 -10%
Due to surgical prophylaxis numbers being small and prone to misinterpretation Betsi Cadwaladr 95 76 -20%
at hospital level, the data are presented at health board level. Hospital level data Cwm Taf 90 67 -25%
are available if required. Wales 82 78 -5%
• Across Wales, there was a 5% decrease in the percentage of patients
Figure 13. Percentage of patients receiving a single dose antimicrobial for
receiving a single dose antimicrobial for colorectal surgical prophylaxis colorectal surgical prophylaxis
for quarter ending June 2018 compared with the equivalent quarter of
the previous year.
• For the quarter ending June 2018, the percentage of patients receiving
a single dose antimicrobial for colorectal surgical prophylaxis ranged
from 64% to 90% across the health boards.
• The health board with the highest proportion of patients receiving a
single dose antimicrobial for colorectal surgical prophylaxis was Cardiff
and Vale UHB whilst the lowest was Hywel Dda UHB.
• Cardiff and Vale UHB was the only health board to achieve the target
for quarter ending June 2018.
• Abertawe Bro Morgannwg UHB and Aneurin Bevan UHB had an
increase in the proportion of patients receiving a single dose
antimicrobial for colorectal surgical prophylaxis, compared with the
equivalent quarter of the previous year.
• There was a decrease in the proportion of patients receiving a single
dose antimicrobial for colorectal surgical prophylaxis for the other four
health boards.
Page 18 of 40National Prescribing Indicators 2018–2019. Analysis of Prescribing Data to June 2018
Table 15. PPI DDDs per 1,000 PUs
EFFICIENCY INDICATORS
2017–2018 2018–2019
6.0 PROTON PUMP INHIBITORS Qtr 1 Qtr 1
% Change
Betsi Cadwaladr 7.332 6,769 -7.67%
Purpose: To encourage appropriate use of proton pump inhibitors (PPIs) in
primary care. Cardiff and Vale 6,490 6,203 -4.43%
Aneurin Bevan 7,301 7,095 -2.82%
Unit of measure: PPI DDDs per 1,000 PUs. Abertawe Bro Morgannwg 6,910 6,745 -2.39%
Hywel Dda 6,657 6,600 -0.85%
Aim: To reduce prescribing
Powys 6,910 6,882 -0.40%
Although PPIs are generally well tolerated, there is emerging evidence that Cwm Taf 7,148 7,188 0.55%
serious adverse effects may be linked with long-term PPI use. These include Wales 7,006 6,765 -3.44%
fractures of the hip, wrist and spine, Clostridium difficile infection, and
hypomagnesaemia. Prescribers are therefore encouraged to review and reduce Figure 14. Trend in PPI prescribing DDDs per 1,000 PUs
where possible.
• Across Wales, for the quarter ending June 2018, PPI DDDs per 1,000
PUs decreased by 3.44%, compared with the quarter ending June 2017,
in line with the aim of this indicator
• For the quarter ending June 2018, PPI usage ranged from 6,203 to
7,188 DDDs per 1,000 PUs across the health boards.
• The health board with the lowest prescribing was Cardiff and Vale UHB
whilst the highest prescribing was seen in Cwm Taf UHB.
• Six out of the seven health boards demonstrated a reduction in DDDs
per 1,000 PUs, compared with the equivalent quarter of the previous
year.
• Betsi Cadwaladr UHB demonstrated the largest percentage decrease.
• Cwm Taf UHB demonstrated a small increase in prescribing.
Page 19 of 40Welsh Analytical Prescribing Support Unit 7.0 INSULIN Purpose: To encourage a reduction in the prescribing of long-acting insulin analogues in line with NICE guidance to maximise cost-effectiveness in Wales. Unit of measure: Items/number of long-acting insulin analogues expressed as a percentage of total long- and intermediate-acting insulin prescribed in primary and secondary care. Aim: To reduce prescribing NICE guidance recommends human isophane (neutral protamine Hagedorn [NPH]) insulin as the first choice insulin-based treatment when prescribing insulin in type 2 diabetes mellitus. For most people with type 2 diabetes, long-acting insulin analogues offer no significant benefit over human isophane insulin and are more expensive. This report considers data sets from both secondary and primary care, as prescribing will usually be continued in the primary care setting following secondary care initiation. Page 20 of 40
National Prescribing Indicators 2018–2019. Analysis of Prescribing Data to June 2018

Secondary care prescribing                                                              Table 16. Long-acting insulin analogues as a percentage of total long- and
 •  Across Wales, secondary care use of long-acting insulin as a percentage of          intermediate-acting insulin prescribing in secondary care
    all long- and intermediate-acting insulin prescribing was 0.41% higher in the
    quarter ending June 2018 than in the equivalent quarter of the previous                                              2017–2018       2018–2019
    year.                                                                                                                                              % Change
                                                                                                                           Qtr 1           Qtr 1
 •  For the quarter ending June 2018, prescribing of long-acting insulin                 Abertawe Bro Morgannwg             86.1            81.2         -5.69%
    analogues as a percentage of total long- and intermediate-acting insulin
    ranged from 54.3% to 84.0%.                                                          Cardiff and Vale                   71.3            69.9         -1.96%
 •  The health board/trust with the lowest prescribing percentage was Cwm Taf            Aneurin Bevan                      66.0            65.6         -0.61%
    UHB. The highest prescribing percentage was seen in Hywel Dda UHB.                   Hywel Dda                          83.4            84.0         0.72%
 •  The proportion of long-acting insulin analogue prescribing decreased in
                                                                                         Betsi Cadwaladr                    75.0            77.3         3.07%
    three of the seven health boards/trusts, compared with the equivalent
    quarter of the previous year.                                                        Cwm Taf                            52.3            54.3         3.82%
 •  The health board/trust with the greatest percentage decrease was                     Velindre                           33.3            75.0         125%
    Abertawe Bro Morgannwg UHB.                                                          Wales                              72.7            73.0         0.41%
 •  Velindre Trust showed the greatest percentage increase; however, usage
    in this trust is very low, so percentage changes are likely to show a greater
                                                                                          Figure 15. Trend in long-acting analogue prescribing as a percentage of
    magnitude of fluctuation between comparative periods. Cwm Taf UHB had
                                                                                          total long- and intermediate-acting insulin prescribed in secondary care
    the next highest percentage increase at 3.82%.

                                                                                                                                                     Page 21 of 40
Welsh Analytical Prescribing Support Unit
Primary care prescribing Table 17. Long-acting insulin analogues as a percentage of total long- and
• Across Wales, the prescribing of long-acting insulin analogues as a intermediate-acting insulin prescribing in primary care
proportion of total long- and intermediate-acting insulin prescribing
decreased by 0.85% for the quarter ending in June 2018, compared with 2017–2018 2018–2019
the equivalent quarter of the previous year. This is in line with the aim % Change
Qtr 1 Qtr 1
of the indicator. Cwm Taf 78.7 75.9 -3.50%
• For the quarter ending June 2018, long-acting insulin analogue
prescribing ranged from 75.9% to 94.8% across the health boards. Cardiff and Vale 88.6 86.0 -2.93%
• The health board with the lowest prescribing was Cwm Taf UHB, whilst Betsi Cadwaladr 91.4 90.3 -1.17%
the highest prescribing was seen in Abertawe Bro Morgannwg UHB. Aneurin Bevan 85.4 84.6 -0.83%
• Across the seven health boards in Wales prescribing decreased
Hywel Dda 93.8 93.9 0.14%
compared with the equivalent quarter of the previous year in four health
boards and increased in three health boards. Abertawe Bro Morgannwg 93.9 94.8 1.01%
• The health board/trust with the greatest percentage decrease was Cwm Powys 86.6 89.5 3.29%
Taf UHB. Wales 88.9 88.1 -0.85%
• The largest percentage increase was seen in Powys Teaching HB.
Figure 16. Trend in long-acting analogue prescribing as a percentage of
total long- and intermediate-acting insulin prescribed in primary care
Page 22 of 40National Prescribing Indicators 2018–2019. Analysis of Prescribing Data to June 2018
8.0 BIOSIMILARS There is an increasing range of biosimilar products becoming available and
therefore new products will be monitored and reported on in this section of the
NPI report as they begin to be used within NHS Wales.
Purpose: To ensure prescribing of biological medicines supports cost-
effective prescribing in Wales. MHRA guidelines state that biological medicines, including biosimilar medicines,
must be prescribed by brand name to prevent automatic substitution taking place
Unit of measure: Quantity of biosimilar medicines prescribed as a percentage without clinician and patient involvement, and to support ongoing
of total ‘reference’ product plus biosimilar. pharmacovigilance of the individual products.
Aim: Increase the appropriate use of cost-effective biological medicines,
including biosimilar medicines.
Biological medicines are those that are made or derived from a biological source
and, as such, are complex, with inherent variability in their structure. A biosimilar
medicine is a biological medicine that is developed to be highly similar and
clinically equivalent to an existing biological medicine (i.e. ‘reference’ medicine
or ‘originator’ medicine). Continuing development of biosimilar medicines offers
an increased choice for patients and clinicians.
Page 23 of 40Welsh Analytical Prescribing Support Unit
2.1 Infliximab 2.1.1 Secondary care
Within Wales there was an increase in the use of the infliximab biosimilar Six health boards show biosimilar infliximab prescribing in secondary care. All six
(Inflectra®) as a percentage of all infliximab for the quarter ending June 2018 of these health boards use the biosimilar for the majority of their supplies.
compared with the equivalent quarter of the previous year, from 60.5% to 90.5%.
Figure 18. Infliximab reference (Remicade®) and biosimilar (Inflectra®) as a
®)
Table 18. Quantity of infliximab reference (Remicade and biosimilar proportion of total infliximab prescribed in secondary care – Quarter
(Inflectra®) prescribed in NHS Wales ending June 2018
Reference
2017–2018 Qtr 1 2018–2019 Qtr 1 % Change
(Remicade®)Ɨ
Total 2,508 650 -74.1%
Biosimilar
2017–2018 Qtr 1 2018–2019 Qtr 1 % Change
(Inflectra®)
Total 3,839 6,167 60.6%
ƗThese data include supplies recorded through homecare.
*Due to quantity discrepancy in the data set, this number has been estimated.
Table 19. Infliximab biosimilars as a percentage of reference and biosimilar
prescribed
2017–2018 Qtr 1 2018–2019 Qtr 1 % Change
Total 60.5% 90.5% 49.6%
Figure 17. Infliximab reference (Remicade®) and biosimilar (Inflectra®)
percentage change
Page 24 of 40National Prescribing Indicators 2018–2019. Analysis of Prescribing Data to June 2018
2.2 Etanercept 2.2.1 Secondary care
Within Wales there was an increase in the use of the etanercept biosimilar Six health boards show biosimilar etanercept prescribing in secondary care. All
(Benepali®, Erelzi®) as a percentage of all etanercept for the quarter ending June six of these health boards use the biosimilar for the majority of their supplies.
2018 compared with the equivalent quarter of the previous year, from 50.1% to
81.6%.
Figure 20. Etanercept reference (Enbrel®) and biosimilar (Benepali®,
Table 20. Quantity of etanercept reference (Enbrel®) and biosimilar Erelzi®) as a proportion of total etanercept prescribed in secondary care –
(Benepali®, Erelzi®) prescribed in NHS Wales Quarter ending June 2018
Reference
2017–2018 Qtr 1 2018–2019 Qtr 1 % Change
(Enbrel®)Ɨ
Total 9,502 3,840 -59.6%
Biosimilar
2017–2018 Qtr 1 2018–2019 Qtr 1 % Change
(Benepali®, Erelzi®)
Total 9,556 17,076 78.7%
ƗThese data include supplies recorded through homecare.
Table 21. Etanercept biosimilar as a percentage of reference and biosimilar
prescribed
2017–2018 Qtr 1 2018–2019 Qtr 1 % Change
Total 50.1% 81.6% 62.9%
Figure 19. Etanercept reference (Enbrel®) and biosimilar (Benepali®,
Erelzi®) percentage change
Page 25 of 40Welsh Analytical Prescribing Support Unit
2.3 Rituximab 2.3.1 Secondary care
Within Wales there was an increase in the use of the rituximab biosimilar Six health boards show biosimilar rituximab prescribing in secondary care. All six
(Truxima®) as a percentage of all rituximab from 19.3% to 93.1% for quarter of these health boards use the biosimilar for the majority of their supplies.
ending June 2018 compared with the equivalent quarter of the previous year.
Figure 22. Rituximab reference (MabThera®) and biosimilar (Truxima®) as
®)
Table 22. Quantity of rituximab reference (MabThera and biosimilar a proportion of total rituximab prescribed in secondary care – Quarter
(Truxima®) prescribed in NHS Wales ending June 2018
Reference
2017–2018 Qtr 1 2018–2019 Qtr 1 % Change
(MabThera®)Ɨ
Total 1,827 155 -91.5%
Biosimilar
2017–2018 Qtr 1 2018–2019 Qtr 1 % Change
(Truxima®)
Total 437 2,081 376%
ƗThese data include supplies recorded through homecare.
Table 23. Rituximab biosimilar as a percentage of reference and biosimilar
prescribed
2017–2018 Qtr 1 2018–2019 Qtr 1 % Change
Total 19.3% 93.1% 382%
Figure 21. Rituximab reference (MabThera®) and biosimilar (Truxima®)
percentage change
Page 26 of 40National Prescribing Indicators 2018–2019. Analysis of Prescribing Data to June 2018
2.4 Insulin glargine
Within Wales there was an increase in the use of insulin glargine biosimilar Figure 24. Insulin glargine reference (Lantus® and Toujeo®) and biosimilar
(Abasaglar®) for quarter ending June 2018 compared with the equivalent quarter (Abasaglar®) as a proportion of total insulin glargine prescribed – Quarter
of the previous year, from 2.7% to 4.2%. ending June 2018
Table 24. Quantity of insulin glargine reference (Lantus® and Toujeo®) and
biosimilar (Abasaglar®) prescribed
Reference (Lantus® %
2017–2018 Qtr 1 2018–2019 Qtr 1
and Toujeo®) Change
Primary care 194,800 182,405 -6.4%
Secondary care 3,461 3,829 10.6%
Total 198,261 186,234 -6.1%
Biosimilar %
2017–2018 Qtr 1 2018–2019 Qtr 1
(Abasaglar®) Change
Primary care 5,034 7,833 55.6%
Secondary care 533 364 -31.7%
Total 5,567 8,197 47.2%
Table 25. Insulin glargine biosimilar (Abasaglar®) as a percentage of
reference (Lantus® and Toujeo®) and biosimilar prescribed
2017–2018 Qtr 1 2018–2019 Qtr 1 % Change
Primary care 2.5% 4.1% 64.0%
Secondary care 13.3% 8.7% -34.6%
Total 2.7% 4.2% 55.6%
Figure 23. Insulin glargine reference (Lantus® and Toujeo®) and biosimilar
(Abasaglar®) percentage change
Page 27 of 40Welsh Analytical Prescribing Support Unit
2.5 Total biosimilar usage
Within Wales there was an increase in the use of the reported biosimilar
medicines (infliximab, etanercept, rituximab and insulin glargine) combined as a
percentage of reported ‘reference’ biological medicines plus biosimilars
combined, from 8% to 15% for the quarter ending June 2018 compared with the
equivalent quarter of the previous year.
Figure 25. Biological reference and biosimilar as a proportion of total
reference plus biosimilar prescribed – Quarter ending June 2018
Page 28 of 40National Prescribing Indicators 2018–2019. Analysis of Prescribing Data to June 2018
CAUTION WITH INTERPRETING NPI MONITORING DATA
Calculations for the percentage difference reported are based on raw data, and The report includes medicines supplied by homecare and recorded through the
values may therefore vary slightly from those calculated from the data tables or hospital system; medicines supplied through other homecare providers are not
graphs, where figures have been rounded up or down. included in this report. Therefore some medicines use data may currently be
incomplete. This issue is being worked on within NHS Wales as a priority.
Data for the anticholinergic burden and NSAIDs and CKD NPIs have been
provided by Audit+, the GP software tool delivered and supported by the NHS Medicines supplied through hospitals in England or on FP10HP (issued by
Wales Informatics Service (NWIS). hospital clinicians in NHS England) to patients resident in Wales, which do not
get issued via Medusa or recorded through CASPA, are not included in this
The Medusa data warehouse is reliant on data input by individual hospital report.
pharmacy departments. If the data on a medicine are input under an alternative
name to the usual generic or brand name, it may not be identified at extraction. Combining data obtained from two different software systems provides
challenges, particularly as CASPA and Medusa report data via different
Medusa records the issue of medicines within the secondary care setting in measurement criteria. Hence, in order to amalgamate data, total cost of medicine
Wales. Where supplies are issued to named patients, it can be assumed that the usage is reported for all indicators and, where relevant, other measures such as
difference between number of medicines issued and number administered to total quantity, items and number are also reported.
patients is not significant. However, when the supplies are issued to wards or
clinics, these items are often held as stock and therefore may be administered to
patients at a considerably later point in time. However, within this report they are
only considered for analysis within the time period they were issued.
Page 29 of 40Welsh Analytical Prescribing Support Unit
GLOSSARY
ADQ – The average daily quantity (ADQ) is a measure of prescribing volume PRESCRIBING – Although the term ‘prescribing’ is used in this report, the data
based upon prescribing behaviour in England. It represents the assumed presented within the primary care section of the report represent prescriptions
average maintenance dose per day for a medicine used for its main indication in that have been dispensed and forwarded for pricing. It is assumed that the
adults. The ADQ is not a recommended dose but an analytical unit to compare difference between the number of prescriptions issued and those dispensed is
prescribing activity. not significant, and that dispensing provides an accurate representation of
prescribing. In relation to the secondary care data presented within this report
DDD – The defined daily dose (DDD), developed by the World Health please see information above.
Organization, is a unit of measurement whereby each medicine is assigned a
value within its recognised dosage range. The value is the assumed average STAR-PU – Specific therapeutic group age-sex related prescribing units (STAR-
maintenance dose per day for a medicine when used for its main indication in PUs) are designed to measure prescribing weighted for age and sex of patients.
adults. A medicine can have different DDDs depending on the route of There are differences in the age and sex of patients for whom medicines in
administration. specific therapeutic groups are usually prescribed. To make such comparisons,
STAR-PUs have been developed based on costs of prescribing of items within
PU – Prescribing units (PUs) were adopted to take account of the greater need therapeutic groups.
of elderly patients for medication in reporting prescribing performance at both the
practice and primary care organisational level.
Page 30 of 40National Prescribing Indicators 2018–2019. Analysis of Prescribing Data to June 2018
APPENDIX 1. AWMSG NATIONAL PRESCRIBING INDICATORS 2018–2019
National
Prescribing Applicable to: Unit of measure Target for 2018–2019 Data source
Indicator
Safety
Prescribing
Number of patients identified as a percentage of
Safety Primary care No target set Audit+
the practice population
Indicators
Hypnotics and Hypnotic and anxiolytic ADQs per 1,000 STAR- Maintain performance levels within the lower quartile, or show a
Primary care NWSSP
anxiolytics PUs reduction towards the quartile below
Maintain performance levels within the lower quartile, or show a
Tramadol DDDs per 1,000 patients NWSSP
reduction towards the quartile below
Opioid patch items as a percentage of all opioid Maintain performance levels within the lower quartile, or show a
Analgesics Primary care NWSSP
prescribing reduction towards the quartile below
Gabapentin and pregabalin DDDs per 1,000 Maintain performance levels within the lower quartile, or show a
NWSSP
patients reduction towards the quartile below
Primary care One Yellow Card per 2,000 GP practice population
Secondary care In excess of a 20% increase from baseline
In excess of one Yellow Card per 2,000 health board population
Yellow Card
Health board Number of Yellow Cards submitted MHRA
Reporting In excess of a 50% increase from baseline for Yellow Cards
submitted by members of the public
Community No target set.
pharmacy Reported as the number of Yellow Cards submitted by health board.
Stewardship
Health board target: a reduction of 5% against a baseline of April
Primary care Total antibacterial items per 1,000 STAR-PUs NWSSP
2016–March 2017
4C antimicrobials (co-amoxiclav, cephalosporins,
fluoroquinolones and clindamycin):
Absolute measure ≤7% or a proportional reduction of 10% against a
Primary care – the number of 4C items per 1,000 patients NWSSP
Antimicrobial baseline of April 2016–March 2017
– the number of 4C items as a percentage of
stewardship
total antibacterial prescribing.
Data collection
Prophylaxis in colorectal surgery: proportion of
Absolute measure ≥90% or a proportional increase of 20% against by
Secondary care elective colorectal patients receiving a single
performance for 2017–2018 antimicrobial
dose of antimicrobial for surgical prophylaxis
pharmacists
Page 31 of 40Welsh Analytical Prescribing Support Unit
Efficiency
Proton pump Maintain performance levels within the lower quartile, or show a
Primary care PPI DDDs per 1,000 PUs NWSSP
inhibitors reduction towards the quartile below
Quantity of biosimilar medicines prescribed as a
Primary + Increase the appropriate use of cost-effective biological medicines, NWSSP
Biosimilars percentage of total ‘reference’ product plus
secondary care including biosimilar medicines. Medusa
biosimilar
Long-acting Items/number of long-acting insulin analogues
Primary + Reduce prescribing of long-acting insulin analogues and achieve NWSSP
insulin expressed as a percentage of total long- and
secondary care prescribing levels below the Welsh average Medusa
analogues intermediate-acting insulin prescribed
Page 32 of 40National Prescribing Indicators 2018–2019. Analysis of Prescribing Data to June 2018
APPENDIX 2. PRIMARY CARE NPI PRESCRIBING BY GP CLUSTER
Figure 1. Hypnotic and anxiolytic prescribing – Quarter ending June 2018 versus quarter ending June 2017
Page 33 of 40Welsh Analytical Prescribing Support Unit
Figure 2. Tramadol prescribing – Quarter ending June 2018 versus quarter ending June 2017
Page 34 of 40National Prescribing Indicators 2018–2019. Analysis of Prescribing Data to June 2018
Figure 3. Opioid patch prescribing – Quarter ending June 2018 versus quarter ending June 2017
Page 35 of 40Welsh Analytical Prescribing Support Unit
Figure 4. Gabapentin and pregabalin prescribing – Quarter ending June 2018 versus quarter ending June 2017
Page 36 of 40National Prescribing Indicators 2018–2019. Analysis of Prescribing Data to June 2018
Figure 5. Antibacterial prescribing – Quarter ending June 2018 versus quarter ending June 2016
Page 37 of 40Welsh Analytical Prescribing Support Unit
Figure 6. 4C prescribing – Quarter ending June 2018 versus quarter ending June 2016
Page 38 of 40National Prescribing Indicators 2018–2019. Analysis of Prescribing Data to June 2018
Figure 7. 4C prescribing – Quarter ending June 2018 versus quarter ending June 2016
Page 39 of 40You can also read