PRICE INDEX COMPARISONS FOR GROCERY STORES IN ONTARIO AND MONTCLAIR, CALIFORNIA - ASHLEY MCCOY POMONA COLLEGE SEPTEMBER 10, 2010
←
→
Page content transcription
If your browser does not render page correctly, please read the page content below
Price Index Comparisons for Grocery Stores

   In Ontario and Montclair, California

               Ashley McCoy
              Pomona College
             September 10, 2010
Introduction
The Economic Research Service (ERS), a branch of the USDA which deals with the economics of food,
farming, and nutrition in the United States, conducted a study concerning the amount of people who
suffer from food insecurity. As of 2008, 5.7% of the US population (6.7 million people) reported that
they experienced very low food security, or food insecurity with hunger, in their households. This was a
1.6% increase from the 4.1% of the population that reported this amount of food insecurity in 2007. 1
Food insecurity, as defined by the ERS, is “a household-level economic and social condition of
limited or uncertain access to adequate food”. 2 Food security or insecurity is measured by the ERS in
order to gauge how much assistance they may need to provide to communities in the US. The ERS, upon
receiving data showing food insecurity in a community, may be able to provide assistance to this
community through food security programs like community gardens, community-supported agriculture
programs, or farmer’s markets. 3 But the ERS cannot monitor the food security levels for every city,
town, or community in the US. This is where community-based organizations come into play.
The Organization
Uncommon Good, a non-profit organization based in Claremont, California, has made it their mission to
help low-income youth and families. 4 Noticing how many families in the Inland Empire need assistance
with simple expenses such as food, Uncommon Good has taken on the responsibility of collecting food
security data for six cities in the Inland Empire metropolitan area. The ERS provides a Community Food
Security Assessment (CFSA) Toolkit, which is free to all and can be found on their main website. This
toolkit is comprised of different methods with which to research food security in one’s community. Once
1
USDA Economic Research Service "Statistics and Graphics." 16 Nov. 2009. 1 Sept. 2010.
.
2
USDA Economic Research Service "Definitions of Hunger and Food Security." 16 Nov. 2009. 1 Sept. 2010.
.
3
Linda Kantor. "Community Food Security Programs Improve Food Access." Food Review 24.1 (2001): 20‐21. 2
Sept. 2010.
4
Uncommon Good. 2 Sept. 2010. .
2completed, the research will be drafted into a proposal for grant money which would provide enough
monetary assistance to start up the organization’s Pomona Valley Urban Agriculture Initiative (PVUAI).
This initiative will create one-family farms in which each family will be given health benefits and will
have salary pay in exchange for cultivating organic crops that are in demand. These crops will in-turn be
sold to local markets and made accessible, both in location and price, to low-income families in the area
in hopes of alleviating some food insecurity from those communities. 5
Project Location and Partners
The Inland Empire (IE) is a metropolitan area in Southern California consisting of cities in Los Angeles,
San Bernardino, and Riverside Counties. Uncommon Good has chosen to study the cities of Pomona,
Montclair, Ontario, Chino, Fontana, and Rialto, all of which fall within LA or San Bernardino Counties.
There are ten million people living in LA County, but there are no farms. San Bernardino County is the
largest (area-wise) county in the US and has the fourth highest ranking for rates of obesity in the country.
“The PVUAI will be the nearest producer of organic fruits and vegetables for the entire County of Los
Angeles” and “will be one of the few organic producers for San Bernardino County”. 6 These cities are in
dire need of a cheap, local, healthy food option. So far, only data collection for Pomona has been
completed. The Community Food Security Assessment of Pomona, California, an undergraduate thesis,
was completed in April of 2010. 7 This has been the basis of all work in Montclair and Ontario done
during the months of June through August 2010 and will be the basis of much work for the remaining
cities. For purposes of my research, I will only be discussing work done in Montclair and Ontario.
Partners interested in and working on this project include the LA County Fairplex, the Draper
Center for Community Partnerships at Pomona College, California State Polytechnic University at
Pomona, the US Green Building Council, the Tongva Tribe, the Claremont Chamber of Commerce,
Amy’s Farm, and The Garden in Pomona. 8 Much of the data collected for the food assessment through
5
Nancy Mintie, Pomona Valley Urban Agriculture Initiative.
6
ibid.
7
Sam Hanft, "Community Food Security Assessment of Pomona, California." Thesis. Pomona College, 2010.
8
Mintie
3the methods prescribed by the CSFA Toolkit is being collected by the student volunteers at the Draper
Center, Pomona College.
Montclair-Ontario Price Indexing Project
This paper is based on the portion of research done on the food assessment during summer, 2010, which
was conducted in the cities of Montclair and Ontario. Two projects were done simultaneously on these
two cities based on the Toolkit: a project done by a fellow Pomona College student, John Bonacorsi,
based on survey and focus group work with Ontario and Montclair residents, and my specific project
based on the pricing of food in grocery stores recommended by the Toolkit. Price indexing is a method
given by the CSFA Toolkit for price comparison of multiple grocery stores for different types of food
items in each city. This data will show what the pricing trends are for food in a given city and which
types of grocery stores (large, small, supermarket) have the lowest cost items. This information will be
used in the creation of the PVUAI for produce pricing baselines.
Methods
Throughout the many phases of this project, the methods have changed slightly—shifting away from
some aspects of the food assessment survey and leaning on more effective methods of gathering data.
During the data gathering process for the city of Pomona, we started with five different types of data:
price indexes, internet research, focus groups, surveying, and GIS mapping. For purposes of my research,
any information gathered from focus groups, surveying, or GIS mapping for the cities of Montclair and
Ontario will be omitted.
Price Indexes
A price index includes a basic list of foods that can be found in an average household at any time. All
foods are divided into sections or categories based on the type of food (i.e. Fruit, Vegetable, Fats and
Oils, etc.). The purpose of a price index was to record the brand or variety and weight or packaging
4information about the lowest cost option for each food on the list. This was done at multiple stores in
each city being researched for this project.
This method has proven to be fairly helpful in the data gathering process. Uncommon Good’s
goal is to sell the produce grown on plots funded by a USDA grant they are applying for, so the price
index information will give them a basic idea as to how to price their produce when marketing it to
consumers. This essay uses the price index information for the cities of Montclair and Ontario in order to
show the prices of produce, as well as other categories of food from the price index. Unfortunately, price
index information for Pomona was not included in Sam Hanft’s thesis, which was a large contribution to
Uncommon Good’s knowledge for purposes of their grant proposal. It was not seen at the time as a major
need for the project’s sake.
For the city of Montclair we price indexed four stores categorized as either supermarkets or large
stores: Costco, Stater Brother’s, 99¢ Only, and Target. Although the 99¢ Only store and Target sell
limited amounts of food and are not on the same scale of food sales as Costco or Stater Brothers, for the
purpose of this research they have all been analyzed as a group. Montclair is a fairly small city and lacks
grocery stores with large varieties of produce.
Stores indexed in Ontario include the following, which range from supermarkets and large stores
to small grocery and convenience stores: Stater Brother’s, Liborio, Fresh and Easy, Albertson’s, Jax
Market, Ontario Farmer’s Market (a store for mostly produce, not an outdoor farmer’s market), Mother’s
Nutritional Center, and 7-11. Although data was collected for Mother’s Nutritional Center, the number of
items missing from the price index for that store was almost 100% and therefore will not be reported. I
will discuss some of the issues with this store and other health food stores later in the essay.
Many problems arose from price indexing due to the fact that we had so many people work on
this project and no one had any formal training on how to carry out the research techniques. There were
many inconsistencies in data, which made it difficult to transcribe and analyze. Specific inconsistencies
in data will be discussed in the Results section to come.
Internet Research
5Another component listed in the Toolkit, we were assigned multiple data tables about each city. Data
table themes included city demographics, agricultural production or manufacturing that occurs in each
city, and existence or lack of urban gardens/agriculture in each city, as well as many other topics. The
demographic tables and other census data are useful for all cities and can help to establish the income,
primary race/ethnicity, and poverty levels in a city. Many of the other tables, on the other hand, have not
proven to be very helpful for this project. The manufacturing of products does not occur in these cities
and, although there may still be agricultural centers in Chino, Ontario’s agriculture has, for the most part,
been bought out by housing tracts. After compiling all tables for Pomona and partial tables for other
cities, our research group decided that these tables would be little help for our project. Other data
gathered from internet research include lists of stores selling food for both Montclair and Ontario, and
lists of fast food locations for both cities. 9 This data was to be used for our GIS mapping, but the duration
of research did not allow enough time to create legible maps.
The demographic tables used in this project are Tables A1 and A2. 10 The US Census Bureau
provides all information used in these tables. 11 All data for these tables was taken from the 2000 US
Census.
Results and Discussion
Averages and Graphical Analysis
All grocery stores price indexed in Montclair and Ontario were entered into two separate Excel files based
on the city and then were analyzed. Each item’s weight or packaging type as indicated by the price index
was calculated so that particular item at any store had the same measurement. For example, if a fruit is
usually measured per pound but one researcher found a type of fruit that came in a 3.5 pound bag, I would
take the price of the 3.5 pound bag and divide it by 3.5 in order to get the price per pound. The prices of
9
ReferenceUSA. "U.S. Business Search." 29 July 2010. .
10
USDA Economic Research Service. "Community Food Security Assessment Toolkit." 1 July 2002. 3 May 2010.
. pp 75‐76
11
American FactFinder. U.S. Census Bureau. 1 Sept. 2010.
6each type of fruit listed on the price index have been graphed according to store name (Figures 1 and 2).
Vegetables were also graphed in the same manner (Figures 3 and 4).
It is interesting to see the fluctuations in price at different stores for the exact same items.
Although Stater Brother’s is usually the cheaper option when choosing between grocery stores, Figures 1
and 2 seem to show a different story. When in Montclair, it’s better to buy in bulk at Costco for most
produce items, but especially fruit. This specific Target does not have produce and the 99 Cent Only
store’s fruit prices are on par with those of Stater Brother’s. The 99 Cent Only store has cheaper
vegetables than Stater Brother’s, though.
When shopping for fruit in Ontario, Stater Brother’s is still not the cheapest option. The cheapest
possible options for fruit are Ontario Farmer’s Market and Jax Market. The quality of produce at these
smaller, non-chain stores is very questionable. Ontario Farmer’s Market has low-quality produce which
goes bad quickly, so although the fruit is inexpensive, one would have to shop for fruit much more
often. 12 The cheapest option for vegetables also includes Jax Market, but Liborio tends to be second
cheapest or on par with Jax.
In Figure 5, average food prices in Montclair are compared with average food prices in Ontario.
Because the only stores price indexed in Montclair were larger stores or supermarkets, I only considered
stores of the same type (Stater Brother’s, Liborio, Fresh and Easy, and Albertson’s) for the comparison of
Ontario stores. When taking the averages, not all items within a category had the same units, which may
make the graphical data more difficult to interpret. Fresh fruit and fresh meat can be assumed to be
measured per lb with the exception of eggs (in the fresh meat category) which is measured by the dozen.
12
Personal observation through price indexing and personal shopping trips.
7Figure 1: Price of fresh fruit at Montclair markets by type of fruit
Figure 2: Price of fresh fruit at Ontario markets by type of fruit
8Figure 3: Price of fresh vegetables in Montclair markets by type of vegetable
Figure 4: Price of fresh vegetables in Ontario markets by type of vegetable
9Figure 5 shows that average prices for food in Montclair are generally lower than those of
Ontario. The two cities have approximately the same average for fresh vegetables and canned dairy
products (condensed milk). Instances where Ontario’s average is less expensive occur with fresh fruit and
fresh meat/meat alternatives.
Discrepancies in Graphical Data
Where there is no bar for a given item at a given store, the item was either missing at that location
or the data was unreasonable, meaning that it was not feasible to convert its weight or packaging type into
units comparable with the other stores’ units for that item. One such instance occurred in Figure 2 for the
Figure 5: Comparison of average food prices at supermarkets and large grocery stores in
Montclair and Ontario by price index category
price of apples at Liborio. The price was recorded as $8.99 for one pound of apples. Outliers that I did
not cut out of the data, such as the price for apples at Costco (Figure 1), are due to inconsistencies in
measurement of weight or packaging. Note that for apples I analyzed it as “per bag” rather than by a
weight. This was due to the fact that no weight was specified for the package. The price of melons at
10Liborio also created an outlying data point. The price was recorded at $9.00 for 2 lbs, which seems
unreasonable depending on the type of melon, but I had no reason to believe it was any different so I left
it in for analysis.
Unfortunately many of these discrepancies in weight or packaging type for each item were due to
lack of experience with the type of field research. I only began to work with this project in February and
was not put into a position where I had to know price indexing well until June. My research partner had
very limited experience with it as well. Many people collecting this data were new to the methods in
June. It is very hard to get items to have the same units when the researchers do not know what goes into
analyzing the data and do not know that it would be easier to get as close to the recommended weight or
packaging suggested on the price index template. Many people also may have forgotten to write down
the packaging type on the price index. Other discrepancies are caused by the fact that so many people
were entering data and I did not have access to many of the hard copies. I relied solely on Excel files
transcribed by myself, my research partner, and a high school program earlier in the summer, which could
very well have been transcribed from hard copy incorrectly.
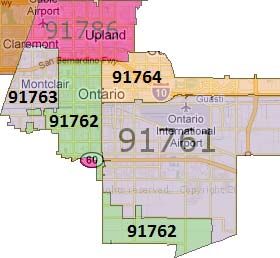
Census Data
Data tables from the CSFA Toolkit were used to
Figure 5: Zip code map of Montclair and Ontario
collect data from the 2000 US Census about
demographic and economic information. Tables
1 and 2 below are taken from table A1 in the
CSFA Toolkit. The total population for the city
of Montclair is 34,437, 60% of which identify as
being of Hispanic origin. Ontario’s total
population is about 4 times that of Montclair at
162,630 people, 64.3% of which identify as
being of Hispanic origin. If broken up by zip
11code, Ontario’s population is as follows: Zip code 91761, Population 56,271; Zip code 91762, Population
54,243; Zip code 91764, Population 49,461. 13
Economic characteristics given by the US Census were put into Table A2 given by the Toolkit.
Tables 3 and 4 show the economic characteristics for Montclair and Ontario. Table 3 shows that the
median household income for Montclair is $40,797. 17.4% of Montclair’s population is under the
poverty level. Table 4 shows that the median income for Ontario is $57,184. 10.1% of Ontario’s
population is under the poverty level. Because there are three different zip codes in Ontario and
individual data sets available for each, it is easier to see the breakdown of income and poverty levels by
zip code. Figure 5 show a map broken up by zip code. 14 Within zip code 91761, the median income is
$49,430 and 12.4% of its population is under the poverty level; zip code 91762, median is $39,972 and
7.6% of people are under poverty levels; and zip code 91764, median is $39,098 and 17.3% of people are
under the poverty level. 15
Table 1: Montclair demographic characteristics
13
American FactFinder
14
US Naviguide Home Page. "USPS Lookup and Boundary Map." Jan. 2010. 2 Sept. 2010.
.
15
American FactFinder
12Table 2: Ontario demographic characteristics
Table 3: Montclair economic characteristics Table 4: Ontario economic characteristics
13Grocery Prices in Relation to Census Data
So what do the census data have to do with the price index data? People in Ontario can afford to pay
more for food than residents of Montclair. Of course this is a generalization based off of the census data
(Tables 3,4), but that would be how the markets see the situation. Stores that sell their produce for less,
no matter what the quality of the product may be, are most likely marketing to low-income residents. I
suspect that supermarkets are not centrally located in (or near) low-income neighborhoods, whereas low
cost produce is sold in stores that are located closer to low-income neighborhoods. Without GIS maps
showing placement of markets against city demographics/economics it is hard to prove that these claims
are true.
Conclusion
After Sam Hanft’s thesis was written, many different initiatives have been taken to see that the
city of Pomona receives land for a PVUAI. The results of the thesis have stunned many
residents and, once presented the data by Cal Poly students, even the city itself. 16 This may even
spawn future studies on the topic of poverty and food insecurity in Pomona. Ontario and
Montclair have the same potential, but both cities need completed data for the food assessment
first. Each city will be studied further for the purposes of the PVUAI grant proposal for
Uncommon Good through studies conducted by students of Cal Poly Pomona and Pomona
College. Unfortunately by the end of the summer project baseline prices for what people would
be willing to pay for produce from the PVUAI were not established, but it is safe to assume that
people will be willing to pay as much as the lowest cost stores sell their produce for, like Jax or
Ontario Farmer’s Market. Although may not be enough accurate data to help the PVUAI
proposal, there is enough data to show that the cities are in need of a PVUAI garden.
16
Nancy Mintie, personal interview.
14Works Cited
American FactFinder. U.S. Census Bureau. Web. 1 Sept. 2010.
"Community Food Security Assessment Toolkit." USDA Economic Research Service. USDA, 1 July
2002. Web. 3 May 2010. .
"Definitions of Hunger and Food Security." USDA Economic Research Service. USDA, 16 Nov. 2009.
Web. 1 Sept. 2010. .
Hanft, Sam. "Community Food Security Assessment of Pomona, California." Thesis. Pomona College,
2010. Print.
Kantor, Linda. "Community Food Security Programs Improve Food Access." Food Review 24.1 (2001):
20-26. Web. 2 Sept. 2010.
Mintie, Nancy. Pomona Valley Urban Agriculture Initiative. Project Description.
"Statistics and Graphics." USDA Economic Research Service. USDA, 16 Nov. 2009. Web. 1 Sept. 2010.
.
Uncommon Good. Uncommon Good. Web. 2 Sept. 2010. .
"U.S. Business Search." ReferenceUSA. Web. 29 July 2010. .
"USPS Lookup and Boundary Map." US Naviguide Home Page. Jan. 2010. Web. 2 Sept. 2010.
.
15You can also read