UCloudlink 1Q2021 Earnings Presentation
←
→
Page content transcription
If your browser does not render page correctly, please read the page content below

uCloudlink

1Q2021 Earnings Presentation

            May 2021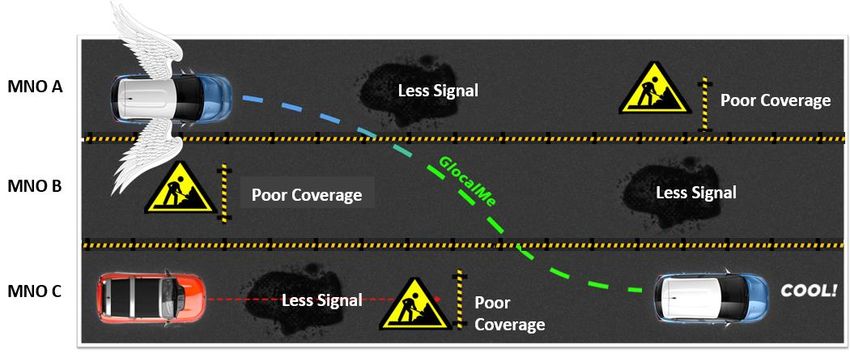
Disclaimer

By viewing, accessing, or participating in this presentation, you agree to be bound by the following limitations. Any failure to comply with these restrictions may constitute a violation of applicable
securities laws.

This presentation has been prepared by UCLOUDLINK GROUP INC. (the “Company”) solely for information purposes. This presentation does not constitute an offer to sell or issue or an invitation to
purchase or subscribe for any securities of the Company for sale in the United States or anywhere else. In particular, this presentation and the information contained herein are not an offer of any
securities of the Company for sale in the United States or to or for the benefit of U.S. persons and are not for publication or distribution in the United States or in any other jurisdiction in which such
publication or distribution would be prohibited by applicable law. This presentation is provided without any warranty or representation of any kind, either expressed or implied. The Company specifically
disclaims all responsibilities in respect of any use or reliance of any information, whether financial or otherwise, contained in this presentation. This presentation contains certain forward-looking
statements with respect to the financial condition, results of operations and business of the Company. These forward-looking statements represent the Company’s expectations or beliefs concerning
future events and involve known and unknown risks and uncertainties that could cause actual results, performance or events to differ materially from those expressed or implied in such statements.
Certain statements, such as those that include the words “potential”, “estimated”, “expects”, “anticipates”, “objective”, “intends”, “plans”, “believes”, “estimates”, and similar expressions or variations on
such expressions may be considered “forward-looking statements”. Forward-looking statements involve inherent risks and uncertainties. Readers should be cautioned that a number of factors could cause
actual results to differ in some instances materially, from those anticipated or implied in any forward-looking statement. Forward-looking statements speak only as of the date they are made, and it should
not be assumed that they have been reviewed or updated in the light of new information or future events. This Document is the property of the Company. All materials contained in this document are
protected by copyright and other intellectual property laws. No one can reproduce or retransmit the materials, in whole or in part, in any manner, without the prior written consent of the Company. You
may get related documents for free by visiting EDGAR on the SEC website at www.sec.gov.

The information contained in this presentation has not been independently verified. No representation or warranty, express or implied, is made as to, and no reliance should be placed on, the fairness,
reliability, accuracy, completeness or correctness of such information or opinions contained herein. The presentation should not be regarded by recipients as a substitute for the exercise of their own
judgment. The information contained in this presentation should be considered in the context of the circumstances prevailing at the time and has not been, and will not be, updated to reflect material
developments which may occur after the date of the presentation. The Company is not under any obligation to keep the information contained in this presentation current, and any opinions expressed in
it are subject to change without notice. Neither the Company nor any of its directors, shareholders, employees, agents, affiliates, advisors, representatives or underwriters will be liable (whether in
contract, tort, strict liability or otherwise) for any direct, indirect, incidental, consequential, punitive or special damages howsoever arising from any use of this presentation or its contents or otherwise
arising in connection with the presentation. The information presented or contained in this presentation is subject to change without notice and its accuracy is not guaranteed.

This document also contains non-GAAP financial measures, the presentation of which is not intended to be considered in isolation or as a substitute for the financial information prepared and presented
in accordance with accounting principles generally accepted in the United States of America. In addition, the Company’s calculation of these non-GAAP financial measures may be different from the
calculation used by other companies, and therefore comparability may be limited. The reconciliation of those measures to the most comparable GAAP measures is contained within this presentation.

                                                                                                                                                                                                             2
01
Company Overview

Vision and Mission

                             Founders’ Story:
                             “To enable people to use mobile data traffic
                             freely anytime, anywhere like breathing the air”

    Vision                                Mission
    Connecting and Sharing without        Make the World More Connected with
    Limitations                           Maximized Network Utility through the
                                          Power of Mobile Data Traffic Sharing

                                                                                  4
The World’s First and Leading Mobile Data Traffic Sharing Marketplace

                                                 Data Traffic                                  Sharing back Data Traffic

                                                                    Intelligent Data
                                                                     Traffic Factory

                                                                                                                           International
                                     MNOs
                                                                                                                             Travelers
                 MVNOs

                                                                Repackaging         Re-                                     Data Users     Local Users
                          Data Suppliers                                        distributing

   SIM Card
   Resellers

                                                                  Dynamic
                                                                 Allocation      Recycling
                                                                                                                                           Corporates

               Business
               Partners         Mobile Users                         Enabled by Cloud
                                  Future                                                                                    Machines
                                                                      SIM Technology
                              Implementation

                                                 Data Traffic                                  Sharing back Data Traffic

      Best Coverage                            Best Speed          Best Price                  Flexible Solution           High Throughput

                                                                                                                                                         5
Innovatively apply “Navigation + Electronic Toll Pass” Concept to Data Connectivity
  Services Market

          Help elevate user experience and improve network efficiency
 Reliable data
 connection      Unreliable data
                 connection

Users’ Major Pain Points

We Always have Marginal
Areas With Poor Network
Coverage

Our solution can make unreliable data
connection to more reliable data connection, as
show on the right chart of our solution

                                                                                        6
Our Innovative Cloud SIM Technology Facilitates Data Traffic Marketplace

Two Key Passes:
 1                                                                                                                                      2
                              Global roaming pass: Seed SIM                                                                                       Local data connectivity pass: SIM Pool

   5 Authentication response of                                                      1      Seed-SIM sends initial signal                             2 Server identifies SIM in the
          the remote SIM stored in the                                                      to server, including location                                 SIM pool with the optimal
          chipset to enable local                                                           and authentication details                                    connectivity service
          connection to be established                                                      from available network

                                                                      Seed SIM

                                                                                                                                                                                       Pool of SIM Cards (2)
                                                                                                                                                                                        from 227 MNOs (3)
                                                                                                                                                                                           Globally(2)
                                                  4 Device sends authentication                                                  3 Selected SIM sends back
                                                         details to the mobile network                                             authentication response to
                                                         and the network is able to                                                device via the connection built
                                                         identify the local-SIM                                                    by seed SIM and server

                                                      156 Patents(1)                                                                                         Software-based
                                                                   Ready to Support All Three Generations of our Businesses
Notes:
1. As of March 31, 2021, with 74 patents approved and 82 patents pending approval, globally
2. As of March 31, 2021, among these SIM cards, c.19% are owned by the Company with remaining SIMs owned by our PaaS customers
3. As of March 31, 2021

                                                                                                                                                                                                               7
Hyper-Connectivity Solution Would Guarantee Network Data Connectivity

            5 Crosses
        Cross Physical                                              3 methods
         Boundaries

                                                                       Identification
    Cross SIM Form Factors
                                    Hyper-
                                  Connectivity                         Monitoring
       Cross Networks
                                   Solution
       Cross Countries                                                 Optimization

         Cross Layers

                                Navigation + Electronic    Guarantee Data
            Multi-network                                 Connectivity and
                                  Toll Pass Through
      Millisecond Reselection                             Network Security
                                PaaS and SaaS Platform

                                                                                        8
Hyper-Connectivity Solution Would Provide Industries and Users with Robust Connection

                                         Robust Connection
                                       (Reliable, Speed, Safe)

            To Industries                                           To Users
                                                                 • Education, Remote Working
        •   Cargos and Logistics
                                                                 •
        •   Internet of Vehicles,
                                       Hyper-Connectivity        • Video and Entertainment
        •   Autonomous Driving
        •   AR/VR, 5G Cloud                Solution              • Home Broadband
            Computing
        •   Trains and Yachts
                                                                 • MBB Indoor Coverage
        •   Emergency Response
        •   Power Monitoring
                                                                 • Reliable FBB Wi-Fi Coverage
        •   Surveillance Industries
        •   Industrial Automation
                                                                 • Guarantee Network
        •   Carparks and Lifts
                                                                   Connection
        •   Satellite Networks to be
            tested

                                                                                                 9
Multi-Network Millisecond Reselection – The Engine of the 5G Cloud Era
Multi-network millisecond reselection technology of Cloud SIM - Accelerating the 5G Cloud Era
GLOBAL
1 2
Local 5G Global 5G
• Challenge: limited network coverage and lack of network • Challenge: high latency due to roaming, host- enabler
sharing carriers imposing speed / usage limits on 5G
• Cloud SIM Solution: connects local 5G networks across • Cloud SIM Solution: Global 5G connectivity
carriers without limitations To Users
Global 5G access
To Carriers
1 Coverage Solution
2 To Vendors
Empowers 5G devices
Smartphones Mobile BB
Operator A Operator B Operator C Operator D Operator E Operator F
CPE IoT
10The Evolution of Cloud SIM Business Models
Increasingly Platform-centric
Stage 1: B2C Retail Stage 2: B2B2C Wholesale Stage 3: PaaS/SaaS Platform
Business Model • uCloudlink sells or leases GlocalMe • uCloudlink sells GlocalMe hardware • uCloudlink’s partners procure
Description hardware and data packages and data packages customized ODM(1) hardware and
to retail consumers via local Business Partners purchase data packages from UCL
and own sources
• Partners rely on uCloudlink’s
PaaS/SaaS platform for SIM
management
Strategy • Proof of Cloud-SIM Technology • Expedite Global Expansion • Fast Expanding Global Partner
• Proof of Scalable, Profitable • Pool of 2,000+ Local Partners (2) Ecosystem, SIM Securely Locally
Business Model Hosted by Partners
• Includes Data Management, Terminal
Management, Sales and Rental of
Terminals and Customers Management
System to Further Facilitate End-users
including C2C/C2B2C/B2B2C Models.
Note:
1. Original design manufacture;2 . As of March 31, 2021
11Clear Growth Strategies Across Business Models
Between Countries Between Carriers Full Marketplace
2.0 3.0
1.0
Capture Local Data Connectivity Data Traffic with Massive User Base
Market Opportunity
Strengthen Leadership Position
Capitalize Scalable user base
GlocalMe Inside App, accumulated through uCloudlink 1.0
GMI embedded, low friction, to become and 2.0 models
Enhance global Distribution standard for local data connectivity
channels Strategic Partnerships with leading
smart device manufacturers to Tested users access to Complete
Enhanced Experience through increase distribution base. Business Data Traffic in trials and eliminate
GlocalMe Inside app to drive user partners can management business wastage
GMI stickiness. We provide superior data to provide better services to end-
connectivity services to users backed users via our PaaS and SaaS
by our PaaS and SaaS platform. platform Gateway to Digital Mobile
Localize Operations in key Ecosystem offering opportunities
Service Quality with improved markets by leveraging expertise of for VAS deployments
network connections quality and strong local business partners
speed
2014 2018 *Finalized prototype APP in 2019
c.US$35bn * c.US$1,149bn *
2023E International Data Roaming Market size 2023E Local Mobile Data Connectivity Market size ? 12
Notes:
* According to Frost & SullivanCloud SIM Technology Through PaaS and SaaS Platform Could Help Mobile Network
Operators Decrease Churn Rate
Main Reasons for China Users Mobile Number Portability (1)
(switch mobile network operators)
Alliance with
Mobile Network
Operators
(MNOs)
+
Mobile Handset
manufactories
Cloud SIM Smart Multi-Network
Reselection Technology Could
Help Reduce Churn Rate
Notes:
1. Public information quoting China Academy of Information and Communications Technology (CAICT) March 2020 Research,https://www.sohu.com/a/408237187_114988
13Strategic Development and 5G Opportunities of Our Business
uCloudlink
Business
Alliances with MNOs,
MBB + FBB Business and 5G Enhanced Sales and
MVNOs and Business IoT Opportunities
Opportunities Opportunities Marketing
Partners
Multi-network millisecond
Japan and China reselection e-commerce Efforts in key Cargos and logistics
Beijing Huaxiang Lianxin Accelerator of 5G Cloud markets such as US and
Internet of Vehicles
application Europe
Regional Wireless Carriers MBB + FBB Autonomous driving, AR/VR, Autopilot, AR/VR
in US Optimizing our Website
Enhancement Cloud Computing Remote Work and
iQsim in Europe Of GlocalMe Branding
Series 5G Products, GMI Education, etc.
CVITC PaaS and SaaS Platform
1402 1Q 2021 Operating Highlights
Our Business Performance and Operating Highlights
Daily Active Terminals (DAT) (2)
DAT Breakdown by uCloudlink 1.0 vs. 2.0 (2) Daily Data Usage per Terminal (2)
# Terminals % GB
Strong uCloudlink 2.0 User Adoption
4%
9%
13%
15%
265,800
25%
(1) 2.01
1.98
50%
(1)
64%
211,585
66%
67%
196,493 1.94
74%
74%
96%
91%
+2.3x
87%
85%
75%
114,540
0.86
50%
+1.8x
36%
34%
33%
26%
26%
0.48
69,340
Jan Apr Jul Oct Dec Jan Apr Jul Oct Dec
(2) (2)
2017 2018 2019 2020 2021 DAT of uCloudlink 1.0 DAT of uCloudlink 2.0 2017 2018 2019 2020 2021
Note:
1. In March 2021
2. Average daily active terminals include terminals connected to our platform that are serviced by us or our business partners. Data consumed by the active terminals including data consumed by users who contributed to our revenues from data
connectivity services and data consumed by users who did not contribute to such revenues.
16Our Business and Revenue Are Increasingly Diversified Globally
94%
Non-Mainland
China Revenue
Contribution
25 38 42 48 49 49 50
32% 32% 28%
36% 39% 36%
48%
19%
36%
53%
56% 58%
56%
47%
49%
32%
19%
8% 5% 5% 6%
2018 2019 2020Q1 2020Q2 2020Q3 2020Q4 2021Q1
Mainland,China Japan Other Countries
Number of countries and regions based on partners’ registered location
1703 1Q 2021 Financial Highlights
Percentage of Our Service-Related Revenues and COVID-19 Impact

                                                                     Revenue segmentation based on product & services

                                      PaaS and SaaS services                                                                PaaS and SaaS services
                                              5.8%                                                                                  12.9%
         2.0 local data connectivity
                                                                                                 2.0 local data connectivity
             services revenues
                                                                                                     services revenues
                    7.3%
                                                                                                            3.2%

               Sales of products
                                             52.0%                 1.0 international
                                                                   data connectivity
                                                                                                                                 47.4%                1.0 international
                                                                                                                                                      data connectivity
                                                                                                                                                     services and Other
                    48.0%                      Service-related    services and Other                                              Service-related      service-related
                                                 revenues           service-related                                                 revenues
                                                                                                        Sales of products                                revenues(1)
                                                     2020 Q1          revenues(1)                            52.6%                     2021 Q1             31.3%
                                                                        38.9%

Note:
1. Other service-related revenues includes revenues from others

                                                                                                                                                                          19
Revenue Breakdown By Our Two Business Segments
• Revenue, US$’MM $53.7
$44.1
$35.9 54%
54%
$33.5
43%
$24.7 48%
41% $21.0
18% 48% $18.0 $17.0 $17.7 -47.2%1
53%
57% 46% 45% 47% 53% -42.1%2
82% 59%
52%
52% 47% 55% 53% 47%
-51.9%3
2019Q1 2019Q2 2019Q3 2019Q4 2020Q1 2020Q2 2020Q3 2020Q4 2021Q1
Revenue from Services Sales of Products
1. Q1 Total Revenue Year-over-Year growth 47%
2. Q1 Sales of Products Year-over-Year growth
3. Q1 Revenue from Services Year-over-Year growth
20Higher Service Gross Margin Over Overall Gross Margin
• Gross Profit(loss), US$’MM
$40.0 63%
66% 70%
58%
$35.0 55% 60%
51%
$30.0 49% 50%
43% 41%
37%
$25.0 42% 35% 35% 36% 40%
$18.9 31% 31%
$18.9 31%
$20.0 35% 26% 30%
$15.2
$15.0 $12.0 $11.8 20%
$10.0 $5.5 $5.6 $5.3 $5.5 10%
$5.0 0%
$- -10%
2019Q1 2019Q2 2019Q3 2019Q4 2020Q1 2020Q2 2020Q3 2020Q4 2021Q1
Gross Profit from Services Gross Profit from Products Gross Profit Margin Services Gross Margin
21Controlled Operating Expenses During Pandemic of COVID-19
R&D 3
• Operating expenses1, $US,MM 29%
G&A
47%
$18.0 S&M 90%
$16.6 24%
83%
$16.0 $15.3 80%
$13.5 $14.3 $14.2
$14.0 71% 70%
65% $12.6
$12.0 $11.8
$12.0 60%
55% $10.2
$10.0 49% 50%
$8.0 40%
43%
$6.0 36% 30%
32%
31%
$4.0 20%
$2.0 10%
$- 0%
2019Q1 2019Q2 2019Q3 2019Q4 2020Q1 2020Q2 2020Q3 2020Q4 2021Q1
G&A S&M R&D Operating expense as % Revenue
36% 31% 37%
241 R&D Staff (2)
159 Business Development, Sales and Marketing Staff (2)
128 Administration and Management Staff (2)
Note:
1. Operating Expenses excluding SBC and others
2. As of March 31, 2021
3. Operating Expenses Breakdown Pie Chart is specifically for 2021Q1
22Asset Light Business Model with Normal Cash Flow
• Operating Cash Flow, $US,MM
$6.3 $6.7
$1.1
$0.3
$(0.4)
$(1.9)
$(2.8)
$(5.5)
$(6.7)
2019Q1 2019Q2 2019Q3 2019Q4 2020Q1 2020Q2 2020Q3 2020Q4 2021Q1
CAPEX, $US,MM
$2.00 2.7%
3.0% 3.5%
2.2%
$1.50 $1.2 1.7%
2.5%
1.2% 1.1% $1.0
$1.00 $0.9 1.0% 0.8% 1.5%
0.6%
$0.4
$0.50 $0.3 $0.4 $0.21 0.5%
$0.14 $0.1
$- -0.5%
2019Q1 2019Q2 2019Q3 2019Q4 2020Q1 2020Q2 2020Q3 2020Q4 2021Q1
Capex Capex as % Revenue 23Net Income & Adjusted EBITDA
Net Income, $US,MM $3.8 $2.1
$0.3 $0.2
$(2.0) 2019Q1 2019Q2 2019Q3 2019Q4 2020Q1 2020Q2 2020Q3 2020Q4 2021Q1
$(0.9)
$(12.0) (1)
$(9.7) (1)
$(12.3) (1)
$(15.4)
$(22.0)
$(32.0)
$4.6
$(42.0) $(41.6)
(1)
Adjusted EBITDA, $US,MM $2.9
$1.2 $1.0
$0.2
2019Q1 2019Q2 2019Q3 2019Q4 2020Q1 2020Q2 2020Q3 2020Q4 2021Q1
$(3.1)
$(5.0)
$(6.7)
$(7.9)
Note:
1. Including share-based compensation US$36.9 million in 2020Q2, US$7.9 million in 2020Q3, US$5.9 million in 2020Q4, and US$5.5 million in 2021Q1
24Appendix – Financial Statement
25Appendix – Financial Statement
26Q&A
You can also read