GOCO GROUP 2019 HALF YEAR RESULTS - 25TH JULY 2019 - FUTURE INVESTOR RELATIONS
←
→
Page content transcription
If your browser does not render page correctly, please read the page content below

GoCo Group
2019 Half Year Results

       25th July 2019
Agenda

         1   Highlights & AutoSave        | Matthew Crummack

         2   Financial Review             | Nick Wrighton

         3   Price Comparison & Rewards   | Lee Griffin

         4   Summary                      | Matthew Crummack

                                                               2
2019 H1 Highlights
     Strong discipline on core & innovation for growth
                                                                ➢ Total Group revenue stable at £76m in competitive market
                      Disciplined
                                                                ➢ GoCompare.com car insurance market share flat to H2 2018 with stable marketing margin of 46%1 (driven
                     performance                                    by further conversion improvements broadly offsetting marketing inflation)
                     on core in H1                              ➢ Adjusted Operating Profit excluding weflip of £20.6m (H1 2018 = £21.2m)

           GoCompare proposition                                ➢ Launch of innovative data driven brand proposition to drive awareness & preference to grow revenue in
               innovation to                                      H2 as the market recovers: Free £250 Off Your Excess – When It Matters, GoCompare
                 grow in H2                                     ➢ Relentless focus on improving conversion

          Acceleration of AutoSave                              ➢ Acquisition of Look After My Bills2, one of the UK’s fastest growing energy savings services with over 150k
                to over 175k3                                     live customers3
               live customers                                   ➢ AutoSave segment (weflip + Look After My Bills) now has over 175k live customers3

              Further Savestack                                 ➢ Ongoing improvements to underlying architecture
             development leading                                ➢ Market first comparison and switching journey in bank app, through B app for CYBG/Virgin Money
            to first B2B partnership                            ➢ Fast learning in new environment

1.   GoCompare.com only
2.   Consideration of £6.0m upfront, financed through the Group’s existing resources, plus £2.5m
     deferred consideration, plus up to a further £4.0m performance based earn-out, leading to a
     maximum potential consideration of £12.5m                                                                                                                                  3
3.   Live Customers defined as those who have provided full switching authority to enable a
     switch net of churned customers. Numbers across weflip & Look After My Bills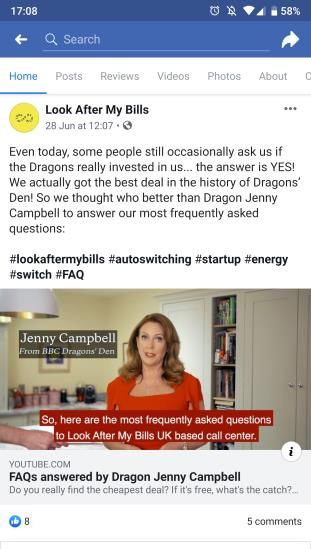
revolutionising an industry

         •    Our ambition for the Group is to transform into a higher & more sustainable EBITDA margin business

         •    Traditional Price Comparison dynamics do not enable this
                  ➢    Market: focuses on discrete consumer segment = highly competitive & size constrained
                  ➢    Model: low loyalty = high annual marketing spend on acquisition

         •    Significant opportunity of 23m households1 exists by addressing the needs of infrequent switchers

         •    The Group maintains a disciplined approach on core Price Comparison and Rewards, focusing on cash to invest in
              disruptive innovation to unlock growth

         •    Highly attractive business model to transform the Group with a subscription style service (free to consumers, revenue from
              suppliers) driving high customer retention, lower marketing spend and ultimately higher margins

         •    Whatever the customers’ preference, we have a model to meet their needs

                                                                                                                                           4
1.   Approximate number of households in 2018 who did not switch energy based on BEIS / Ofgem data
Price Comparison maintains revenue & earnings

Solid results in the face of a competitive market in H1                   Price Comparison positioned to grow revenue in H2 and beyond

                         Decreasing car
                      insurance premiums
                                                                                                                  Switching volume growth
                                                                           Differentiated proposition
                                                                                                                       expected in H2
                     Reduced switching                                        for GoCompare.com
                                                                                                                   Increasing evidence suggests car
                          volume                                           New customer-led brand proposition
                                                                                                                    insurance switching market will
                                                                            to drive awareness and preference
                                                                                                                         return to growth in H2
                       Increasingly
                       competitive

                       Marketing
                       inflation
                                                                                  Relentless focus                   Clear accountability
                                                                                   on the basics                  Revised structure with founder Lee
                                                                             Continual improvements to core       Griffin taking full accountability for
                                                                           proposition to make conversion gains      delivery of Price Comparison
In H1 we maintained a disciplined approach on our core Price Comparison
& Rewards businesses:
➢ Revenue flat YoY
➢ Marketing margin stable despite cost inflation
➢ Improved conversion and revenue per interaction
                                                                                                                                                           5
The addressable opportunity

                                                                                         ▪ Current size ~£1.1bn1
                                                                                         ▪ Addresses the needs of only c.20% of consumers
                                                                                           who switch frequently
                                                             Traditional Price           ▪ Dominated by 5 key players
                                                               Comparison                ▪ Limited innovation over last 10 years
                                                                                         Opportunity to deliver solid medium-term
                                                                                         sustainable profitable growth

                                                                                         ▪ Potential opportunity 3 – 4x2 bigger than today

                                                                   Huge                  ▪ Targets infrequent switchers, representing majority
                                                                Unaddressed                of the population, who only occasionally switch
                                                                Opportunity
                                                                                         Huge opportunity through our AutoSave3
                                                                                         propositions

1.   Across Car Insurance, Home Insurance and Energy
2.   Implied potential market opportunity for Car Insurance, Home Insurance and Energy                                                           6
     based on industry switching rates and average industry switching fees
3.   AutoSave segment includes combined numbers on both weflip and Look After My Bills
AutoSave
Incremental 23m household opportunity in Energy alone automated
savings can unlock this
The opportunity is in addressing the Infrequent Switchers Automated saving can target these consumers
~28M supplied Sign up once
households
Savings Resignists
~15M households are on a Default Tariff1
Sign up
~23m Household
Opportunity
(>80%)
£1.3bn2
Switch Data Recommend
~5.4M2 (
AutoSave

     Acquisition of Look After My Bills

            GoCo Group today announces it has acquired Look After My Bills, one of the UK’s fastest growing energy saving services

     Transaction highlights                                  Acquisition closely aligned to our     Founders incentivised to drive
                                                             Group strategy                         growth
 • Acquisition of This Is The Big Deal Limited
                                                                                                    Henry & Will both secured investment on BBC’s Dragon’s Den in
   (trading as Look After My Bills)
                                                             ➢ Relevance enabling further           2018, regarded as one of the show’s most exciting opportunities

 • Total consideration comprised of £6.0m                      acceleration                         Henry De Zoete
   upfront (financed through the Group’s existing                             v                     Co-founder
                                                                                                    • Primarily responsible for customer acquisition strategy,
   resources) plus £2.5m deferred
                                                             ➢ Customer acquisition & marketing       including community and campaigns
   consideration, plus up to a further £4.0m                                                        • Founded The Big Deal Ltd, a UK collective energy switching
   performance based earn-out1                                 expertise                              proposition

                                                                                                    Will Hodson
 • Operations to continue to be run as a                                                            Co-founder
   standalone business based in London                       ➢ Operational expertise                • Primarily responsible for strategy, finance, product and
                                                                                                      partnerships
 • Additional headcount of 36                                                                       • Previously founded a social food start-up in London

                                                                                                                                                             8
1.   Total maximum potential consideration of up to £12.5m
AutoSave
>175k live customers 1
2 brands, 23M households , transformative by 2
2022
Track record demonstrating expertise to
rapidly and efficiently acquire customers
0
Jan 2018
175k
live customers 1
Powered by
Support to address non-core functions3
to enable a focus on customer growth
1. Total combined customers post Look After My Bills completion as of 8 th July 2019; Live Customers defined as
those who have provided full switching authority to enable a switch net of churned customers 9
2. Approximate number of households in 2018 who did not switch energy based on BEIS / Ofgem data
3. Includes Information Security & Compliance, HR, Finance
AutoSave

Innovation extends to acquiring customers
Learnings for marketing effectiveness of channels                            Successful operational processes & pricing preferences

                                                                                                  Optimising channels & customer targeting to
                                                    Portfolio of brands    Dedicated teams,       acquire incremental consumers, i.e. infrequent
                                                       appealing to           optimising          energy switchers who do not regularly use price
                                                    different audience       incremental          comparison sites
                                                         segments             acquisition

                                                                            Exclusive tariffs,
                                                     Digital acquisition   increasing growth      Increased relevance enables us to offer customers
                                                    channels to recruit     opportunity for a     market leading deals across both brands
                                                    engaged customers      wider selection of
                                                                                suppliers

                                                                                                                                                10
AutoSave
Goal remains for AutoSave to be transformative to Group earnings by 2022
Ambition
3 million
c.10% of UK
households
Target to grow live
AutoSave customer2 ➢ Acquisition of Look After My Bills
numbers by at least 25% places the Group in a strong
in the next five months position to grow
➢ We therefore intend to increase
investment through H2 2019
>175k1
live customers2 Variation in ➢ This investment will have an
outcomes driven
by investment
impact of up to £7m on full year
Adjusted Operating Profit
expectationsSimplicity key to organisation and technological transformation
Price Comparison AutoSave Rewards
Lee Griffin Zoe Harris Stefano Perino
Flexible platform enabling us to innovate at speed and reach customers, wherever they are
12Distribution
Potential for new distribution channels, such as CYBG (Virgin Money)
• Market first comparison and
switching journey in a bank app,
through B app for CYBG
• Complete whole journey (including
comparison and switch) within the app
• Data sharing to simplify
experience
• Revenue share to incentivise
volume
• Fast learning to establish
customer appetite
• Powered by APIs
13Agenda
1 Highlights & AutoSave | Matthew Crummack
2 Financial Review | Nick Wrighton
3 Price Comparison & Rewards | Lee Griffin
4 Summary | Matthew Crummack
14Solid financial performance in line with expectations
Total Revenue Price Comparison Revenue Adjusted Operating Profit1 Adjusted Operating Profit
(£m) (£m) (£m) excluding AutoSave1
(£m)
0%
Flat 0%
Flat
Flat q 40% q 3%
75.8 76.0 72.1 72.0
21.0 21.2 20.6
12.5
18 H1 19 H1 18 H1 19 H1 18 H1 19 H1 18 H1 19 H1
1. Adjusted operating profit represents operating profit, after adding back
amortisation of acquired intangibles, transaction costs, other exceptional 15
corporate costs and Foundation Award share-based payment chargesContinued improvements on , despite competitive market
Improved Conversion Increased Revenue per Interaction Stable Marketing Margin
GoCompare.com Car Insurance Conversion GoCompare.com Revenue per Interaction GoCompare.com Marketing Margin
Average over 6months £ % of Revenue
46.4% 46.0%
5.19
4.80 39.6%
4.31 4.43 34.5%
Flat
+8%
+1.2ppt
+0.5ppt +8%
+7ppt
-0.4ppt +3%
+5ppt
2016 H1 2017 H1 2018 H1 2019 H1 2016 H1 2017 H1 2018 H1 2019 H1 2016 H1 2017 H1 2018 H1 2019 H1
16Headcount and Capex flat to 2018 H2
Headcount
# of FTEs at Period End
Adjusted Admin Costs
£m
16.2
Capex
£m p 4%
14.8 13.7 16.2
300 301 14.8 13.7
292 4.8
4.6
14.0 3.6
13.9 12.3 14.0
13.9 12.3
0.9
1.4 2.2
0.9 1.4 2.2
18 H1 18 H2 19 H1
18 H1 18 H2 19 H1 18 H1 18 H2 19 H1 18 H1 18 H2 19 H1
D&A Admin Costs (exc. D&A)
D&A Admin Costs (exc. D&A)
17Strong operational cash flow and investment in innovation
2019 H1 Cash flow
(£m)
• Strong operational cash flow on Price Comparison and Rewards • Interest and leases includes debt interest paid and payments made in
businesses respect of lease liabilities
• Investment of £7.6m into weflip during H1 • Leverage at 30th June 20191 of 1.8x, up marginally from 1.7x at 2018 H1
• Corporation Tax payments based on 2018 profit and 1.5x at 31st December 2018; down from 2.8x at demerger in 2016
18
1. Leverage ratio is calculated as net debt divided by 12 month rolling Adjusted EBITDA.Investing at the right time
➢ Acquisition of Look After My Bills places the Group in a strong
position to grow
Investment Impact
➢ We believe now is the right time to maximise the opportunity to FY19 (£m)
and we therefore intend to increase investment in H2 2019
➢ This investment will have an impact of up to £7m on full year
Adjusted Operating Profit expectations GoCo Group revenue nil
➢ Expect AutoSave customer numbers to grow by at least 25% in
the next five months to 31st December 2019 GoCo Group Marketing Costs (4)
➢ Our goal remains for AutoSave to be transformative to Group
earnings by 2022 GoCo Group Admin Costs (3)
➢ GoCo Group (via Energylinx) already powers Look After My Bills
and hence 100% of Look After My Bills revenue is already Investment Impact to FY19
(7)
recognised by GoCo Group (see appendix for detail) Adjusted Operating Profit
➢ There are no other changes to the Board’s expectations for the
full year 2019
19
1. Live Customers defined as those who have provided full switching authority to
enable a switch net of churned customersAgenda
1 Highlights & AutoSave | Matthew Crummack
2 Financial Review | Nick Wrighton
3 Price Comparison & Rewards | Lee Griffin
4 Summary | Matthew Crummack
20Price Comparison
Car insurance comparison market returning to growth
Car Insurance Premium Price vs. Aggregator Switching Volume1
% YoY Change
Car Insurance Premium Price
10.0% Average Car Insurance Premium Price
Aggregator Switching Volume • Car insurance premiums declined in Q1, but increased in Q2 both Quarter
7.8%
4.9% 6.0% on Quarter (+3%) and Year on Year (+5%)1
5.0%
• Major insurers have been reporting rising vehicle repair costs and are
1.9% therefore expected to increase premiums in short to medium term
0.0% 1.0%
-0.8% • Announcement on 15th July that the Ogden discount rate will increase to
-0.25%, lower than the 0 - 1% widely anticipated, will likely only increase
-5.0% -4.0% the need to raise premiums
-6.4%
-10.0% -9.0% Aggregator Switching Volumes
-9.3%
-11.2% • Latest management estimates indicate aggregator market was
-15.0% -14.0% returning to growth in the last 2 months of H1 2019
Q4 2017 Q1 2018 Q2 2018 Q3 2018 Q4 2018 Q1 2019 Q2 2019
1. Car insurance premium price based on Willis Towers Watson insurance pricing 21
index; switching volumes indicative performance based on management estimatesPrice Comparison
Solid performance, positioned for growth
Disciplined performance in a challenging market Positioning us to grow revenue in H2
Marketing Despite marketing inflation 46%1
1 Margin across the industry, we have
maintained our marketing Flat YoY
Stable margin at 46%
Launch of new brand proposition
Improved
Continued to make further
conversion improvements
+1.2ppt1 to drive awareness & preference,
2 positioning us to grow revenue in
Conversion through the funnel of core YoY
GoCompare.com business
H2 as the market recovers
Significant increases on
Increased revenue per interaction £5.191
3 Revenue Per driven by both conversion
Interaction and improved commercial +8.1% YoY
relationships
1. GoCompare.com only 22Price Comparison
Our new proposition is grounded in a detailed understanding of what
the consumer wants
“Which comes closest to your views?” “Extremely important when considering which PCW to use”
GoCompare Customers Indexed to Average PCW Buyers1 Top 4 Most important to GoCompare Segmented Customers
1. Finding the right insurance
I’d rather have better
I’d rather have better insurance than
insurance than incentives like 1.14
incentives like free movies or discounts
free movies or discounts
2. Holding insurers to account
I like Ithe
like incentives
the incentives thatPCWs
that Price
Comparison Websites offer for things 1.07
offer for things like free movies
like free movies or discounts
or discounts 3. Customer service ‘beyond the journey’
I’d rather have the cheapest price
I’d rather have the cheapest price than
than incentives like free movies
incentives like free movies or discounts
0.84 4. Insurance extras
or discounts
1. Based on a 3rd Party Consumer Survey completed for GoCompare by Old Street Science; 23
% of GoCompare customers selecting response / % for PCW buyersPrice Comparison
Unique customer-led proposition launched with new brand line
The right insurance always costs you less
When it matters, GoCompare
We empower you to compare on what matters
We are there for you when it matters
We are using our technical expertise to tackle industry issues that matter
Helping improve the
Comparison beyond
price There for you when the worst does happen insurance industry for
the better
Customer Experience Challenge industry norms;
ratings to show customer tech driven collaborations to
satisfaction as well as reduce crime, claims and
depth of cover premiums (e.g. fraud solution and
data-led pricing insight)
24Price Comparison
We are innovating to grow the switching market and increase our share
GoCompare has
Top of Mind Awareness always had Top of Mind Awareness
leading awareness
which we will
continue to
Saliency Visit harness
1. 2.
Preference Suitability ✓ Increases engagement
Visit Quote
✓ Improves loyalty
Quote
✓ Competitor differentiator
4.
Hand-over to Aftercare 3. ✓ Drives preference
insurance company Servicing Completion
Expertise
TRANSACTIONAL RELATIONSHIP-BASED
25Rewards
Focus on execution to deliver stable revenue despite competitive market
Improved Conversion Increased Commission per Transaction
Rewards Conversion Rewards CPA %
H1 average % average commission from retailers
• Rewards business is profitable and cash
generative
+0.4ppt
• Competitive market has led to a decline in
+1.3ppt overall traffic to the MyVoucherCodes
website
• However, a continued focus on improving
conversion and the underlying drivers of the
business has led to flat revenue year on year
with increased Adjusted Operating Profit
2018 H1 2019 H1 2018 H1 2019 H1
26Price Comparison & Rewards
Disciplined approach with innovation to grow in H2
• Disciplined H1 performance in a challenging market in Price Comparison
➢ GoCompare.com car insurance market share flat to H2 2018 with stable marketing margin of 46% 1
➢ Driven by further conversion improvements broadly offsetting marketing inflation
• Comparison market returning to growth
➢ Latest management estimates indicate aggregator market returning to growth in last 2 months of H1 2019
• Unique customer-led proposition launched with new brand line: The right
insurance always costs you less
➢ Innovation proposition to drive awareness & preference to grow revenue in H2 as the market recovers: Free £250
Off Your Excess
• Continued relentless focus on execution
➢ Relentless focus on increasing performance of core metrics on Price Comparison and Rewards
27
1. GoCompare.com onlyAgenda
1 Highlights & AutoSave | Matthew Crummack
2 Financial Review | Nick Wrighton
3 Price Comparison & Rewards | Lee Griffin
4 Summary | Matthew Crummack
28is uniquely positioned for growth
• Price Comparison focuses on discrete consumer segment existing approach highly
competitive and demanding
• Disciplined approach on Price Comparison and launch of new differentiated
consumer-led proposition to drive awareness and preference
• Innovation key to unlock growth AutoSave targets a huge opportunity with an
attractive business model
• AutoSave ambition to grow customers by at least 25% in the next five months to 31st
Dec 2019 and be transformative to Group earnings by 2022
29Appendix
302019 H1 Income Statement and Segmentation Overview
2019 H1 2018 H1 YoY (%)
Price Price Price
£m Rewards AutoSave Total Rewards AutoSave Total Rewards Total
Comparison Comparison Comparison
Revenue 72.0 3.6 0.4 76.0 72.1 3.7 - 75.8 0% -3% 0%
COS (22.3) (1.0) (0.4) (23.7) (21.2) (0.9) - (22.1) 5% 11% 7%
Gross Profit 49.7 2.6 - 52.3 50.9 2.8 - 53.7 -2% -7% -3%
Distribution Costs (16.9) (0.5) (6.3) (23.7) (17.5) (0.4) - (17.9) -3% 25% 32%
Trading Profit 32.8 2.1 (6.3) 28.6 33.4 2.4 - 35.8 -2% -13% -20%
Marketing Margin (%) 45.6% 58.3% n/a 37.6% 46.3% 64.9% n/a 47.2% -1ppt -7ppt -10ppt
Admin Costs (6.8) (0.9) (1.8) (9.5) (7.1) (1.8) (0.2) (9.1) -4% -50% 4%
Adjusted Op Profit 26.0 1.2 (8.1) 19.1 26.3 0.6 (0.2) 26.7 -1% 100% -28%
Group Costs (6.6) (5.7) 15.8%
Group Adjusted Op
12.5 21.0 -40%
Profit
31Indicative
Impact of Look After My Bills to GoCo Group
Pre-Acquisition Post-Acquisition
Energy Supplier Energy Supplier
Energy supplier pays GoCo Group
100% of switching fee £££££ £££££
Price Comparison GoCo Group maintains 100% of switching fee
Revenue £££££
£££££ Cost of Sales (££££)
Profit £ AutoSave
Revenue £££££
GoCo Group pays proportion of Cost of Sales for GoCo Group £££££ Cost of Sales -
fee to Look After My Bills £££££ = Profit excluding
£££££
Revenue for Look After My Bills Marketing Investment
Note: revenue/Trading Profit now recognised
in AutoSave segment, not Price Comparison
Marketing spend for Marketing spend for
customer acquisition from customer acquisition from
Look After My Bills P&L GoCo Group AutoSave P&L
Investment into Investment into
Marketing to acquire Marketing to acquire
customers customers
32Attractive business model and customer economics
Excellent unit customer economics (vary by Retention Rates) AutoSave payback timings dependent on rate of acquisition
Indicative Metrics Annual Customer Retention Rates Indicative Customer Profile
for AutoSave
70% 75% 80% 85% 90%
New Customers
Average Customer Lifetime 3.3 4.0 5.0 6.7 10.0 Retained Customers Increasingly large
# of Customers
retained customer
Proportion of 2019 Customers base driving
34% 42% 51% 61% 73% transformative
Remaining in 2022
EBITDA
Lifetime Value over 10 years
153 174 201 236 282
(Energy Only)1
Time
Target: Customer Lifetime Value > Customer Acquisition Costs
AutoSave Revenue
Profit Per AutoSave
Customer Customer Profit
AutoSave
LTV Profitability
Trajectory depends Time
Time on investment into
acquiring customers
Customer
Acquisition Spend
CAC
33
1. Assumes £30 per fuel, average 1.8 fuels per customer; discounted at 10% with 2% inflation on Energy switching fee;
assumes minimal annual cost to serveAutoSave
Look After My Bills: Key Transaction Highlights
✓ Developed into one of the fastest growing energy savings services
since appearing on BBC Dragon’s Den in 2018
Transaction Highlights
✓ Transformative business model
recurring revenue & higher lifetime value Upfront Consideration £6m
• Like weflip, delivers subscription-style model
(free to consumers, revenue from suppliers) Deferred Consideration & up to
• Provide GoCo Group with relevance and expertise Performance Based Earn-out £6.5m
• Track record in acquiring customers at low cost of acquisition,
particularly utilising social channels
• Proven capability for switching customers and delivering a strong customer
Live Customers >150k1
experience
Equivalent CAC based on upfront
~£40
✓ Goal to achieve seamless technological integration with consideration2
• Energylinx already fulfils the switching capabilities
Indicative Lifetime Value3
£150+
✓ Combined performance of weflip and Look After My Bills to be (Energy Only)
reported as a distinct segment, AutoSave
Headcount 36
(inc. 2x founders)
✓ Customers sign up providing full switch authority but not all might
be immediately able to switch and hence a potential lag to switches
1. Live Customers defined as those who have provided full switching authority to enable a switch net of churned customers 34
2. Equivalent Customer Acquisition Costs based on upfront consideration and customers acquired at acquisition
3. Discounted; conservative assumptions based on 70% retention rate (see previous slide)You can also read