The Role of E-Services, Quality System and Perceived Value on Customer Satisfaction: An Empirical Study on Indonesian SMEs - Journal of Industrial ...
←
→
Page content transcription
If your browser does not render page correctly, please read the page content below
Journal of Industrial Engineering & Management Research
                       Vol.2 No.3                   DOI: https://doi.org/10.7777/jiemar.v2i3
                       http://www.jiemar.org                        e-ISSN : 2722-8878

 The Role of E-Services, Quality System and Perceived
 Value on Customer Satisfaction: An Empirical Study on
                   Indonesian SMEs
                             Bunga Aditi1, Hafizah2, Hermansyur3
            1,2,3
                    Fakultas Ekonomi dan Bisnis Harapan , Universitas Harapan Medan
                           Corresponding email : bunga.aditi16@gmail.com

Abstract - The purpose of this study is to analyze e-service, system quality, perceived value and
satisfaction for customer of Indonesian SMEs. This research was conducted by distributing 140
online questionnaires to customer of Indonesian SMEs and there were 124 questionnaires that
were reversed and processed. Sampling method with snowball sampling. The test was carried out
with the help of a statistical tool in the form of Structural Equation Modeling (SEM) based on
Partial Least Square version 3. The results showed that Based on the results of the hypothesis
testing, there was a positive and significant relationship between E-Service and Perceived Value.
there was a positive and not significant relationship between System Quality and Perceived
Value. that there was a positive and significant relationship between perceived value and e-
satisfaction. there was a positive and significant relationship between E-Service and e-
satisfaction through perceived value. This study found that e-service has a positive and
significant impact on e-satisfaction through perceived value. There are a positive and not
significant relationship between system quality and e-satisfaction through perceived value. The
novelty of this research is the correlation model of effect of e-service, system quality and
perceived value on e-satisfaction of SMEs.

Keywords: e-service, system quality, perceived value, customer satisfaction , Indonesian SMEs

Introduction

The COVID-19 pandemic has hit many economic sectors in Indonesia. One of the sectors most
affected by the COVID-19 pandemic is micro, small and medium enterprises (MSMEs), which
has also resulted in a decline in the national economy. This is understandable because MSMEs
have a very large contribution to the national economy. Based on BPS data, the number of
MSME actors in Indonesia is 64.2 million or 99.99% of the total number of business actors in
Indonesia. In addition, according to the Ministry of Cooperatives and Small and Medium
Enterprises (Kemenkop and UKM), the labor absorption capacity of MSMEs can also be said to
be high because it can absorb up to 119 million workers or 97% of the labor absorption capacity

                                                                                               193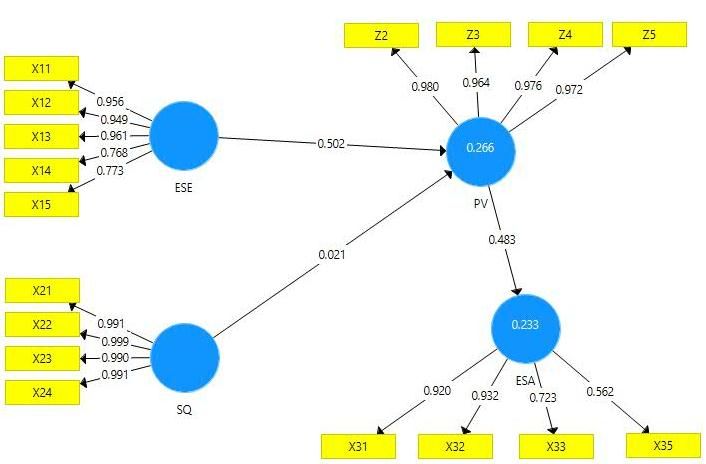
Journal of Industrial Engineering & Management Research
                    Vol.2 No.3                       DOI: https://doi.org/10.7777/jiemar.v2i3
                    http://www.jiemar.org                            e-ISSN : 2722-8878

of the business world. From the data above, Indonesia has the potential for a strong national
economic base because the number of MSMEs, especially micro-enterprises, is very large and
the absorption of labor is very large. According to (2016) The potential of MSMEs seems to be
realized by the government. Therefore, during this pandemic, the government has taken various
policies to increase the capacity of micro and small businesses so that they can be promoted to
medium-sized businesses and also to be able to compete in the digital era. The Financial Services
Authority noted that the distribution of micro, small and medium enterprises (MSME) loans
continued to grow towards the end of 2020. Credit has the potential to grow in line with the high
demand for new capital in 2021. Currently, there are more than 65 million MSMEs spread across
Indonesia. In 2016, there were 61.7 million MSMEs in Indonesia. The number continues to
increase, in 2017, the number of MSMEs reached 62.9 million and in 2018, the number of
MSMEs reached 64.2 million. It is predicted that in 2019, 2020 to 2021 the number will continue
to increase and experience growth.

According to Susanto (2020) The development of digital technology allows MSME actors to
market their products online and make transactions through the online banking system as well.
Social media is the easiest digital marketing tool to use. Before a business has a website, it is not
uncommon to find, especially in markets like Indonesia, that they have started to enter the realm
of cyberspace through social media. This can be a stimulant for the development of
entrepreneurship and the sustainability of MSMEs. In addition to the low cost and no need for
special skills in initial initiation, social media is considered capable of directly reaching (engage)
potential consumers. Therefore, it is not surprising that business actors focus more on the use of
social media than on the development of a site. According to Sulthan (2021) The MSME actors
are hampered by the lack of knowledge about digital marketing and electronic commerce (e-
commerce). The potential use of digital marketing requires people to be technology literate,
therefore socialization and training on the use of information and communication technology is
needed. This community service activity regarding the use of digital marketing is expected to
provide knowledge and understanding and can inspire MSME actors in utilizing internet
technology and social networks as tools to run their business.

According Salimon et al (2021), Saxena et al. (2021) measurement of information system
processes that focus on the results of the interaction between the system and users, which
includes such as equipment availability, equipment reliability, ease of use, and response time of
an information system used or not used. Thus the level of use of a better quality e-learning
system can make academic actors more motivated to use e-learning systems. According El
Saghier (2021), Kumbhar (2012) in their research suggests adding other variables that can
affect user e-satisfaction such as the effectiveness of use and increasing the number of research
samples. Based on the opinion According Rahmi et al. (2018),Salimon et al (2021), Saxena et al.
(2021) that the quality of the system can be measured in terms of access speed, system reliability,
ease and effectiveness to use, ease of access, and system security. Therefore, the authors choose
the system quality variable to analyze whether the quality of the system also affects the e-
satisfaction of users of the e-learning system
                                                                                                  194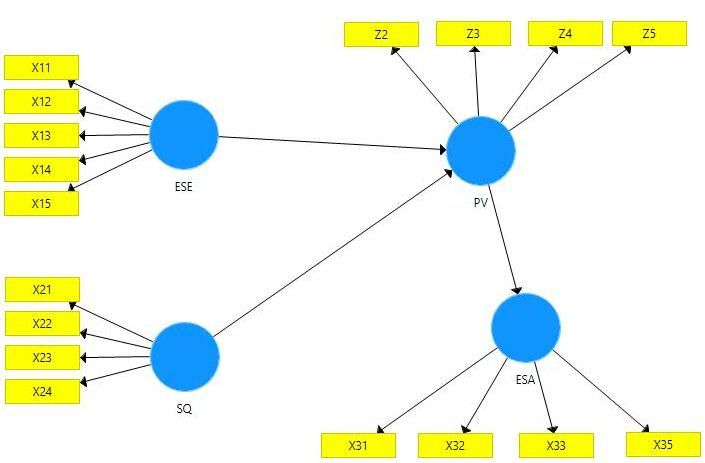
Journal of Industrial Engineering & Management Research
                    Vol.2 No.3                       DOI: https://doi.org/10.7777/jiemar.v2i3
                    http://www.jiemar.org                            e-ISSN : 2722-8878

E-service quality is defined as the extent to which a website facilitates the efficient and effective
use of something. The better the e-service, the more e-satisfaction will be. This is supported by
research from Saxena et al. (2021)that the relationship between e-service quality and e-
satisfaction is said to also have a unidirectional relationship, this can be seen in the value of the
regression direction coefficient is positive, which is also in line with research According
Kumbhar (2012), Pham et al. (2019), Rahmi et al. (2018) that the partial test proves that service
quality has a significant effect on customer satisfaction. According Demir at al.(2020), Zeglat et
al. (2016), El Saghier (2021), Kumbhar (2012) also revealed that e-service quality has a
positive and significant effect on customer satisfaction, the better the e-service quality provided
by the company to customers, the higher the level of customer satisfaction will be. However,
According Demir at Saxena et al. (2021) says that the quality of e-service which consists of 5
dimensions, namely ease of use, e-scape, reliability, customization and guarantee does not have a
positive effect on e-satisfaction. Indeed, not all e-commerce sectors prioritize e-service, but it is
proven that the e-service quality variable has a significant effect on e-satisfaction in service
products or intangible products The test conducted by Rahmi et al. (2018),Salimon et al (2021),
Saxena et al. (2021) shows that the e-service quality variable has a positive influence on e-
satisfaction, E-service quality on a website has a significant influence on customer satisfaction,
because the customer experience using the website in conducting transactions makes customers
directly feel the pros and cons of e-service quality.
H1: E-Service has a significant positive effect on Perceived Value of Indonesian SMEs Customer

System quality is a measurement of the information system process that focuses on the results of
the interaction between the user and the system. The quality of the system can be measured by
looking at its functional part, namely usability. So of course the quality of this system will
greatly affect the e-satisfaction of online-based users. According Demir at al.(2020), Zeglat et al.
(2016), El Saghier (2021), Kumbhar (2012) Tangible variables, reliability, responsibility,
assurance, and empathy partially have a significant effect on student satisfaction on academic
websites This is supported by research that the better the perceived quality of the system, the
more user satisfaction of the e-learning system will be. The same thing is also stated by Zeglat et
al. (2016), El Saghier (2021) that the quality of the system has no effect on user satisfaction. Of
course this is contrary to other research, because like the quality of the tax system in Indonesia,
the quality of the system has a significant effect on E-filling User Satisfaction, so the higher the
quality of the system, the greater the satisfaction of users of the system.
H2: System quality has a significant positive effect on Perceived Value of Indonesian SMEs
Customer

Perceived value is the difference between a prospective assessment of what benefits are received
and the costs incurred by consumers for a product. This prospective difference will certainly be a
factor that strengthens or weakens the relationship of e-service and system quality to e-
satisfaction. This is supported by previous research that the feeling of getting value for the
product will be very influential and significant. Research from Kumbhar (2012), Pham et al.
                                                                                                 195
Journal of Industrial Engineering & Management Research
Vol.2 No.3 DOI: https://doi.org/10.7777/jiemar.v2i3
http://www.jiemar.org e-ISSN : 2722-8878
(2019), Rahmi et al. (2018),Salimon et al (2021), Saxena et al. (2021)also shows that perceived
usefulness has an effect on user satisfaction, as well as research Zeglat et al. (2016), El Saghier
(2021) which shows the results have the same effect. Based on the results of the tests that have
been carried out by (Ansyari et al., 2019) it was found that perceived value has a significant
effect on consumer satisfaction.
H3 : Perceived Value has a significant positive effect on customer satisfaction of Indonesian
SMEs Customer
H4: E-Service has a significant positive effect on customer satisfaction through Perceived Value
of Indonesian SMEs Customer
H5: System quality has a significant positive effect on customer satisfaction through Perceived
Value of Indonesian SMEs Customer
Method
Researchers used a quantitative approach in this study. Quantitative methods are methods used in
certain populations or samples, data collection using research instruments, data analysis is
quantitative with the aim of testing established hypotheses (Sugiyono, 2012). This study uses the
help of a questionnaire instrument which is carried out cross-sectionally or at a certain time. The
scale used is the Likert scale, namely the size of the rating scale in stages. The sampling
technique used is purposive sampling which conducts research on a group of subjects with
certain characteristics or is considered closely related to previously known population
characteristics. This research was conducted by distributing 140 online questionnaires to
consumers of SMEs and there were 124 questionnaires that were reversed and processed.
Sampling method with snowball sampling. Statistical testing in this study was carried out with
the help of the Statistical Structural Equation Modeling (SEM) tool based on Partial Least Square
version 3. The validity test was used to measure the validity of the inductor items in a
questionnaire. The validity test in this study uses convergent validity by looking at the minimum
value of the factor loading indicator for each indicator item 0.6 (Purwanto, 2021). The next
reliability test is by looking at the Cronbach's Alpha value and the Composite Reliability value
used to measure internal consistency in the data reliability test, as well as the AVE (Average
Variance Extracted) value as the average percentage of variance scores extracted from a set of
latent variables estimated through loading standardize. For this test, the researcher will also use
the limits of Composite Reliability > 0.7 and Cronbach's Alpha > 0.6 (Purwanto, 2020), and
AVE value > 0.5
Hypothesis testing
According to Hair et al.(2019) after a research model is believed to be fit, a hypothesis test can
be carried out. The next step is to test the hypothesis that has been built in this study. Hypothesis
testing using the Bootstrapping function on SmartPLS 3.0. The hypothesis is accepted when the
significance level is less than 0.05 or the t-value exceeds the critical value (Hair et al, 2014). The
value of t statistics for the 5% significance level is 1.96.
196Journal of Industrial Engineering & Management Research
Vol.2 No.3 DOI: https://doi.org/10.7777/jiemar.v2i3
http://www.jiemar.org e-ISSN : 2722-8878
Fig 1. Research Model
H1 : E-Service has a significant positive effect on the Perceived Value of Indonesian SMEs
Customer
H2 : The quality of the system has a significant positive effect on the Perceived Value of
Indonesian SMEs Customer
H3: Perceived Value has a positive effect on e-satisfaction. of Indonesian SMEs Customer
H4 : E-Service has a significant positive effect on e-satisfaction through the Perceived Value of
Indonesian SMEs Customer
H5 : System quality has a significant positive effect on e-satisfaction through Perceived Value of
Indonesian SMEs Customer
Result and Discussion
Reliability test
According to Hair et al (2019), reliability is a measure of the internal consistency of indicators of
a construct that shows the degree to which each of these indicators shows a general latent
construct. According to Hair et al. (2019) the reliability requirement is a measure of the stability
and consistency of the results at different times. To test the reliability of the construct in this
study used the value of composite reliability. A variable is said to meet construct reliability if it
has a composite reliability value > 0.7 (Purwanto et al, 2019) and the apha crobanch value > 0.7
has a good level of reliability for a variable.
197Journal of Industrial Engineering & Management Research
Vol.2 No.3 DOI: https://doi.org/10.7777/jiemar.v2i3
http://www.jiemar.org e-ISSN : 2722-8878
Table 1. Reliability Testing Result
Cronbach's rho_A Composite Average Variance
Alpha Reliability Extracted (AVE)
E-Satisfaction 0.812 0.895 0.872 0.693
E-Service 0.933 0.876 0.948 0.785
Perceived 0.981 0.984 0.986 0.946
Value
System Quality 0.995 0.999 0.996 0.985
In table 1, it can be seen the results of the reliability test analysis using the SmartPLS tool which
states that all composite reliability values are greater than 0.7, which means that all variables are
reliable and have met the test criteria. Furthermore, the value of cronbanch's omission also shows
that all cronbanch's 'alpa' values are more than 0.6 and this indicates the level of reliability of the
variable has also met the criteria.
Convergent Validity
Convergent validity is used to measure the correlation between item scores and construct scores,
the higher the correlation the better the data validity (Purwanto et al, 2021). Measurement
Measurement can be categorized as having convergent validity if the loading factor value is >
0.7.
Fig. 2. Validity Testing
Discriminant Validity
Discriminant validity is a test of construct validity by predicting the size of the indicator from
each block (Hair, 2019). One of the discriminant validity can be seen by comparing the AVE
value with the correlation between other constructs in the model. If the AVE root value is > 0.50,
198Journal of Industrial Engineering & Management Research
Vol.2 No.3 DOI: https://doi.org/10.7777/jiemar.v2i3
http://www.jiemar.org e-ISSN : 2722-8878
it means that discriminant validity is reached (Hair, 2018). Discriminant validity was also carried
out based on the Fornell Larcker Criterion measurement with the construct. If the correlation of
the constructs on each indicator is greater than the other constructs, it means that latent
constructs can predict indicators better than other constructs (Purwanto et al, 2020).
Table 2. Discriminat validity Result
E- E-Trust E-Word of Repurchase
Satisfaction Mouth Intention
E-Satisfaction 0.799
E-Service 0.703 0.886
Perceived Value 0.405 0.407 0.973
System Quality 0.456 0.564 0.350 0.993
Based on table 2, it appears that each statement indicator has the highest loading factor value in
the tested latent constructs than other latent constructs, meaning that each statement indicator can
be predicted well by each latent construct in other words discriminant validity is valid.
R Square Value
The value of R square (R2) is a measure of the proportion of the variation in the value of the
affected variable which can be explained by the variable that influences it. If in a study using
more than two independent variables, then the adjusted r-square (adjusted R2) is used. The value
of r square adjusted is a value that is always smaller than r square. The R2 value is close to 1,
with the limiting criteria being divided into 3 classifications, If the value of R2 = 0.67 Model is
substance (strong), If the value of R2 = 0.33 the model is moderate (medium) and If the value of
R2 = 0.19 the model is weak (bad)
Table 3. R Square Value
R Square R Square
Adjusted
E-Satisfaction 0.223 0.225
Perceived Value 0.266 0.249
Based on table 3, the R Square of E-Satisfaction value is 0.223 or 22.3% means that the E-
Satisfaction variable is influenced by the Perceived Value, E-Service, System Quality variable by
22.5%, while the remaining 77.5% is influenced by other variables not discussed in this study.
the R Square of Perceived Value is 0.249 or 24.9% means that the Perceived Value is
influenced by the Perceived Value E-Service, System Quality variable by 24.9%, while the
remaining 75.1% is influenced by other variables not discussed in this study.
199Journal of Industrial Engineering & Management Research
Vol.2 No.3 DOI: https://doi.org/10.7777/jiemar.v2i3
http://www.jiemar.org e-ISSN : 2722-8878
Hypothesis testing
According to Hair et al.(2019) after a research model is believed to be fit, a hypothesis test can
be carried out. The next step is to test the hypothesis that has been built in this study. In this case,
the bootstrapping method is applied to the sample. Testing with bootstrapping is intended to
minimize the problem of abnormal research data.
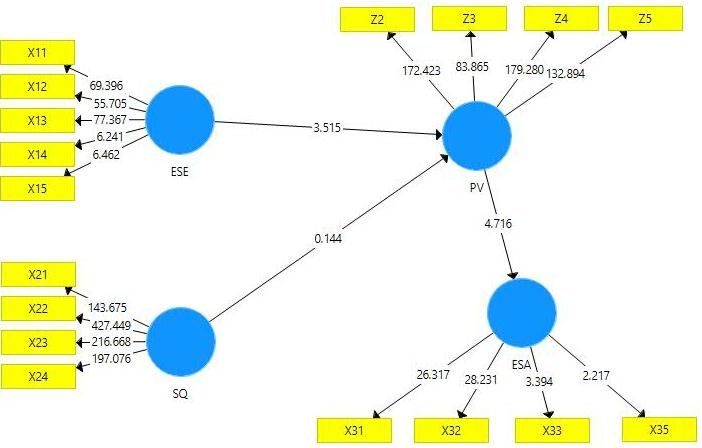
Fig. 3. Hypothesis Testing
The last step of the test using the Smart Pls application is hypothesis testing and is carried out by
looking at the results of the bootsrapping value. Hypothesis testing using the Bootstrapping
function on SmartPLS 3.0. The hypothesis is accepted when the significance level is less than
0.05 or the t-value exceeds the critical value (Hair et al, 2014). The value of t statistics for the
5% significance level is 1.96.
Table 4. Hypotesis Testing
Correlation Original T P Note
Sample Statistics Values
(O)
ESE-PV 0.502 3.515 0.000 Significant
SQ-PV 0.021 0.147 0.144 Not Significant
PV-ESA 0.020 4.716 0.000 Significant
ESE- PV-ESA 0.242 2.647 0.008 Significant
SQ-PV-ESA 0.010 0.410 0.889 Not Significant
Relationship of E-Service to Perceived Value
200Journal of Industrial Engineering & Management Research
Vol.2 No.3 DOI: https://doi.org/10.7777/jiemar.v2i3
http://www.jiemar.org e-ISSN : 2722-8878
Based on the results of the hypothesis testing, the original sample value was positive 0.502 and
the T value was 3.515 < 1.96 and P value 0.000 < 0.050 so it was concluded that there was a
positive and significant relationship between E-Service and Perceived Value. This study found
that E-Service has a positive and insignificant effect on Perceived Value. These results are in line
with research conducted by According Demir at al.(2020), Zeglat et al. (2016), El Saghier
(2021), Kumbhar (2012) that there was a positive and significant relationship between E-Service
and Perceived Value. These results are in line with research conducted by According Demir at
al.(2020), Zeglat et al. (2016), El Saghier (2021), Kumbhar (2012), Pham et al. (2019), Rahmi et
al. (2018),Salimon et al (2021), Saxena et al. (2021) that E-Service has a positive and
insignificant effect on Perceived Value
Relationship between System Quality and Perceived Value
Based on the results of the hypothesis testing, the original sample value was positive 0.021 and
the T value was 0.147 < 1.96 and P value 0.144 > 0.050 so it was concluded that there was a
positive and not significant relationship between System Quality and Perceived Value. This
study found that the quality of the system has a positive and not insignificant effect on Perceived
Value. These results are not in line with research conducted by Rahmi et al. (2018),Salimon et al
(2021), Saxena et al. (2021) that the quality of the system has a positive and not insignificant
effect on Perceived Value
Relationship of Perceived Value to customer satisfaction
Based on the results of the hypothesis testing, the original sample value was positive 0.020 and
the T value was 4.716 > 1.96 and P value 0.000 < 0.050 so it was concluded that there was a
positive and significant relationship between Perceived Value and e-satisfaction. This study
found that Perceived Value has a positive and insignificant effect on e-satisfaction. These results
are in line with research conducted by According Rahmi et al. (2018),Salimon et al (2021),
Saxena et al. (2021) that Perceived Value has a positive and insignificant effect on e-satisfaction
Relationship of E-Service to customer satisfaction through Perceived Value
Based on the results of the hypothesis testing, the original sample value was positive 0.042 and
the T value was 2.647 > 1.96 and P value 0.008 < 0.050 so it was concluded that there was a
positive and significant relationship between E-Service and e-satisfaction through Perceived
Value. This study found that E-Service has a positive and significant impact on e-satisfaction
through Perceived Value. These results are in line with research conducted by According Demir
at al.(2020), Rahmi et al. (2018),Salimon et al (2021), Saxena et al. (2021) that there was a
positive and significant relationship between E-Service and e-satisfaction through Perceived
Value.
Relationship between system quality and e-satisfaction through Perceived Value
Based on the results of the hypothesis testing, the original sample value was positive 0.010 and
the T value was 0.410 < 1.96 and P value 0.889 > 0.050 so it was concluded that there was a
201Journal of Industrial Engineering & Management Research
Vol.2 No.3 DOI: https://doi.org/10.7777/jiemar.v2i3
http://www.jiemar.org e-ISSN : 2722-8878
positive and not significant relationship between system quality and e-satisfaction through
Perceived Value. This study found that the quality of the system has a positive and not
significant impact on e-satisfaction through Perceived Value. These results are not in line with
research conducted by According Demir at al.(2020), Zeglat et al. (2016), El Saghier (2021),
Kumbhar (2012), Pham et al. (2019), Rahmi et al. (2018),Salimon et al (2021), Saxena et al.
(2021) that the quality of the system has a positive and not significant effect on e-satisfaction
through Perceived Value
According to Susanto (2020), Zeglat (2016) digital marketing is a two-way communication that
can lead to public awareness and engagement with certain products and brands. Changes in
marketing behavior from conventional to digital are not matched by the presence of MSME
actors who use digital marketing, even though MSMEs are believed to be able to spur the
Indonesian economy. The use of digital marketing concepts is a hope for MSMEs to develop into
centers of economic power. MSMEs can take advantage of digital technology, especially social
media as a means of digital marketing. In addition to low costs, and no special expertise is
needed in initial initiation, social media is considered capable of directly reaching consumers.
The lack of knowledge of MSME actors about digital marketing has inspired this community
service team to become an obstacle for business actors in marketing their products, which often
evolves over time. If MSME actors understand the importance of digital technology, in this case
digital marketing for their business, it is hoped that they will be motivated to use digital
marketing as a means of promotion. optimally, but they face several obstacles, such as a lack of
understanding of information technology. According to Andre at al. (2020), Sulthan (2021)
Digital marketing is used to build brand awareness as an effort to provide information, promote
and remind the public about MSME product. The results of this study are managing Instagram
social media by carrying out promotional activities such as advertisements, taglines, sales
promotions or managing social media which provide effectiveness in building brand awareness
for the Binong knitted industry products. Sulaksono & Zakaria (2020) revealed that increasing
knowledge and managing digital marketing and social media is the main thing, for SMEs to
increase their marketing and company profits.
According to Susanto (2020) and Zeglat (2016) In the business context, people engagement can
lead to profit creation. Dissemination of digital marketing strategies in the form of the use of
social media is very important because it can provide knowledge to MSME actors regarding
ways and stages in expanding consumer networks through the use of social media in marketing
their products so that they can increase their superiority. Changes in marketing behavior from
conventional to digital are not balanced by the presence of MSME actors who use digital
marketing, even though MSMEs are believed to be able to spur the Indonesian economy.
According to Andre at al. (2020), Sulthan (2021) the use of digital technology-based marketing
concepts is a hope for MSMEs to develop into economic powerhouses. MSMEs can use social
media as a means of digital marketing. In addition to the low cost and no need to have special
202Journal of Industrial Engineering & Management Research
Vol.2 No.3 DOI: https://doi.org/10.7777/jiemar.v2i3
http://www.jiemar.org e-ISSN : 2722-8878
skills in doing the initial initiation, social media is considered capable of directly reaching
consumers.
Conclusion
Based on the results of the hypothesis testing, there was a positive and significant relationship
between E-Service and Perceived Value. there was a positive and not significant relationship
between System Quality and Perceived Value. that there was a positive and significant
relationship between Perceived Value and e-satisfaction consumers of SMEs. there was a
positive and significant relationship between E-Service and e-satisfaction through Perceived
Value. This study found that E-Service has a positive and significant impact on e-satisfaction
through Perceived Value. there was a positive and not significant relationship between system
quality and e-satisfaction through Perceived Value. The results showed that SMEs have an
awareness that customer relationships good and good product quality can affect SME financial
performance through customer satisfaction. Satisfied consumers will have an effect on sales
where consumers can help directly not directly with promotions to customers new, so that sales
of SME products experienced improvement. Consumer satisfaction will have an impact on free
promotions through customer recommendations to new customers, so SMEs need consider
product quality to stay maintained and the image of the product and service to customers, build
good relationships with customers. It can increase sales, profits and improve the financial
performance of SMEs. Results research shows that consumer satisfaction positive and significant
effect on performance SMEs.
References
1. Andre , J. ., Alex P, A. P., Erix, E., Citra , S., & Wijaya , S. . (2020). ANALYSIS
SERVICE QUALITY TOWARDS CUSTOMER SATISFACTION . International
Journal of Social and Management Studies, 1(1), 105–116.
https://doi.org/10.5555/ijosmas.v1i1.65
2. Demir, A., Maroof, L., Khan, N. U. S., & Ali, B. J. (2020). The role of E-service quality
in shaping online meeting platforms: a case study from higher education sector. Journal
of Applied Research in Higher Education.
3. El Saghier, N. M. Students Satisfactions with E-Learning Mediating the E-Service
Quality-Behavioral Intention Link: The Case of Public Universities in Egypt.
4. Kartika, H., Kholil, M., & Setia Bakti, C. (2020). SERVICE QUALITY AND
CUSTOMER SATISFACTION IN FURNITURE SECTOR INSTALLATION
SERVICES. Journal of Industrial Engineering & Management Research, 1(2), 103-111.
https://doi.org/10.7777/jiemar.v1i2.44
203Journal of Industrial Engineering & Management Research
Vol.2 No.3 DOI: https://doi.org/10.7777/jiemar.v2i3
http://www.jiemar.org e-ISSN : 2722-8878
5. Kumbhar, V. M. (2012). Conceptualization of e-services quality and e-satisfaction: a
review of literature. Management research and practice, 4(4), 18-18.
6. Linda, T., Herawati, A., Kanwo, K., & Santoso , W. H. (2020). FOOD AND
BEVERAGE DEPARTMENT CUSTOMER SATISFACTION. Journal of Industrial
Engineering & Management Research, 1(4), 123 - 127.
https://doi.org/10.7777/jiemar.v1i4.191
7. Purwanto, A., Asbari, M., & Santoso, T. (2021). Education Management Research Data
Analysis: Comparison of Results between Lisrel, Tetrad, GSCA, Amos, SmartPLS,
WarpPLS, and SPSS For Small Samples. Nidhomul Haq : Jurnal Manajemen Pendidikan
Islam, 6(2), 382-399. https://doi.org/10.31538/ndh.v6i2.1575
8. Purwanto,A., Masduki Asbari,Teguh Iman Santoso, Vip Paramarta Denok Sunarsi
(2021).Social and Management Research Quantitative Analysis for Medium Sample:
Comparing of Lisrel, Tetrad, GSCA, Amos, SmartPLS, WarpPLS, and SPSS.Jurnal
Ilmiah Ilmu Administrasi Publik: Jurnal Pemikiran dan Penelitian Administrasi
Publik.9(2).518-532
9. Purwanto,A.,Masduki Asbari,Teguh Iman Santoso,Marissa Grace Haque,Nurjaya
(2021)Marketing Research Quantitative Analysis for Large Sample: Comparing of Lisrel,
Tetrad, GSCA, Amos, SmartPLS, WarpPLS, and SPSS.Jurnal Ilmiah Ilmu Administrasi
Publik: Jurnal Pemikiran dan Penelitian Administrasi Publik.9(2).355-372
10. Purwanto, A., Asbari, M., Santoso, T. I., Sunarsi, D., & Ilham, D. (2021). Education
Research Quantitative Analysis for Little Respondents. Jurnal Studi Guru Dan
Pembelajaran, 4(2), 335-350.
11. Pham, L., Limbu, Y. B., Bui, T. K., Nguyen, H. T., & Pham, H. T. (2019). Does e-
learning service quality influence e-learning student satisfaction and loyalty? Evidence
from Vietnam. International Journal of Educational Technology in Higher
Education, 16(1), 1-26.
12. Rahmi, B. A. K. I., Birgoren, B., & Aktepe, A. (2018). A meta analysis of factors
affecting perceived usefulness and perceived ease of use in the adoption of e-learning
systems. Turkish Online Journal of Distance Education, 19(4), 4-42.
13. Salimon, M. G., Sanuri, S. M. M., Aliyu, O. A., Perumal, S., & Yusr, M. M. (2021). E-
learning satisfaction and retention: a concurrent perspective of cognitive absorption,
perceived social presence and technology acceptance model. Journal of Systems and
Information Technology.
14. Saxena, C., Baber, H., & Kumar, P. (2021). Examining the moderating effect of
perceived benefits of maintaining social distance on e-learning quality during COVID-19
pandemic. Journal of Educational Technology Systems, 49(4), 532-554.
15. Sulthan, N., Jaswadi, J., & Sulistiono, S. (2021). A case study of the analysis of business
process modelling and notation for purchase order and Product receipt in small medium-
sized enterprises. Journal of Industrial Engineering & Management Research, 2(5), 44 -
50. https://doi.org/10.7777/jiemar.v2i5.193
16. Susanto, R., Novitasari, D., Yuwono, T., & Asbari, M. (2020). Analysis The Influence of
Prices and Features of Honda Vario 125 CBS 2020 on Purchase Decisions for Candidate
204Journal of Industrial Engineering & Management Research
Vol.2 No.3 DOI: https://doi.org/10.7777/jiemar.v2i3
http://www.jiemar.org e-ISSN : 2722-8878
Consumers in The Tangerang City Region. Journal of Industrial Engineering &
Management Research, 1(3), 184-199. https://doi.org/10.7777/jiemar.v1i3.78
17. Zeglat, D., Shrafat, F., & Al-Smadi, Z. (2016). The Impact of the E-Service Quality (E-
SQ) of Online Databases on Users' Behavioural Intentions: A Perspective of Postgraduate
Students. International Review of Management and Marketing, 6(1).
205You can also read