Investor Presentation - Advanced Info Service Plc. May 2018 Ticker: ADVANC (SET) - Advanced Info Services Public ...

Page created by Gilbert Hayes
 
CONTINUE READING
Investor Presentation - Advanced Info Service Plc. May 2018 Ticker: ADVANC (SET) - Advanced Info Services Public ...
Investor Presentation
                     Advanced Info Service Plc.
                                             May 2018

                     Ticker: ADVANC (SET)
                               AVIFY (ADR)
Add AIS IR LINE@
Investor Presentation - Advanced Info Service Plc. May 2018 Ticker: ADVANC (SET) - Advanced Info Services Public ...
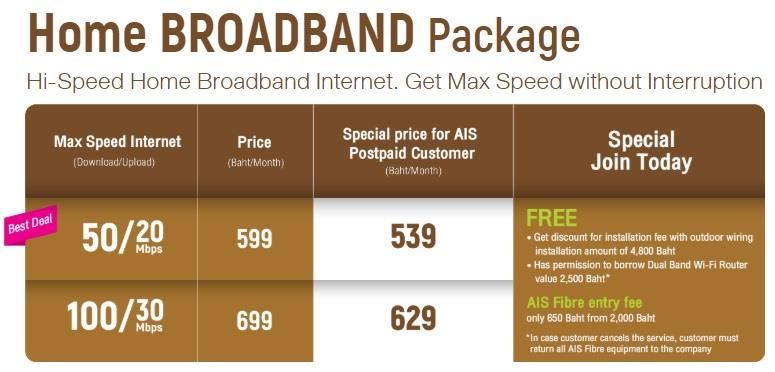
AIS: Digital Life Service Provider
   Lead and digitally transform in                             Grow stronger in                          Partner to offer differentiated
             “Mobile”                                        “Fixed broadband”                                “Digital service”
       Mobile revenue market share                           Subscriber market share                         Focused on FOUR key areas
                                                                 (approx.8.2mn)
                  27%
                                  48%                               34%
                     4Q17
                                                                               21%
                                                                       4Q17
                 25%
                                                                                     6.4%                                      Mobile
                                                                     40%                                             Video
                                                                                                                               money
1Q18 breakdown
                        prepaid    postpaid
   Bt31bn                                                                                                                     Enterprise
                                                                                                                      IoT     Business
                       19%                               4th year of operation in 2018
    60% Mobile                       43%
        data
                       81%                                  covering 50 key cities out of
    40% Voice                        57%                    77 provinces

Mobile revenue        subs        % to mobile              expect to cover 6mn homepass*
                     40.1mn        revenue                 out of total 21.5m households
                                        Digital life service provider with convergence products

 Mark leadership in mobile data                    Aim to be a significant player in                   Pursue long-term growth with
 • Nationwide 4G/3G/2G coverage                    2020                                                integrated services
   with focus on network quality                   • Leverage existing nationwide fibre                • Emphasize partnership &
 • Focus on scale to maintain cost                   infrastructure                                       ecosystem
   advantage                                       • Defensive value to core mobile                    • Leverage the large sub base and
                                                     business                                             telecom infrastructure

*Homepass is defined as a number of households within AIS fibre service area. This includes the homes that require additional investment i.e.
port, last miles to be able to get connected.
                                                                                                                                                2
Investor Presentation - Advanced Info Service Plc. May 2018 Ticker: ADVANC (SET) - Advanced Info Services Public ...
AIS’ digital transformation toward 2020
                       Next Generation          Next Generation                  Next Generation                 Next Generation
                          Network                 Economy                          Xperience                         Team
                       Network Function           Contents and                                Full Service
                                                                       Customer Value                              Organization
                        Virtualization &           Enterprise                                 Digitization
                                                                        Management                                Transformation
                        Cloudification             Segments

                       • > 90%
Target 2020

                                                • Expand revenue      • Move to ARPH        • Provide shops &    • Data-driven
                         cloudification           contribution of     • Improve revenue       services that        organization &
                       • Network                  enterprise business   assurance and         never sleep          culture
                         virtualization ready     from 9% to 25%        add valued users
                         for 5G

                       • 5G future-proof        New opportunities:    Data-driven           • Digitize all       • Organization
Strategy toward 2020

                         networks                • IoT                analysis based on       customer             readiness for
                                                 • SME & R-SME        customer insights:      journeys             digital disruption
                       • IT legacy               • Managed
                         transformed to            Security           Bundle mobile,        • AI/Chatbots        • Leverage
                         Cloud-friendly          • Mobile Digital     fibre & content via     embedded into        capabilities and
                         network                   Marketing          FMC                     all self-service     create synergies
                         architecture                                                         channels             in value chain
                                                Maximize value of
                                                                                                                   supporting digital
                                                contents in
                       • AI for network                                                     • Deployment of        business
                                                customer retention
                         operation                                                            OMNI channels        objectives
                                                and branding
                                                                                                                                        3
Investor Presentation - Advanced Info Service Plc. May 2018 Ticker: ADVANC (SET) - Advanced Info Services Public ...
1Q18 Quarterly Summary

                   Service revenue improved in all segments                                   Strategic executions
        (Bt mn)
         Service                                                 ▲6.5% YoY                          Expand into enterprise market
         revenue
                                                        34,565   ▲2.5% QoQ
                                                                                    •   Paid Bt3.4bn for 81.47% of CSL’s shares
                                                                 ▲3.1% YoY
               Mobile                                 31,172     ▲0.5% QoQ          •   Fully consolidated since Feb-18
                                                                                    •   Incurred goodwill of Bt2.8bn
                                   ▲85% YoY                                         •   Final tender offer until 6-Jul at Bt7.80/share
                 FBB       1,013
                                   ▲6% QoQ              • 7.6GB/sub of mobile
                                   ▲63% YoY
                                                          data consumption
              Others       962                          • 51k of FBB net addition           Widen e-service/mobile payment to
                                   ▲51% QoQ
                                                        • CSL revenue                       Thai users
     IC & IC &                     ▲31% YoY
      Equipment            1,418                          consolidation
equipment rental                   ▲28% QoQ
           rental                                                                   •   Paid Bt788mn to buy 1/3 JV stake with
                                                                                        Rabbit and LINE
                                                                                    •   Utilize each party’s strength in subscriber
                  Cost controlled resulted in profit expansion                          base, distribution channel, and brand

          EBITDA (Bt mn)                    NPAT (Bt mn)                                     Officially signed 2100MHz contract
               ▲9% YoY                      ▲4.5% YoY
               ▲2.4% QoQ                                   • Improved service       •   Agreements effective since 1-Mar
                                            ▲4.4% QoQ
      20,000                       10,000
                                                             revenue                      • Equipment rental agreement
                                    8,000
      15,000
                  18,905                                                                  • Roaming agreement
      10,000
                                    6,000     8,037        • Lower regulatory
       5,000
                                    4,000
                                                             fee, network OPEX,     •   Net financial impact remains relatively the
                                    2,000
          -                            -                     and controlled             same at a net cost of Bt3.9bn/year
                  1Q18                        1Q18           handset subsidies

                                                                                                                                      4
Investor Presentation - Advanced Info Service Plc. May 2018 Ticker: ADVANC (SET) - Advanced Info Services Public ...
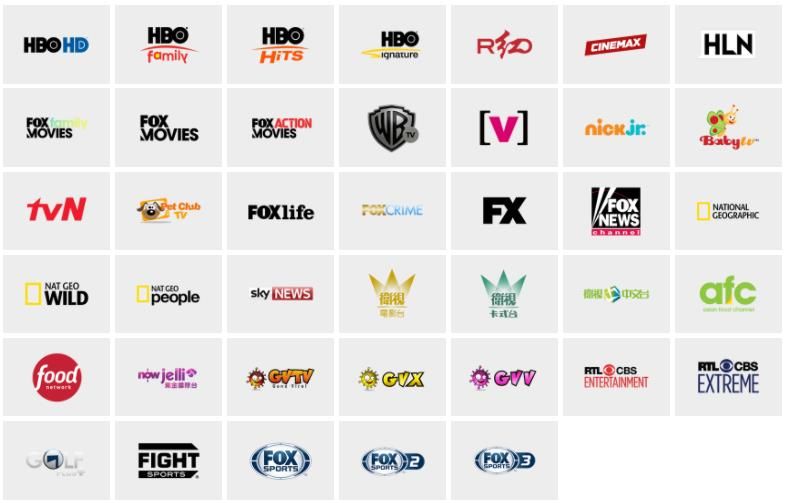
FY18 Guidance (maintained)

Item              FY18 Guidance
                                          • 2% of which comes from CSL
Service revenue                           • Increasing data usage on 4G and fixed broadband
                  +7-8% YoY                 subscriber base
(ex. IC)                                  • Moderate growth in enterprise business with synergy from
                                            CSL

                  Decline and make
Sale revenue                              • More targeted marketing campaigns
                  near-zero margin

EBITDA margin     45-47%                  • Improving revenue and continuing cost management

                                          • Strengthen 4G capacity to support mobile data growth
Cash CAPEX        Bt35-38bn                 using advanced technology
                                          • Expand fixed-broadband coverage and last miles

                  Minimum 70% payout of
Dividend policy                           • Preserve financial health and flexibility for future growth
                  NPAT

                                                                                                          5
Investor Presentation - Advanced Info Service Plc. May 2018 Ticker: ADVANC (SET) - Advanced Info Services Public ...
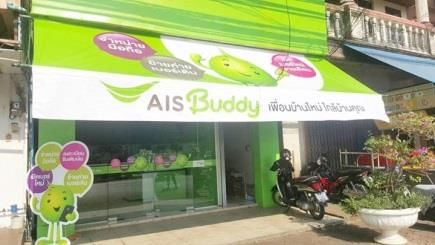
Mobile: Drive 4G users through valued offerings
              Business direction in 2018                                   4G adoption continued uptrend
 Key driver

                 • Increasing 4G penetration and                          4G handset penetration
                   data usage                                             3G handset penetration
                                                                           Mobile data revenue (% to mobile revenue)

                 • Continue to improve network and                       56%           53%                          50%       60%
                                                                                              49%            46%
                   brand perception                                                                                           50%
 Strategy

                                                                                       39%    42%
                                                                         35%                                 46%              40%
                 • Target uplifted offerings through                                                                 43%
                                                                                                                              30%
                   customer value management
                                                                                                                              20%
                   program                                               53%           55%    58%            59%    60%
                                                                                                                              10%
                 • Convergence of mobile, FBB, and                                                                            0%
                   video content targeting revenue per
                                                                         1Q17          2Q17   3Q17           4Q17   1Q18
                   household and brand value

                            Focus on postpaid and maintain competitiveness in prepaid

    • Postpaid segment grew                 Prepaid statistics in 1Q18   Postpaid statistics in 1Q18
      robustly following
      popularity of video             -5%
      streaming on mobile             YoY
                                                                                flat
                                                            -5%
                                              +14%          YoY +14%                                +61%            3.6%
    • Prepaid segment                          YoY               YoY      +2%                 +100%
                                                                                                     YoY
                                                                          YoY                  YoY                         1.4%
      softened due to
                                      32      7.6            17   13      184 578               7      9.2
      prepaid-to-postpaid
      conversion and                 Subscriber             Revenue         ARPU                 VOU                Churn rate
      competition                      (mn)                  (Bt bn)      (Bt/month)          (GB/month)             (/month)

                                                                                                                                    6
Investor Presentation - Advanced Info Service Plc. May 2018 Ticker: ADVANC (SET) - Advanced Info Services Public ...
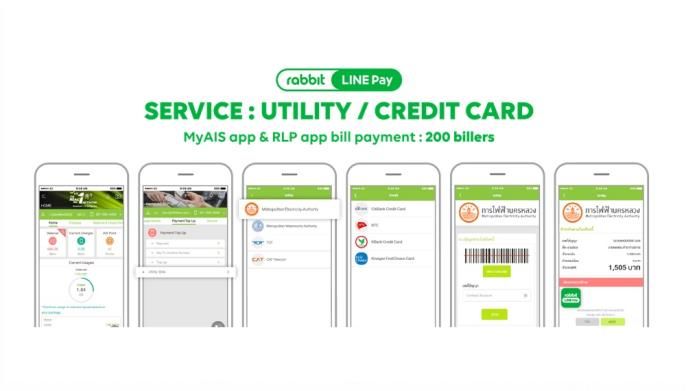
Mobile: Build end-to-end customer satisfaction

                               Reinforce OMNI channel and privilege
      End-to-end customer
      engagement

                               Increase brand perception in both online & teen segment
  Strong
  branding                                             Partner with CH3
                                                                                      Zeed SIM for
                                                       to co-market                   teenagers
                                                       “Love Destiny”

             Product           Focus on valued-product proposition
             differentiation
                                           Increase               Maintain level            Targeted
                                   FMC     revenue per            of profitable             offerings
                                           household              subsidies

  Great network                Ensure proper investment and strong spectrum position
  quality
                                    55     Low- and                           Advanced solutions
                                   MHz     high-band                          with pre-5G network
                                           spectrum                           planning

                                                                                                        7
Investor Presentation - Advanced Info Service Plc. May 2018 Ticker: ADVANC (SET) - Advanced Info Services Public ...
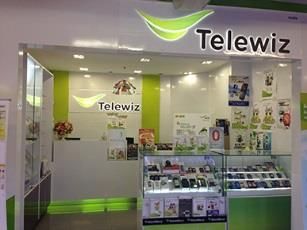
FBB: Industry expanding into fibre-to-the-home
             Thai fixed broadband market                     FBB subscriber market share                 Industry ARPU

38% market penetration with majority using xDSL               Total est.8.2mn users                    Maintained at around
                                                                                                          Bt600/month
               Broadband users (mn)
                                                                                              ARPU (Bt/month)
               % household peneration                              34%                                               637
                                                                                                                              635
                            34%            38%                                 21%
     26%         29%                                                    4Q17                                   600

                                                                                     6.4%                541
                                                                                                 510
                  6.2       7.2            8.2                         40%
      5.4
                                                                                                4Q16 1Q17 2Q17 3Q17 4Q17
      FY14       FY15       FY16           FY17

                                Competitive fibre pricing with higher speed at same price

ARPU (Bt/month)
  1000
              Current fibre plans
   800
                                                                               100Mbps packages are recently affordable
                                                                               at below Bt1,000
   600

   400
                                                                               Typical package for new fixed broadband
                                                                               customers remained at Bt600, targeting new
                                                                               and ADSL users
   200
         0       20        40         60          80   100       120
                        Download speed (Mbps)

                                                                                                                                    8
Investor Presentation - Advanced Info Service Plc. May 2018 Ticker: ADVANC (SET) - Advanced Info Services Public ...
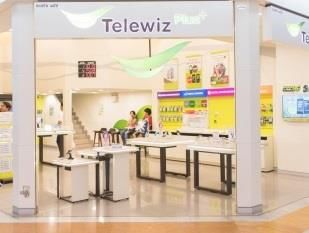
AIS Fibre continues to focus on quality customers
  with improved acquisition rate
       AIS Fibre performance

           FBB subscriber (‘000)                            FBB net additions (‘000)
                                                                                                               Focus on existing
           ARPU (Baht/month)
                                                                                                             50 cities, covering
                          637      635    618                                                                   6mn homepass
1,200             600                              650
1,000
           541
                                                  100
 800
                          482      521    572      550     72     72
 600      374     446                                                                      51
                                                   50                     36      40
 400                                               450
 200
   -                                               350
                                                   -                                                   Synergy with CSL in
          1Q17   2Q17    3Q17      4Q17   1Q18            1Q17   2Q17   3Q17    4Q17     1Q18                condo segment

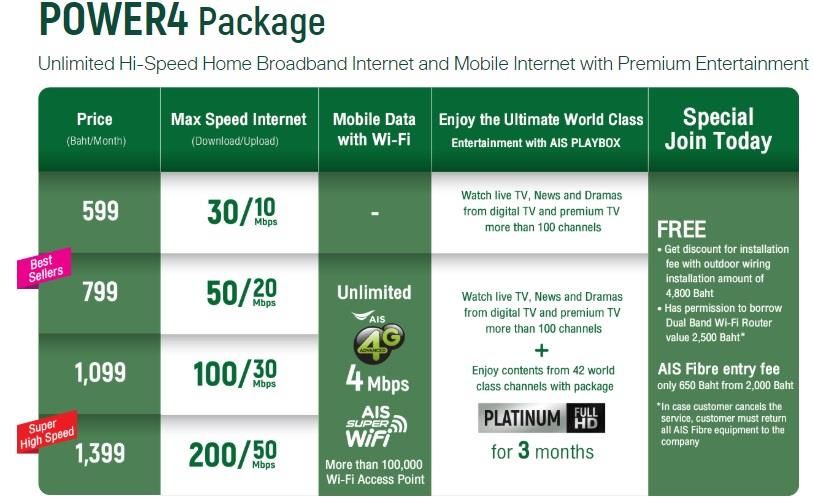
                                                                                       • Acquire quality subscribers through
                                                                                         convergence services of “Power4” and
                                                                                         “Family Extra” packages

Join AIS Fibre + up to 4 AIS mobile numbers, get extra privileges for a family

                 Free 2GB                                Free call
                 Mobile data                       to 1 AIS number                        Pure fixed
                                                                                          broadband            14%   Convergence
                                                 Get privileges for                                    86%
                                             Serenade Emerald
        HBO movies & series on mobile            and extra meals & movies
        + World class cartoons at home                   privileges                         AIS Fibre customers by segment
                                                                                                                                   9
Investor Presentation - Advanced Info Service Plc. May 2018 Ticker: ADVANC (SET) - Advanced Info Services Public ...
Digital services: add on variety of contents &
expand further into digital money segment
                  Digital contents                                      AIS Rabbit LINE-Pay
                 Digital contents
 2 new channels including CNN and Cartoon Network,
          available on AIS PLAY and PLAYBOX               •   On 5th March 2018 ,AIS, through mPAY, has
                                                              entered into 33.33% stake (Bt788mn) in a joint
                                                              venture with Rabbit LINE Pay, an e-Money
                                                              platform that connect with Bangkok Mass
                                                              Transits and is embedded in Line chat
                                                              application.

                                 on the go     at home    •   Strengthen AIS’ digital life service provider
                                                              position by leveraging customer bases,
         available on both AIS PLAY and AIS PLAYBOX           platform, channels of AIS and partners to
                                                              enhance mobile money for both AIS and non-
                                                              AIS customers
               Continued to add value and
      create differentiation through digital contents

         On top packages: Mao Mao Entertain

                                Free internet in
                           ViU, Hook, Karaoke apps

                                    Bt19/day
        Korean series
                                    512Kbps*
                             +           or
    Hollywood movies
                                    Bt34/day for
                                    UL 4Mbps                                                  +8.5mn users
                                                         +2.6mn users     +45mn users
              Karaoke
*FUP: speed drop to 64kbps after 300MB                                                                         10
Enterprise: CS LOXINFO Business Integration
                                                                      Enterprise revenue market share

                                                                   18%
              Bt56bn                                                                                 23%

        ICT & Mobile enterprise                                      5%
            market in 2017
                                                        Before M&A                       After M&A

                                              Strengthen position in
                                                 enterprise market

    Lower inter. bandwidth cost                    COST SYNERGY
                                                                                            Asset light models
       Own fiber infrastructure   ✓ Operate CSL’s services with lower OPEX

      Data center outside BKK                    REVENUE SYNERGY                            Data center in inner BKK
                                  ✓ Cross sell & upsell potential from larger customer
Large size corporate customers                                                              Mid-size corporate customers
                                    base and complementary product portfolio
 Sizable corporate mobile base    ✓ Widen Data Center propositions and target               Well-known brand with good
                                    segments                                                service quality

           Economies of scale                OPERATIONAL EFFICIENCY                         Strong and experienced sales
                                  ✓ Sales & Marketing alignment                             and technical support in ICT
                                  ✓ Leverage sale and technical expertise
                                  ✓ Align product roadmap

                                       Expected to realize synergy in 1-2 years
                                                                                                                  11
APPENDIX

           12
1Q18 Financial Highlights
                                                                                                               FY18
Bt mn                                                1Q17         4Q17          1Q18     %YoY      %QoQ
                                                                                                             Guidance
 Mobile revenue                                     30,226       31,016        31,172    ▲3.1%     ▲0.5%
 Fixed broadband revenue                              549          956         1,013     ▲85%      ▲6.0%
 Other revenues*                                      589          639          962      ▲63%      ▲51%
Service revenue ex. IC & equipment
                                                    31,364       32,611        33,147    ▲5.7%     ▲1.6%     +7-8% YoY
rental
 IC and equipment rental                             1,087        1,107        1,418     ▲31%      ▲28%
Service revenue                                     32,451       33,717        34,565    ▲6.5%     ▲2.5%
SIM and device sales                                 6,407        7,488        6,368     ▼0.6%     ▼15%       decline
Total revenue                                       38,858       41,205        40,933    ▲5.3%     ▼0.7%
 Cost of service                                   (16,256)      (17,018)     (17,281)   ▲6.3%     ▲1.5%
 SG&A                                               (5,439)       (6,338)      (6,336)   ▲17%      stable
EBITDA                                              17,347       18,454        18,905    ▲9.0%     ▲2.4%
EBIT                                                10,430        10,290       10,826    ▲3.8%     ▲5.2%
NPAT                                                7,693         7,701        8,037     ▲4.5%     ▲4.4%
Capex                                              (11,509)      (7,286)       (6,467)   ▼44%      ▼11%      Bt35-38bn
Sales margin                                        -6.7%         -0.6%        -1.1%     ▲560bps   ▼50bps    near-zero
EBITDA margin                                       44.6%         44.8%        46.2%     ▲160bps   ▲140bps    45-47%
EBIT margin                                         26.8%         25.0%        26.4%     ▼40bps    ▲140bps
NPAT margin                                         19.8%         18.7%        19.6%     ▼20bps    ▲90bps
*Other revenues include enterprise data services, including CSL and other revenues
                                                                                                                         13
Improved EBITDA from better revenue growth
and well-managed costs
1Q18 EBITDA (YoY)                                                                          (Bt mn)

                                                                                 +9.0% YoY
                2,115        (232)                    359      (868)
                                           340                         (156)      18,905
      17,347

     1Q17       Service   Service cost   Reg fee   Net sales   SG&A    Others       1Q18
               revenue

1Q18 EBITDA (QoQ)                                                                          (Bt mn)

                                                                                +2.4% QoQ
                    848     (192)                                21
                                         (174)       (23)              (29)       18,905
     18,454

     4Q17       Service   Service cost   Reg fee   Net sales   SG&A    Others      1Q18
               revenue

                                                                                                14
Net profit rose from strong EBTIDA despite 4G and
fixed broadband investment

                 EBITDA & margin                                       Net profit & margin

   EBITDA (Bt bn)
   EBITDA margin, excluding TOT equipment rental (%)
                                                          Net profit (Bt bn)          Net profit margin (%)

                              46.9%
         44.6%      44.8%
  24.0                                  45.0%
                                                       12.0    19.8%        18.7%         19.6%
  22.0                                                 11.0
                                        40.0%
  20.0               18.5       18.9                   10.0
          17.3                          35.0%           9.0
                                                                 7.7           7.7          8.0
  18.0                                 +9.0% YoY        8.0
                                         30.0%                                                    +4.5% YoY
  16.0                                 +2.4% QoQ        7.0
  14.0                                  25.0%           6.0                                       +4.4% QoQ
                                        20.0%           5.0
  12.0
                                                        4.0
  10.0                                  15.0%           3.0
          1Q17      4Q17       1Q18                            1Q17            4Q17        1Q18

 • 1Q18 EBITDA rose YoY and QoQ,                       1Q18 net profit grew YoY and QoQ from
   underpinned by decent revenue momentum              improved EBITDA despite increased D&A
   and ongoing cost optimization program.              from 4G investment.

 • Excluding impact from TOT equipment rental,
   EBITDA margin improved to 46.9% and
   aligned with the full year guidance of 45-47%.

                                                                                                              15
Maintained financial flexibility for future growth
                 1Q18 Balance Sheet                                                                        1Q18 Cash flow
(Bt bn)                                                                           (Bt bn)                                   Cash increase                           Cash decrease
                             others        A/P
                                                           spectrum license         Operating     Investing                       Financing                              Net cash
     spectrum                      21     34               payable                   18.1
       license
                  106                                 74

                        Assets          Liabilities                 goodwill
                                                            3                                                                                      9.3
                                                                                                   6.5
                                                 239                                                          4.2
                                   B/S
                       287                                                                                                                                                  2.2
                                   1Q18                               interest-             0.4                                  0.3                           0.4
                                                            101       bearing

                                                                                                   CAPEX
                                                                                       Income
                                                                                      tax paid

                                                                                                                                 Finance cost
                                                                                     cash flow

                                                                                                                                                                          decreased
                                                                                                                                                                               Cash
                                                                                     Operating

                                                                                                              acquisition
                                                                                                           JV & Business

                                                                                                                                                Repayment of

                                                                                                                                                               Others
                                                                                                                                                  borrowings
                                                                      debt
                 134                    Equity
                                          48
          PPE                                        27
                                               22          others
                              18          26
                          A/R         8
                                                    retained earnings
                                cash others                                         CAPEX continued to decline to Bt6.5bn or 19% to
                                                                                    service revenue after completing nationwide 4G at
                                                                                    end of 2016
             1.2X                                   2.1X
                                                                                    Operating cash flow remained strong to support
   Net debt to EBITDA                     Interest bearing debt
                                                to Equity                           future investment
                                                                                    Average finance costs = 3.2% p.a.
                                                                                    • Maintaining investment grade credit ratings
             0.5X                                    65%                              • Fitch: national rating AA+ (THA), outlook stable
          Current ratio                    Return on Equity                           • S&P: BBB+, outlook negative

                                                                                                                                                                                      16
Mobile: 40.1m subs with expanding postpaid segment
 Subscribers (mn)                          postpaid      prepaid      ARPU (Bt/sub/month)                     postpaid       prepaid     blended

         34.0         33.5          33.0          32.7         32.4   579               593             590            581         578

                                                                                  244             251            254        256              257
   6.7          7.0           7.2           7.4          7.6                181             182            182           183           184

 Net addition (‘000)                                                  VOU (GB/data sub/month)

  232           330          235                         227
                                           163
                                                                                                                                       7.6
                                                                      5.7         4.0 6.7               7.5 5.4 5.9 8.3 6.2 6.7 9.2 7.0
                                                                            3.5                   4.7
                                                           -233                             4.1
                                              -294
    -615         -504          -523
   1Q17         2Q17          3Q17          4Q17         1Q18           1Q17             2Q17             3Q17           4Q17          1Q18

• Mobile subscribers was at 40.1mn, a slight drop of                   • Blended ARPU improved Bt1 QoQ, reaching Bt257
  5.5k QoQ from lower prepaid users.                                     from larger postpaid mix.
• Postpaid subscribers grew 227k QoQ from bundled                      • Blended VOU increased to 7.6GB from increasing
  package offerings and migration from prepaid.                          4G adoption and popularity of video streaming.
• Prepaid subscribers decreased 233k QoQ due to
  migration to postpaid and market competition.

                                                                                                                                                   17
Mobile price plans: Target better ARPU and build
differentiation on postpaid
Unlimited data usage with capped-speed packages                   Full 4G speed packages
 • Offer unlimited data usage at different                        • Attract new data users and encourage higher ARPU
   speeds for diverse needs e.g. chat, social                       subscriptions through premium VDO contents e.g. AIS
   networks, music, HD video streaming                              PLAY, Premier package, HOOQ, and Netflix
 • Encourage customers to move from prepaid                       • 4G speed with FUP, reduced speed after reaching the data
   to postpaid subscription with worry-free plan                    usage limit
                                                                  • Serve high-end heavy data users with real unlimited max
                                                                    speed experience

  Buffet Net Plus                                                  4G MAX SPEED
                  4G/3G                                                                                FUP after     Call all
  Monthly                                Call within    Enjoy        Monthly            Total
                 Unlimited                                                            internet        reach data    networks    Enjoy Free
  Fee (Bt)                               AIS (mins)     Free         Fee (Bt)
                max speed at                                                                          usage limit    (mins)

                                     5 numbers                         299             1GB                            100
    299            1Mbps
                                        24 hr.         1 month                                                                   1 month
                                                                       399             3GB                            150
    450            2Mbps                                                                               128kbps
                                                                       499             7GB                            200
    550            4Mbps              Unlimited
                                     5am – 5pm                         599            10GB                            250
    600            6Mbps                               3 months
                                                                       799            15GB                            350        3 months
*AIS WIFI is included in all packages.
                                                                                                       384kbps
                                                                       999            20GB                            450
                                                                      1,099                                           650
                                                                      1,299         Unlimited                         850
                                                                                     at max                -
                                                                      1,499          speed                           1,200
                                                                                                                                 3 months
                                                                      1,899                                          2,000
                                                                  *AIS WIFI is included in all packages.
                                                                                                                                      18
Updated: May-18
Mobile market share by subscribers

  Total subscriber (mn)

                                                 92             96                              90             90
                   75            83                                             83
                                                 25%           25%
                                25%                                            23%             27%            30%
                25%                                                                                                           Operator 3
                                                 30%           29%                             27%
                                32%                                            31%                            25%
                31%                                                                                                           Operator 2

                                                 45%           46%             46%             46%            45%             AIS
                44%             43%

                2011           2012             2013          2014            2015
                                                                                      *        2016          2017

   Postpaid subscriber (mn)                                                   Prepaid subscriber (mn)

                                                                                                      81      83
                                                                                          74                            68          73     70
                                                                                68                            24%
                                                               20                                     24%
                                                                                          25%                                     25%
                                                       18                       25%                                     21%                29%
                                           14                 35%                                             29%
    7.4      9.1         11       13                  34%                                 32%
                                                                                                      30%
                                                                                                                        31%       27%
                                           33%                                  31%                                                        24%
                                 31%                         28%%
   23%                  29%                           29%
             29%                 31%       30%
             31%        32%                                                                           45%     47%       48%       48%      47%
   32%                                                        37%               44%       43%
                        39%      39%       38%        37%
   45%       41%

  2011      2012        2013    2014      2015        2016   2017              2011       2012       2013    2014      2015 * 2016         2017

* In 2015, sub base of the industry was affected by the adjustment of prepaid sub reporting to reflect only active ones. The decrease in sub base also
caused by NBTC’s announcement requiring prepaid sub to register their SIMs. The SIMs that failed to register by the deadline were terminated.
                                                                                                                                                 19
FBB: Competitive price plans with differentiation

                                  Bt599/month   Bt399/month   Bt299/month   Bt199/month

                                                                                20
Historical profitability and CAPEX trend

                 Industry    AIS
EBITDA margin

                   45%          42%           42%          44%         46%        40%         45%
                36%          32%           32%          33%         33%        32%         36%

                 2011          2012          2013        2014         2015      2016        2017

                 Industry    AIS
NPAT margin

                                 24%              24%      24%          25%          20%
                14%18%                                               14%                          19%
                              13%            9%         13%                     9%          8%

                  2011          2012          2013        2014         2015      2016        2017

                AIS’ CAPEX to service revenue ex. IC      AIS’ CAPEX (Bt bn)

                                                                                41%          32
                                              24%        28%          27%
CAPEX

                 6%             9%

                                                                                 48
                                                                                             41
                                10             28         33           32
                   6
                 2011          2012          2013        2014         2015      2016        2017

   Source: company data
                                                                                                        21
Debt payment and License payment schedule

Spectrum license payment schedule*                                       Debt repayment Schedule

   900x10MHz license payment (Bt bn)               Debenture (Bt bn)     Loan (Bt bn)
   1800x15MHz license payment (Bt bn)

                               59.6

    Total payment of
  Bt78bn toward 2020
                                                                 24.8

                                                                         13.9    13.3    14.2
        14.3                                      2.8     11.2
                                                                                          6.4    6.6           7.2    9.0
        4.0                                               3.4            12.1
                    4.0
        10.2                                              7.8                             7.8           0.0
                                                                          1.8
        2018        2019       2020               2018    2019   2020    2021    2022    2023    2024   2025   2026   2027

Note: 1800x15MHz license: the total payment is Bt40,986m for the use of 18 years, expiring in 2033
       900x10MHz license: the total payment is Bt75,654m for the use of 15 years, expiring in 2031

                                                                                                                             22
Distribution Channel
expanding touch points to +400k

     AIS Branded Shop                     Exclusive branded shop by                AIS Buddy
                                               partner (Telewiz)
      100+ shops                              450+ shops                      1,000+ shops

     Electronic Distribution Channels                             Modern Trade Outlets

         400k+ points                                                 10k+ shops

            (refill-on–mobile   Auto top-up
                  agent )         KIOSK

                                                                                               23
Digital content: More varieties and exclusivities

    Introduced new content packages to attract customers with different preferences e.g. sport,
          family, movies at more affordable prices on both AIS PLAY and AIS PLAYBOX.
                                                                       NEW              NEW
             Mobile

                             Ultimate        Ultimate           Movies and      Exclusive sport
                             entertainment   entertainment      series from     entertainment
                             + Unlimited     Bt299month         HBO             Bt199month
                             internet                           Bt199month
                             Bt499/month
   Fixed broadband
                                                       NEW             NEW              NEW

                             Ultimate         Ultimate          World class     Thrilling
                             entertainment    movies & series   cartoons        sports matches
                             in all forms     Bt399month        Bt299month      Bt199month
                             Bt599/month
                                                                                                  24
Contact us
IR website: http://investor.ais.co.th
Email:      investor@ais.co.th
Tel:        +662 029 5014

Disclaimers
Some statements made in this material are forward-looking statements with the relevant assumptions, which are subject to various risks and uncertainties. These include
statements with respect to our corporate plans, strategies and beliefs and other statements that are not historical facts. These statements can be identified by the use of
forward-looking terminology such as “may”, “will”, “expect”, “anticipate”, “intend”, “estimate”, “continue” “plan” or other similar words.
The statements are based on our management’s assumptions and beliefs in light of the information currently available to us. These assumptions involve risks and
uncertainties which may cause the actual results, performance or achievements to be materially different from any future results, performance or achievements
expressed or implied by such forward-looking statements. Please note that the company and executives/staff do not control and cannot guarantee the relevance,
timeliness, or accuracy of these statements.
You can also read