Feasibility of floating cage culture based on business scale in Riam Kanan Reservoir, South Kalimantan Province
←
→
Page content transcription
If your browser does not render page correctly, please read the page content below
Feasibility of floating cage culture based on
business scale in Riam Kanan Reservoir, South
Kalimantan Province
1
 Muhammad Nur, 2Muhammad A. Rifa’i, 2Rizmi Yunita, 2Leila A. Sofia
1
  Doctorate Program of Agricultural Science, Lambung Mangkurat University, Banjarbaru,
    South Kalimantan, Indonesia, 2 Faculty of Fisheries and Marine Science, Lambung
 Mangkurat University, Banjarbaru, South Kalimantan, Indonesia. Corresponding author:
                              M. Nur, nur@mhs.ulm.ac.id

       Abstract. Floating cage fish culture has highly developed in Riam Kanan Reservoir, South Kalimantan
       and gives positive contribution to the community social economic conditions. These culture activities
       experienced production decline in 2017 in relation with the environmental conditions and unoptimal
       management. Recently the production of floating cage fish culture has gradually been increasing even
       though it has not still reached the previous maximum production. The production decline can influence
       the feasibility of the floating cage fish culture business based upon different business scale due to
       dissimilar expenditures and revenue at each level. This study used field survey method through
       interviews with the fish farmers. Number of respondents was determined using disproportionate
       stratified random sampling method as many as 56 people consisting of 36 respondents of small-scaled
       business, 11 respondents of medium-scaled business, 9 respondents of large-scale business. The
       primary data were analyzed using descriptive analysis and business feasibility analysis. The business
       feasibility analysis components comprise fixed costs, variable costs, and revenue. Data collected are
       one-year data containing 1 to 3 culture cycles. Results showed that the floating cage fish culture
       business in Riam Kanan Resevoir was categorized as feasible at all levels of business scale with mean
       R/C ratio of 1.12. The highest feasibility was recorded in large-scale business, followed by the medium
       one, and the lowest in small-scaled business, 1.17, 1.12, and 1.11, respectively. Based on the cultured
       fish species, the feasibility of Nile tilapia culture is higher than carp culture business at all business
       scales, whereas carp culture is recommended for large and medium scale business only due to being
       potentially harmful.
       Key Words: fish production, interviews, R/C ratio, Nile tilapia, carp.

Introduction. With human population growth, food need has been increasing worldwide,
including fish. This can be seen from increased fish consumption from 130 million tons in
2011 to 151.2 million tons in 2016 (FAO 2018). During this period, fisheries production
from fishing has been stagnant and even tends to decline, while fish production from
aquaculture rises averagely 5.9% year-1 (FAO 2018), so that aquaculture becomes one of
the alternatives to meet the food need.
        Indonesia is one of the world major fish producers from aquaculture. FAO
recorded that Indonesia is on the third rank of aquaculture-based fish-producing
countries after China and India (FAO 2017). The cultured fish production of Indonesia
reached 16.1 tons in 2017 (MMAF 2018), that is total fish production from fish culture in
fish ponds, running water system, mix culture of fish-padi, seaweed, pen system, set fish
cage, and floating fish cages (MMAF 2017).
        In line with aquaculture development in Indonesia, floating fish cage aquaculture
has also been developing fast in South Kalimantan Province, one of which occurs in Riam
Kanan Reservoir. This culture system has existed in Riam Reservoir since 1994 and
highly developed since 2006 (Nadiyah 2010). Floating fish cage aquaculture has
positively contributed to social economic conditions through the availability of job
opportunity for local communities (Statistic Center of Banjar Regency 2016; Soendjoto et
al 2009). The development of floating fish cage aquaculture in this area can appear from

AACL Bioflux, 2020, Volume 13, Issue 5.
http://www.bioflux.com.ro/aacl
                                                     2868
fish production development in Aranio district from 320 tons in 2006 to 10,831 tons in
2016 (Statistic Center of Banjar Regency 2007, 2017). The fish production from this
culture system has declined since 2017 with only 1,058 tons (Statistic Center of Banjar
Regency 2018). Although the fish production was gradually increasing in 2018, it could
not reach the previous maximum production. Aranio district could only reach 4,699 tons
in 2018 (Statistic Center of Banjar Regency 2019a). Fish production decline in Riam
Kanan Reservoir is believed due to high mortality from water quality degradation and
poor seed conditions (Muhamat & Hidayaturrahmah 2017). Declined fish production can
also impact on the feasibility of the floating fish cage culture business.
Several previous studies mention that floating fish cage aquaculture is
economically feasibly done as in Limboto Lake, Gorontalo (Zakaria et al 2017), Tondano
Lake, North Sulawesi (Pangemanan et al 2014), Batur Lake, Bali (Budiasa et al 2018),
Maninjau Lake, West Sumatera (Putri et al 2020), Koto Panjang Reservoir, Riau
(Wahyudy et al 2019), Melawi River, West Kalimantan (Mulyadi et al 2015), and Cirata
Reservoir, West Java (Rahmani et al 2011). These references indicate that the floating
fish cage aquaculture belongs to feasible business category, but declined fish production
in Riam Kanan Reservoir is believed to be able to affect the feasibility, especially at
different business scales, due to difference in production costs and revenue at each
business level. This study was aimed at analyzing the feasibility of floating fish cage
aquaculture in Riam Kanan Reservoir based on business scale levels.
Method
Research period and place. This study was conducted for 3 months, from October to
December, 2019, in Riam Kanan Reservoir, Aranio District, Banjar Regency, South
Kalimantan. The reservoir is located in Barito watershed with an area of 1,043 km2, built
in 1963 and officially used in 1973. It has an elevation of 52-60 m above sea level, water
surface of 3,200 ha, water volume of 1,200 million m3, and water debt of 340 m3 sec-1
(RDBPW 1995).
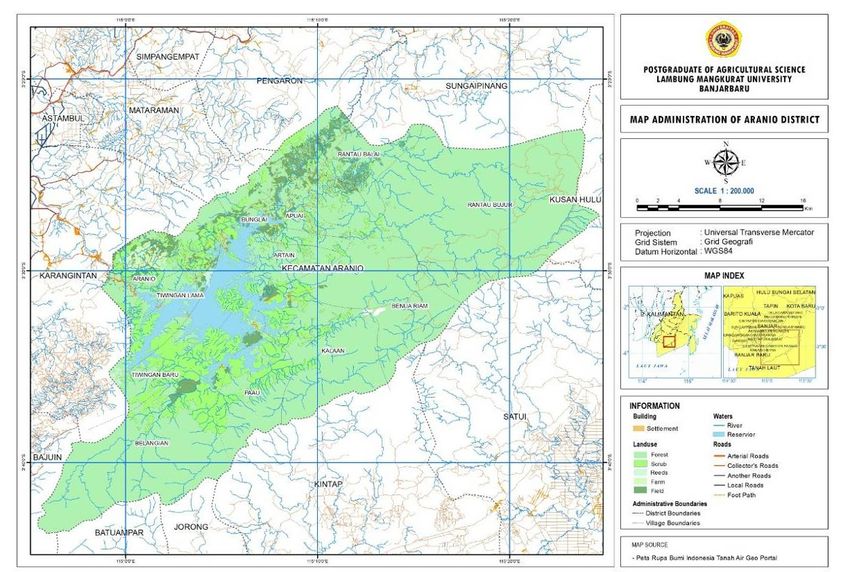
Riam Kanan Reservoir administratively belongs to Aranio District, Banjar Regency
(Figure 1), that is the widest area in Banjar Regency, 1,166.35 km2, covering 12 villages,
namely Aranio, Tiwingan Lama, Tiwingan Baru, Belangian, Paau, Kalaan, Artain, Benua
Riam, Bunglai, Apuai, Rantau Bujur, and Rantau Balai (Statistic Center of Banjar Regency
2019a). Most regions of this district are located in the forests, either national forests or
public forests (Statistic Center of Banjar Regency 2019b).
Data collection. The study used field survey method through interviews in the form of
semi-closed questioners. Respondents were taken from fisheries households who ran the
floating fish cage culture activity in Riam Kanan Reservoir. Number of respondents was
determined as many as 56 people using disproportionate stratified random sampling
method, consisting of 36 small-scaled fish farmers, 11 medium-scaled fish farmers, and
9 large-scaled ones. The determination of business scale criteria referred to the
regulation of the Indonesia Ministry of Marine Affair and Fisheries numbered 5/2009
(MMAF 2009), in which < 2 units are categorized as micro-scaled business, 2-10 units as
small-scaled business, 11-20 units as medium-scaled business, > 20 units as large-
scaled one. The respondents are distributed in 6 villages, Apuai, Bunglai, Benua Riam,
Kalaan, Tiwingan Baru, and Tiwingan Lama (Table 1).
AACL Bioflux, 2020, Volume 13, Issue 5.
http://www.bioflux.com.ro/aacl
2869Figure 1. Aranio District map.
Table 1
Distribution of floating cage fish farmer respondents
Business scale levels (respondents)
Villages Total respondents
Small Medium Large
Apuai 9 2 - 11
Bunglai 5 3 2 10
Benua Riam 3 - 2 5
Kalaan 5 2 1 8
Tiwingan Baru 5 1 2 8
Tiwingan Lama 9 3 2 14
36 11 9 56
Data analyses. The primary data were descriptively analyzed, whereas business
feasibility analysis applied income analysis and revenue/cost (R/C) ratio following
Suratiyah (2015):
I = TR – TC
R/C ratio = TR/TC
where: I = income;
TR = total revenue (production x price);
TC = total costs (fixed costs + variable costs);
in which:
Income criteria: > 0 - profitable; = 0 – break event point; < 0 - unprofitable;
R/C ratio criteria: > 1 – profitable; = 1 – break event point; < 1 – unprofitable.
Several previous studies on economic feasibility have used R/C ratio analysis
(Olaoye et al 2013; Djumanto et al 2016; Jia et al 2016; Hasnidar 2017; Phiri & Yuan
2018; Ariadi et al 2019; Basuki et al 2019; Cahyono et al 2019; Pancawati 2019).
The components utilized for the feasibility of the floating fish cage culture business
are fixed costs, variable costs, and revenue. The fixed costs cover the investment assets,
such as fish cages, control house, and boat, while the variable costs consist of seeds,
AACL Bioflux, 2020, Volume 13, Issue 5.
http://www.bioflux.com.ro/aacl
2870feed, labors, and others (drugs, other production facilities, and harvest costs). Revenue
was obtained from the multiplication of total production and selling price. Cost and
revenue components calculated for feasibility analysis were those of 1-3 culture cycles.
Results. Respondents had age range of 19-66 years. Twenty-six respondents ran Nile
tilapia (Oreochromis niloticus) culture, one did carp (Cyprinus carpio) culture, and 29
others did both (Table 2). Number of floating fish cages were 997 plots, 843 plots for
tilapia culture and 154 plots for carp culture (Table 3).
Table 2
Number of respondents based on business scale and cultured fish species (person)
Species of fish
Business scale levels Totals
Nile tilapia Carp Nile tilapia & Carp
Small 21 1 14 36
Medium 4 - 7 11
Large 1 - 8 9
All 26 1 29 56
Table 3
Number of floating fish cages based on business scale and cultured fish species (plot)
Species of fish
Business scale levels Totals
Nile tilapia Carp
Small 175 21 196
Medium 143 12 155
Large 525 121 646
All 843 154 997
Mean production respondent-1 yr-1 was 11,447 kg for small scale culture, 24.716 kg for
medium scale, and 172,527 kg for large scale one, respectively. The highest mean
production plot-1 was recorded in large scale culture, 2,644 kg and the lowest in the
medium scale, 1,702 kg. The production plot-1 with species revealed that carp
production was higher than that of nile tilapia, 2,313 kg and 2,086 kg, respectively
(Table 4).
Table 4
Production of floating fish cage culture
Business scale level
Production All
Small Medium Large
-1
Total production per respondent (kg yr ) 11.447 24.716 172.527 39.941
Total production per plot (kg yr-1) 2.129 1.702 2.644 2.128
Nile tilapia production per plot (kg yr-1) 2.136 1.702 2.364 2.086
Carp production per plot (kg yr-1) 1.965 1.589 3.598 2.313
The selling price of Nile tilapia was higher than that of carp. The former had selling price
of IDR 27,400 kg-1 and the later had selling price of IDR 23,800 kg-1 (Table 5). Similar or
higher selling price of carp than tilapia occurred only in spawner size, IDR 32,500 kg-1.
Table 5
Selling price of nile tilapia and common carp (IDR 1.000 kg-1)
Nile tilapia Carp
Description
Small Medium Large All Small Medium Large All
Average 27.4 26.9 27.6 27.4 23.4 23.7 24.8 23.8
Minimum 24.0 25.0 25.0 24.0 22.0 22.0 23.0 22.0
Maximum 31.0 28.0 31.5 31.5 25.0 25.0 32.5 32.5
AACL Bioflux, 2020, Volume 13, Issue 5.
http://www.bioflux.com.ro/aacl
2871Cost-benefit analysis showed that mean investment was IDR 54,600,000 for
small scale culture, IDR 121,600,000 for medium scale culture, and IDR 541,500,000 for
large scale one, with total costs of IDR 273,300,000 yr-1, IDR 573,300,000 yr-1, and IDR
4,050,300,000 yr-1 and the revenue of IDR 310,100,000 yr-1, IDR 655,300,000 yr-1, and
IDR 4,861,800,000 yr-1 respectively (Table 6). The investment per plot ranged from IDR
8,500,000 to IDR 10,300,000, in which the highest was in the small-scaled culture and
the lowest in the medium-scaled culture. Total costs per plot ranged from IDR
39,800,000 yr-1 to IDR 62,300,000 yr-1 with the average cost of IDR 23,560 kg-1 to IDR
24,310 kg-1 (Table 8). The highest total cost per plot was found in the large-scaled
culture and the lowest in the medium-scaled culture, whereas the highest average cost
occurred in small-scaled culture and the lowest in the large-scaled culture. The revenue
plot-1 yr-1 ranged from IDR 45,200,000 to IDR 73,700,000 with average revenue of IDR
26,670 kg-1 to IDR 27,520 kg-1. The highest revenue plot-1 yr-1 and average revenue were
recorded in the large-scaled culture and the lowest in the medium-scaled one.
Table 6
Total cost and revenue per respondent and per culture plot at small, medium, large
business scales (IDR 1.000.000 year-1)
Per respondent Per plot
Component
Small Medium Large All Small Medium Large All
Investment costs 54.6 121.6 541.5 146.0 10.3 8.5 8.6 9.7
Fixed costs 5.9 14.3 52.0 15.0 1.1 1.0 0.9 1.1
Variable costs 267.4 559.0 3.998.2 924.3 49.6 38.8 61.4 49.4
- seed 32.1 66.5 388.6 96.1 6.0 4.6 6.1 5.7
- feed 200.2 418.5 2.920.8 680.3 37.2 29.2 45.7 37.0
- labour 28.6 64.3 575.8 123.5 5.3 4.3 8.2 5.6
- other 6.5 9.7 113.1 24.3 1.2 0,7 1.3 1.1
Total costs 273.3 573.3 4.050.3 939.2 50.8 39.8 62.3 50.4
Total revenue 310.1 655.3 4.861.8 1.109.4 57.5 45.2 73.7 57.7
Income 36.8 82.0 811.6 170.2 6.8 5.7 11.5 7.3
Cost-benefit analysis based on fish species indicated that total cost per plot in Nile fish
culture ranged from IDR 40,000,000 to IDR 56,000,000 with average cost of IDR 23,760-
24,500 kg-1, whereas total cost per plot in carp culture ranged from IDR 34,300,000 to
IDR 81,400,000 with average cost of IDR 22,220-23,500 kg-1 (Table 7 and Table 8). The
highest total cost per plot in Nile tilapia and carp culture was recorded in the large-scale
culture and the lowest in medium-scaled culture, while the highest average cost was
found in the small-scaled culture and the lowest in the large-scaled culture. The revenue
per plot in Nile tilapia culture ranged from IDR 45,600,000 to IDR 65,500,000 with
average revenue of IDR 26,910-IDR 27,610 kg-1. In carp culture, the revenue per plot
ranged from IDR 37,100,000 to IDR 95,600,000 with average revenue of IDR 23,400-
IDR 24,750 kg-1. The highest revenue per plot for Nile tilapia and carp culture occurred in
the large-scaled culture and the lowest in the medium-scaled one, whereas the highest
average revenue was recorded in the large scaled culture and the lowest in the medium-
scaled one for Nile tilapia and in small-scaled culture for carp.
Income per respondent in small, medium, and large-scaled culture is presented in
Table 6, IDR 36,800 yr-1, IDR 82,000,000 yr-1, and IDR 811,600,000 yr-1, respectively.
The income per plot and average income revealed that the large-scaled culture gave the
highest income at all business levels, IDR 11,500,000 plot-1 yr-1 and average income of
IDR 3,960 kg-1. The lowest income per plot occurred in the medium-scaled culture, IDR
5,700,000 and the lowest average income in the small-scaled culture, IDR 2,650.kg-1
(Table 8).
The income per culture plot and average income with fish species indicated that
Nile tilapia culture gave higher income than carp culture. The income per culture plot of
Nile tilapia was IDR 7,400,000.yr-1 with average income of IDR 3,070.kg-1, whereas the
income culture plot of carp was IDR 5,300,000.yr-1 with average income of IDR 870.kg-1
AACL Bioflux, 2020, Volume 13, Issue 5.
http://www.bioflux.com.ro/aacl
2872(Table 7 and Table 8). Based on the income per plot and average income at all business
levels, the highest profit of Nile tilapia and carp culture was found in large-scaled
business and the lowest in medium-scaled Nile tilapia culture and small-scaled carp
culture.
Table 7
Total cost and revenue based on fish species per floating fish cage plot in small,
medium, and large scaled culture (IDR 1.000.000 year-1)
Nile tilapia Carp
Description
Small Medium Large All Small Medium Large All
Fixed costs 1.1 1.0 0.9 1.1 1.1 1.0 0.9 1.0
Variable costs 50.2 39.0 55.1 48.7 43.4 33.2 80.5 50.9
- seeds 5.9 4.6 6.3 5.7 6.3 3.8 5.5 5.5
- feed 37.4 29.2 40.5 36.3 33.8 26.2 63.7 40.0
- labour 5.6 4.6 7.0 5.6 2.1 2.6 10.1 4.4
- other 1.2 0.7 1.3 1.1 1.1 0.6 1.3 1.1
Total costs 51.3 40.0 56.0 49.8 44.4 34.3 81.4 51.9
Total revenue 58.6 45.6 65.5 57.1 46.2 37.1 95.6 57.2
Income 7.3 5.7 9.6 7.4 1.8 2.9 14.2 5.3
Table 8
Average cost, revenue, and profit of floating fish cage culture (IDR 1,000 kg-1)
Business scale level
Species culture
Small Medium Large All
Nile tilapia & carp Average cost 24.31 23.93 23.56 24.12
Average revenue 26.96 26.67 27.52 26.99
Average income 2.65 2.74 3.96 2.88
Nile tilapia Average cost 24.50 24.03 23.76 24.29
Average revenue 27.43 26.91 27.61 27.35
Average income 2.93 2.88 3.85 3.07
Carp Average cost 23.50 22.69 22.22 22.97
Average revenue 23.40 23.71 24.75 23.83
Average income -0.10 1.02 2.53 0.87
Mean R/C ratio of the floating fish cage culture of all respondents was 1.12, the highest
in the large-scaled culture, 1.17, and the lowest in the small-scaled one, 1.11. Based on
the cultured fish species, it was found that mean R/C ratio of Nile tilapia was higher than
that of carp, 1.13 and 1.05, respectively, whereas based on the business scale, the large-
scaled culture had the highest business feasibility, followed by the medium-scaled culture
business, and small-scaled one (Table 9).
Table 9
R/C ratio of floating fish cage culture
Species culture Small Medium Large All
Nile tilapia & carp Mean 1.11 1.12 1.17 1.12
Minimum 0.91 1.01 1.05 0.91
Maximum 1.31 1.28 1.28 1.31
Nile tilapia Average 1.12 1.12 1.17 1.13
Minimum 0.94 1.02 1.03 0.94
Maximum 1.33 1.29 1.24 1.33
Carp Mean 1.01 1.05 1.11 1.05
Minimum 0.78 0.91 1.00 0.78
Maximum 1.14 1.21 1.33 1.33
AACL Bioflux, 2020, Volume 13, Issue 5.
http://www.bioflux.com.ro/aacl
2873R/C ratio analysis shows that all levels of culture business scale belong to feasible
category, even though there are several respondents having unfeasible business in small-
scaled-culture with R/C ratio < 1. Figure 2 demonstrates that 54 of 56 respodents or
96.43% have feasible culture business criteria.
Figure 2. Number of respondents based on business feasibility criteria.
Discussion. Present study shows that the feasibility of floating fish cage culture business
in Riam Kanan Reservoir is categorized as feasible at all levels of business scales with the
highest in the large-scaled culture, followed by the medium-scaled culture, and then
small-scaled one. This finding supports the previous studies on the same culture business
(Rahmani et al 2011; Pangemanan et al 2014; Mulyadi et al 2015; Zakaria et al 2017;
Budiasa et al 2018; Wahyudy et al 2019).
The feasibility of Nile tilapia culture is better than that of carp culture. Nile tilapia
is feasibly run at all business levels, while carp culture is recommended only in large-
scaled and medium-scaled levels. Carp culture business approaches to Break Event Point
in small-scaled culture and it is potentially unprofitable.
Factors affecting the different feasibility were cost efficiency, productability, and
fish selling price. The cost efficiency could be seen from mean costs, the cost per unit of
produced goods. The lower the costs are, the more efficient the production cost will be.
Large-scaled culture was the most efficient business scale level with an average cost of
IDR 23,560 kg-1, whereas the others had the cost range of IDR 23,930 to 24.310 kg-1.
The cost efficiency in the large-scaled culture is supported by low fixed costs and efficient
cost for the expenditures of fish seed and feed, so that these could reduce the whole
costs.
Productability can be seen from the ability to produce a number of fish plot-1 yr-1.
The higher the production plot-1, the higher the revenue gained. The large-scaled culture
has a fish productability of 2,644 kg plot-1 yr-1, while other culture scales have
productability of 1,702 to 2,129 kg plot-1 yr-1 meaning that the large-scaled culture has
the highest productability. Chumnanka et al (2014) claimed that the survival rate of the
cultured fish are positively correlated with fish production. In the present study, the
highest survival rate was found in the large-scaled culture, 27.41% for Nile tilapia and
61.13% for carp. Other culture scales had lower survival rate, 21.55 to 21.70% for Nile
tilapia and 48.76 to 55.54% for carp.
Selling price is one of the factors influencing the amount of revenue (Faiq et al
2012; Fauziah et al 2016). The higher the selling price is, the higher the revenue will be.
The present study revealed that the selling price of Nile tilapia was generally higher than
that of carp with mean IDR 27,400 kg-1 for Nile tilapia and IDR 23,800 kg-1 for carp,
respectively. The selling price difference between both species is related with the
preference of people in South Kalimantan. They like the Nile tilapia more, because, unlike
carp, Nile tilapia has no fine spine in the body that could be stuck in the throat.
Several factors affecting the feasibility of fish culture business were production
capacity, selling price, target species, feed conversion ratio (FCR), fixed cost, and
variable costs (Arikani & Aral 2019; Islam et al 2017; Jia et al 2016; Kee 1988).
Febrianty et al (2018) mentioned that business feasibility is also influenced by
investment ability and management, while Sofia and Nurlianti (2019) stated that it is
AACL Bioflux, 2020, Volume 13, Issue 5.
http://www.bioflux.com.ro/aacl
2874affected by capital efficiency and operational costs. Target species influences the selling
price-related business feasibility (Jia et al 2016). Besides selling price, target species is
also related with the suitability of culture locality. In suitable environment, target species
will grow optimally (Rifa’i 2016).
Conclusions. Floating fish cage culture in Riam Kanan Reservoir was categorized as
feasible business at all levels of business scale with mean of R/C ratio of 1.12. The
highest feasibility was recorded in the large-scaled business, followed by the medium
scale, and the lowest in small-scaled business. Based on the cultured fish species, Nile
tilapia was better fish species for the floating fish cage cultivation than carp at all
business scale levels, whereas the carp culture approached to the break even point at the
small scale business. Factor affecting the business feasibility is cost efficiency, production
capability per plot, and fish selling price. Thus, Nile tilapia could be recommended for
cultured species, but carp culture is recomended only at large-scaled and medium-scaled
businesses, while the small scale is potentially unprofitable.
Acknowledgements. We would like to thank the Government of South Kalimantan
Province for the research grant. Our gratitute is also addressed to the Head of Fisheries
Services of Banjar regency for providing the fisheries data and Mrs. Noorain and Mr.
Muhammad Alfiani Noor who gave field mentoring.
References
Ariadi H., Fadjar M., Mahmudi M., 2019 Financial feasibility analysis of Vannamei shrimp
(Litopenaeus vannamei) culture in intensive aquaculture system with low salinity.
Journal of Economic and Social of Fisheries and Marine 07(1):81-94.
Arikani M. S., Aral Y., 2019 Economic analysis of aquaculture enterprises and
determination of factors affecting sustainability of the sector in Turkey. Veteriner
Fakültesi Dergisi 66:59-66.
Basuki F., Harwanto D., Yuniarti T., Susilowati T., 2019 Return cost ratio analysis on seed
production N1 (Nursery 1) of Sangkuriang catfish variety (Clarias gariepinus
Burchell) with different stocking density of eggs using filtration system. IOP
Conference Series: Earth and Environmental Science 246(1):1-6.
Budiasa I. W., Santosa I. G. N., Agung I. G., Ambarawati A. Y. U., Suada K., Sunarta I.
N., Shchegolkova N., 2018 Feasibility study and carrying capacity of Lake Batur
ecosystem to preserve tilapia fish farming in Bali, Indonesia. Biodiversitas
19(2):613-620.
Cahyono R. T., Suryantini A., Mulyo J. H., 2019 The feasibility of developing catfish
hatcheries as a business in Minapolitan area of Magelang District. Jurnal Teknosains
8(2):122-134.
Chumnanka N., Boyd C. E., Viriyatum R., Suriyan T., 2014 Bottom soil characteristics,
survival and production of shrimp in low-salinity, inland ponds in Alabama and
Florida (USA). Journal of Soils and Sediments 15:671-682.
Djumanto, Ustadi, Rustadi, Triyatmo B., 2016 Feasibility study on the profitability of
vannamei shrimp aquaculture on coastal area of Keburuhan Village, Purworejo
Regency. Aquacultura Indonesiana 17(1):7-11.
Faiq H., Hastuti D., Sasongko L. A., 2012 [Income analysis of milkfish culture in
Tugurejo Village, Tugu District, Semarang]. Jurnal Ilmu-Ilmu Pertanian MEDIAGRO
8(1):72-85. [in Indonesian]
FAO, 2017 Fishery and aquaculture statistics. Yearbook 2017. Food and Agriculture
Organization of the United Nations, Rome, Italy, 109 pp.
FAO, 2018 The state of world fisheries and aquaculture 2018. Food and Agriculture
Organization of the United Nations, Rome, Italy, 26 pp.
Fauziah A. F., Agustina T., Hariyati Y., 2016 [Income analysis and marketing of African
sharptooth catfish in Mojomulyo Village, Puger District]. JSEP 9(1):20-32. [in
Indonesian]
AACL Bioflux, 2020, Volume 13, Issue 5.
http://www.bioflux.com.ro/aacl
2875Febrianty I., Mahreda E. S., Bachri A., Fatmawati, 2018 The economies of scale of catfish
pond culture in Banjar Regency, South Kalimantan. Journal of Biodiversity and
Environmental Sciences 13(4):101-108.
Hasnidar, 2017 [Feasibility analysis of ornamental fish business in Gampong Paya Cut,
Peusangan District, Bireuen Regency]. Jurnal Sosial Ekonomi Pertanian 1(2):97-105.
Islam Md. S., Rahman Md. S., Akter F., Moniruzzaman M., 2017 Cost benefit analysis of
aquaculture in Northern Part of Bangladesh. International Journal of Applied
Research 3(2):105-107.
Jia B., St-Hilaire S., Singh K., Gardner I. A., 2016 Farm-level returns and costs of yellow
catfish (Pelteobagrus fulvidraco) aquaculture in Guangdong and Zhejiang Provinces,
China. Aquaculture Reports 4:48-56.
Kee C. C., 1988 Economic and social consideration for aquaculture site selection : an
Asian perspective. UN/FAO Workshop on the Geographical Information System
(GIS), Application in Aquaculture from 5-23 December, 1988 at the Asian Institute
of Technology, Bangkok, Thailand, 17 pp.
Ministry of Marine Affairs and Fisheries (MMAF), 2009 [Regulations of the Ministry of
Marine Affairs and Fisheries of Indonesia Republic numbered PER.05/MEN/2009
concerning business scale in fish culture]. 17 pp. [ in Indonesian]
Ministry of Marine Affair and Fisheries (MMAF), 2017 [Time series of aquaculture fisheries
2014-2017]. Data, Statistic, and Information Center. Available at:
http://sidatik.kkp.go.id/publikasi/index/18. Accessed: July, 2020. [in Indonesian]
Ministry of Marine Affair and Fisheries (MMAF), 2018 [Fisheries and marine production
data of 2017]. Data, Statistic, and Information Center. Jakarta, 322 pp. [in
Indonesian]
Muhamat, Hidayaturrahmah, 2017 [Nile tilapia mortality in floating fish cage culture in
Aranio village and Tiwingan Lama, Banjar regency, South Kalimantan]. Proseding
Seminar Masyarakat Biodiversity Indonesia 3:28-32. [in Indonesian]
Mulyadi M. Y., Isytar I., Dolorosa E., 2015 [Financial analysis of fish culture in the
floating fish cage in Melawi River, North Pinoh District, Melawi Regency]. Jurnal
Social Economic of Agriculture 4:37-45. [in Indonesian]
Nadiyah, 2010 [The use of Riam Kanan reservoir for community-based fish culture]. MSc
Thesis, Pascasarjana Program Studi Magister Ilmu Lingkungan, Universitas
Padjadjaran Bandung, 121 pp. [in Indonesian]
Olaoye O. J., Ashley-Dejo S. S., Fakoya E. O., Ikeweinwe N. B., Alegbeleye W. O.,
Ashaolu F. O., Adelaja O. A., 2013 Assessment of socio-economic analysis of fish
farming in Oyo State, Nigeria. Global Journal of Science Frontier Research
Agriculture and Veterinary 13(9):45-53.
Pancawati J., 2019 The potential development of fish farming in Lake Cipondoh. Jurnal
Penelitian Agrosamudra 6(2):16-25.
Pangemanan J. F., Harahap N., Soemarno, Polii B., 2014 Ecological-economic analysis of
floating fish cage-aquaculture business in Tondano Lake, Minahasa Regency, North
Sulawesi Province. Scholars Journal of Agriculture and Veterinary Sciences
1(4B):269-273.
Phiri F., Yuan X., 2018 Economic profitability of tilapia production in Malawi and China.
Journal of Aquaculture Research and Development 9(5):1-6.
Putri D. Z., Idris, Anis A., Adry M. R., Sari Y. P., Yeni I., 2020 The potency of fish
cultivation’s development in Agam Regency of West Sumatera. 4th Padang
International Conference on Education, Economics, Business and Accounting
(PICEEBA-2 2019) 124:324-329.
Rahmani U., Syaukat Y., Fauzi A., Hidayat A., 2011 [Internalization of environmental
costs in the floating fish cage culture in Cirata Reservoir]. Indonesian Journal of
Agricultural Economics (IJAE) 2(2):157-168. [in Indonesian]
Research and Development Board of Public Works (RDBPW), 1995 Large reservoir in
Indonesia. Badan Penerbitan PU, Jakarta, 374 pp.
Rifa’i M. A., 2016 The abundance and size of giant sea anemones at different depths in
the waters of Teluk Tamiang village, South Kalimantan, Indonesia. AACL Bioflux
9(3):704-712.
AACL Bioflux, 2020, Volume 13, Issue 5.
http://www.bioflux.com.ro/aacl
2876Soendjoto M. A., Suyanto, Nuryadin M. R., 2009 [Economic value of Hutan Raya Sultan
Adam Park, South Kalimantan based on fisheries]. In: Seminar Nasional Perikanan
Indonesia, 3-4 December 2009, Sekolah Tinggi Perikanan, pp. 481-486. [in
Indonesian]
Sofia L. A., Nurlianti S., 2019 The economic value of the resource utilization of wetlands :
comparative study of Beje Fisheries in North Hulu Sungai Regency, South
Kalimantan. AACL Bioflux 12(1):143-150.
Statistic Center of Banjar Regency (SCBR), 2007 Banjar regency in figure 2006/2007.
BPS Kabupaten Banjar, Martapura, 386 pp.
Statistic Center of Banjar Regency (SCBR), 2016 Banjar regency in figure 2016. BPS
Kabupaten Banjar, Martapura, 442 pp.
Statistic Center of Banjar Regency (SCBR), 2017 Banjar regency in figure 2017. BPS
Kabupaten Banjar, Martapura, 355 pp.
Statistic Center of Banjar Regency (SCBR), 2018 Banjar regency in figure 2018. BPS
Kabupaten Banjar, Martapura, 430 pp.
Statistic Center of Banjar Regency (SCBR), 2019a Banjar regency in figure 2019. BPS
Kabupaten Banjar, Martapura, 410 pp.
Statistic Center of Banjar Regency (SCBR), 2019b [Aranio district in figure 2019]. BPS
Kabupaten Banjar, Martapura, 101 pp. [in Indonesian]
Suratiyah K., 2015 [Agriculture science]. Penebar Swadaya, Jakarta, 156 pp. [in
Indonesian]
Wahyudy H. A., Bahri S., Tibrani, 2019 [Optimation of freshwater fish culture in the
floating fish cage in the reservoir of PLTA Koto Panjang, Kampar Regency, Riau
Province]. Jurnal Agribisnis 18(1):12-25. [in Indonesian]
Zakaria I., Koniyo Y., Baruadi A. S. R., 2017 [Feasibility analysis of Nile tilapia culture
business in Limboto Lake]. Jurnal Ilmiah Perikanan dan Kelautan 5(1):25-30. [in
Indonesian]
Received: 29 September 2020. Accepted: 25 October 2020. Published online: 27 October 2020.
Authors:
Muhammad Nur, Doctorate Program of Agricultural Science, Lambung Mangkurat University, Jl. Jend. Ahmad
Yani KM 36 Banjarbaru, South Kalimantan, Indonesia, e-mail: nur@mhs.ulm.ac.id
Muhammad Ahsin Rifa’i, Faculty of Fisheries and Marine Science, Lambung Mangkurat University, Jl. Jend.
Ahmad Yani KM 36 Banjarbaru, South Kalimantan, Indonesia, e-mail: m.ahsinrifai@ulm.ac.id
Rizmi Yunita, Faculty of Fisheries and Marine Science, Lambung Mangkurat University, Jl. Jend. Ahmad Yani KM
36 Banjarbaru, South Kalimantan, Indonesia, e-mail: rizmiyunita@ulm.ac.id
Leila Ariyani Sofia, Faculty of Fisheries and Marine Science, Lambung Mangkurat University, Jl. Jend. Ahmad
Yani KM 36 Banjarbaru, South Kalimantan, Indonesia, e-mail: leila.ariyani@ulm.ac.id
This is an open-access article distributed under the terms of the Creative Commons Attribution License, which
permits unrestricted use, distribution and reproduction in any medium, provided the original author and source
are credited.
How to cite this article:
Nur M., Rifa’i M. A., Yunita R., Sofia L. A., 2020 Feasibility of floating cage culture based on business scale in
Riam Kanan Reservoir, South Kalimantan Province. AACL Bioflux 13(5):2868-2877.
AACL Bioflux, 2020, Volume 13, Issue 5.
http://www.bioflux.com.ro/aacl
2877You can also read