QUEENSLAND FARMERS' FEDERATION
←
→
Page content transcription
If your browser does not render page correctly, please read the page content below
QUEENSLAND FARMERS’ FEDERATION
                                                          Primary Producers House, Level 3, 183 North Quay, Brisbane QLD 4000
                                                                              PO Box 12009 George Street, Brisbane QLD 4003
                                                                                           qfarmers@qff.org.au | 07 3837 4720
                                                                                                           ABN 44 055 764 488

                                                          Submission
           8 March 2019

           Mr Charles Millsteed
           Chief Executive Officer
           Queensland Competition Authority
           GPO Box 2257
           BRISBANE QLD 4001

           Via email: http://www.qca.org.au/Submissions/Water

           Dear Mr Millsteed

           Re: Rural irrigation pricing review 2020-24

           The Queensland Farmers’ Federation (QFF) is the united voice of intensive, semi-intensive and irrigated
           agriculture in Queensland. It is a federation that represents the interests of peak state and national
           agriculture industry organisations, which in turn collectively represent more than 13,000 farmers across
           the state. QFF engages in a broad range of economic, social, environmental and regional issues of
           strategic importance to the productivity, sustainability and growth of the agricultural sector. QFF’s
           mission is to secure a strong and sustainable future for Queensland farmers by representing the
           common interests of our member organisations:
                •   CANEGROWERS
                •   Cotton Australia
                •   Growcom
                •   Nursery & Garden Industry Queensland (NGIQ)
                •   Queensland Chicken Growers Association (QCGA)
                •   Queensland Dairyfarmers’ Organisation (QDO)
                •   Australian Cane Farmers Association (ACFA)
                •   Flowers Australia
                •   Pork Queensland Inc.
                •   Queensland United Egg Producers (QUEP)
                •   Queensland Chicken Meat Council (QCMC)
                •   Bundaberg Regional Irrigators Group (BRIG)
                •   Burdekin River Irrigation Area Irrigators Ltd (BRIA)
                •   Central Downs Irrigators Ltd (CDIL)
                •   Pioneer Valley Water Cooperative Ltd (PV Water)
                •   Theodore Water Pty Ltd.

         QFF welcomes the opportunity to provide comment on the Rural irrigation price review 2020-24. A
         separate submission will be lodged on the Consultation Paper Rural irrigation price review:
         apportionment of dam safety upgrade costs. We provide this submission without prejudice to any
         additional submission from our members or individual farmers.
The united voice of intensive agriculture
This submission will address the following matters defined in the Referral and Direction Notice issued by
the Queensland Government to the QCA:
• An appropriate allowance for prudent and efficient expenditure on renewing existing assets.
• Prudent and efficient operational, maintenance and administration costs.
• Costs incurred to implement the 2015 recommendations made by the Inspector-General
Emergency Management (IGEM).
• Increases in the costs of distribution losses.
• Costs of recreation facilities that are incurred after 1 July 2020 are not to be considered.
• Part A prices including Part C prices for distribution schemes assessed to be below cost
reflective are to be increased by $2.38 per ML per annum + CPI. If these prices are above cost
reflective the assessed cost reflective price is to apply. However, the Part B prices including Part
D prices for distribution schemes are to go to cost reflective immediately.
• Consideration of the application of access charges in schemes with significant numbers of small
consumers.
• Impacts of prices on schemes and customers.
The Attachment (pages 10 and 11) to this submission provides forecasts of the bulk and distribution
prices for schemes in 2020-21 compared with the current price path for 2019-20. Thirteen (13) schemes
will have increases in prices of over $6/ML for water used in this first year of the proposed price path,
seven (7) schemes will have increases over $10/ML and three (3) will face increases over $20/ML. In
addition, SunWater projects an increase of 8% annually in revenue state wide over the 4 years of the
price path. These increases are unacceptable for most schemes.
QCA must investigate the impact of these projected increases. Continued escalation of prices,
particularly fixed tariffs, are likely to continue to drive down demand in many schemes and hence push
prices higher. There must also be thorough scrutiny of the need and efficiency of costs and a full
investigation into the issues raised in this submission.
Non-Routine expenditure
SunWater attributes the very large negative balances in annuity across most Bulk schemes being to
flood damage. It is important that QCA exclude the cost of damage that is related to any unresolved
insurance claim or potential claim for flood damage that has incurred during this price path.
There also needs to be a major review of SunWater’s Asset Management System (AMS). The cost of
running this system and the inefficiencies of the approach is driving up the costs of the Non-Routine
expenditure. The asset condition assessments have and are continuing to push the asset replacements
into the future. At the same time, these assessments are consuming the annuity balances set aside to
replace the assets, through what is effectively very expensive asset condition reporting.
With the large costs in running SunWater’s AMS it is important to ensure small assets and projects (e.g.
air valves and patch painting) are not included in the system and must be allocated to maintenance
where they belong.
As shown in Figure 1 there has been a 112% blowout in Non-Routine expenditure across all schemes
from QCA target for 2013-18 totalling $69,160,000 compared to the SunWater Actuals/Forecast totalling
$146,566,000 for the same period. This is driving the need for the annuity cost per year to go up 100%
at the start of the proposed new price path. What confidence can irrigation customers have in any
Capex plans when they are so consistently unreliable?
QCA Rural Irrigation Price Review 2020-24, March 2019 2 of 13Figure 1. Non-Routine Expenditure (actual and forecast) Source: SunWater financial model Recommendations: 1. QCA review the efficiency (or otherwise) of SunWater’s Asset Management System. 2. QCA looks back at non-routine expenditure as well as forward to ensure only the prudent and efficient costs are passed on to customers. Routine expenditure Overheads (Non-direct costs) SunWater has used the 2018/19 water year as the base year to forecast cost. There have been large increases in overheads for most schemes in 2017/18 and 2018/19 years that have not been accounted for and this is particularly the case for the distribution schemes. QFF contends that SunWater should not have used 2018/19 as the base year to forecast future costs. SunWater’s non-direct costs for irrigation customers have increased from an actual $11.1 million in 2017 to a forecast $17.6 million in 2019 representing a $6.5 million increase in two years. SunWater needs to demonstrate the requirement for the 59 per cent increase in non-direct costs. To do this, SunWater needs to outline its total non-direct costs and explain the allocation method used for irrigation customers. Have all non-direct costs increased at this rate, or just irrigation costs? SunWater’s business has had to deal with a large amount of flood repair work and now a very large dam improvement program. Both projects can be charged out at full commercial rates. The distribution of non-direct costs to these projects must be examined to ensure there is no doubling up in the allocation of these costs. As shown in Figure 2 there have been large increases in overhead costs and a change in the allocation of those costs. QCA needs to establish the efficient cost of overheads and the allocation of those costs. QCA Rural Irrigation Price Review 2020-24, March 2019 3 of 13
Figure 2. Overhead costs (actual and forecast) ($ millions)

  20
  18
  16
  14
  12
  10
   8
   6
   4
   2
  -
         2013      2014     2015     2016     2017      2018      2019         2020      2021       2022   2023     2024

                              Local Area Support        Corporate Support             Indirect Costs

Source: SunWater pricing model, output graph data tab

Opex costs

SunWater’s operations expenditure relating to irrigation increased from an actual $39.6 million in 2017
to a forecast of $47.2 million in 2019 – a $7.6 million increase over two-years (as shown in Figure 3).
Thereafter, a general upward trend occurs for the duration of the price path. Again, this is a substantial
increase of over 19% and must be reviewed.

Figure 3. SunWater’s operation costs (all schemes) ($ millions)

  60

  50

  40

  30

  20

  10

  -
         2013      2014      2015      2016     2017       2018         2019     2020        2021      2022    2023       2024

                Labour     Contractors & Materials        Electricity      Insurance        Other      Non-direct costs

Source: SunWater pricing model, output graph data tab

QCA Rural Irrigation Price Review 2020-24, March 2019                                                                 4 of 13
Recommendations: 3. QCA investigate the use of the forecast 2018/19 water year as the base year in the SunWater financial model. 4. QCA review the efficiency and allocation of all overhead costs as well as the prudence of them. 5. QCA examine the distribution of non-direct costs to these projects to ensure there is no doubling up in the allocation of these costs. 6. QCA review increases within SunWater’s actual operational costs for 2018 and the forecasts for 2019. Electricity Electricity costs have become a major component of water charges during this price path and are projected to escalate further during the next price path. Electricity makes up 19.5% of the total routine costs for 2019 and 20.75% for 2024 within SunWater’s financial model. The data presented by SunWater for electricity would appear not to reflect the step increases in 2020 for the proposed electricity demand tariff changes for some schemes. We strongly urge SunWater and QCA to focus on ensuring the correct price for electricity is used and then ensure it is allocated to a cost/ML for the setting of prices. This includes defining the cost as fixed or variable. Previously, QCA used an average of the past 15 years of water use to determine the variable charges. A different process must be investigated for this review. The electricity unit cost per ML must be established. This should not rely on averages using past water use. It should however reflect 15 years of data aligning electricity use with water use to establish the cost/ML of electricity. Out of that the fixed and variable costs for electricity can be allocated. For the schemes that wish to have full transparency on electricity costs, a separate part E charge for the variable cost of electricity should be established. This could then be used in a pass-through process. The pass-through process still needs to ensure electricity costs are projected with the best data available to avoid price shocks during the price path period. The time frames for the pass through need to be limited to ensure that the new user is the impactor of the under or over spend to be recovered. There also needs to be some transparency in the cost of managing this type of process. Recommendations: 7. QCA establish the electricity unit cost per ML. 8. QCA investigate whether a separate part E charge for the variable cost of electricity could be established in some schemes. 9. QCA establish a transparent approach for passing through electricity costs. Insurance If the full cost of insurance is to be passed on to water users, QCA needs to ensure all works that are relating to possible claims are removed from the Non-Routine costs. Recommendations: 10. All flood damage costs that are or could be related to an insurance claim be removed from the non-routine expenditure. 11. Any outstanding claims be removed from the calculations of the annuity as QCA recommended for the previous pricing review. 12. A detailed review of insurance costs be completed to establish the correct allocation of the costs as well as the prudence and efficiency of the costs being proposed by SunWater. QCA Rural Irrigation Price Review 2020-24, March 2019 5 of 13
Inspector-General Emergency Management (IGEM) costs
In accordance with the State Government’s Referral and Direction Notice, SunWater has allocated the
full costs of flood management including emergency action planning and monitoring and reporting
seasonal flood events to schemes. These flood management requirements are in response to the IGEM
report. A significant component of this cost is $2.5 million for the SunWater flood room. This is on top of
the costs already being passed on to water users for the large network of existing SunWater stream
gauging stations which are used state-wide in all flood modelling and monitoring for the Bureau of
Meteorology and other organisations such as local disaster management groups (LDMG) and councils.
The information is used to inform the public of flood risk.
It must also be recognised that the dams SunWater is managing, do not make or cause the floods, and in
most cases reduce the flooding impact caused by upstream rainfall even if many dams do not have a
designated flood mitigation role. If the dams were not in place there would still be a requirement to
manage the risk to populated areas during flood events. The requirement to manage the risk is not
brought about by the capture of water, so the cost should not be passed on the people using the water.
The IGEM recommendations are passing the responsibility of the work of the Bureau of Meteorology
and the local disaster management groups on to SunWater. The State Government’s direction to QCA
now passes these costs on to water users. This is a community safety program which needs to be funded
by the community, not SunWater customers.
Figure 4 shows the IGEM costs that SunWater has allocated to schemes for this pricing round.
Figure 4. IGEM cost allocation from SunWater
Allocation
Allocation Amount
$/ML Service Contract Percentage of bulk
$’000
costs
$14.50/ML LBC - Callide WS 9.75 282
$0.90/ML BIG - Bundaberg IS 6.22 180
$4.63/ML BBR - Barker Barambah 5.5 159
$0.90/ML BBB - Bundaberg WS 5.5 159
$0.69/ML LBN - Nogoa WS 5.5 159
$2.53/ML ABP - Proserpine WS 5.5 159
$4.68/ML IBU - Upper Condamine 5.5 159
$0.13/ML ABB - Burdekin WS 4.88 141
$2.25/ML KBE - Eton WS 4.88 141
$5.64/ML IBT - Macintyre Brook 4.88 141
$0.69/ML MBM - Mareeba WS 4.88 141
$1.67/ML IBS - St George WS 4.88 141
$2.31/ML KBB - Bowen Broken 3.11 90
$2.07/ML BBY - Boyne WS 3.11 90
$1.46/ML LBD - Dawson WS 3.11 90
$1.15/ML KBP - Pioneer WS 3.11 90
$6.19/ML LBT - Three Moon WS 3.11 90
$1.85/ML BBU - Upper Burnett 3.11 90
Total cost 2499
Source: SunWater financial model
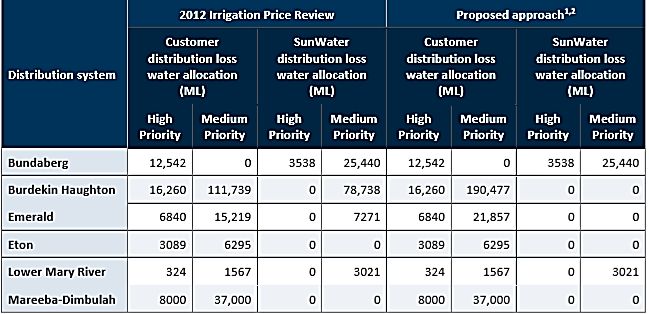
QCA Rural Irrigation Price Review 2020-24, March 2019 6 of 13Recommendations: 13. The IGEM costs be passed through to the beneficiaries not water users. 14. QCA examine the allocation of these costs including all dams that SunWater manage. Bulk water costs for distribution losses Distribution losses for bulk water costs are becoming a major part of the distribution scheme costs. In the previous pricing review, only the prudent volume requirement for distribution losses was costed to each distribution scheme. SunWater is proposing all the bulk water distribution losses allocation costs be transferred to the distribution schemes. This is after there was agreement through the local management investigation (LMA) process that unused distribution losses allocation could be seasonally transferred and, in some schemes, carried over. Water uses should only be costed the prudent efficient requirement for losses allocation as SunWater has the ability now to seasonally trade the unused component. A major review of the requirements of distribution losses allocations needs to be done to maximise the allocation availability for productive use as well as ensuring efficient water charges for distribution customers. Figure 5 has data extracted from SunWater’s financial model which shows the step increases in the cost of distribution losses allocations on distribution schemes. Figure 6 shows the comparison of the distribution loss allocations for the affected distribution schemes. There are very large increases in Bulk water costs for distribution losses due to changing Headworks Utilisation Factors (HUF’s), Dam Improvement Plans (DIP) to address dam safety issues, and price increases owing to large increases in non-routine expenditure. Figure 5. Distribution schemes – costs of distribution loss allocations Distribution Schemes 2019 2020 2021 2022 2023 2024 Emerald 434 397.7 582 624 643.4 660.5 Mareeba 474.4 470.9 647.8 663.8 679.0 694.2 Lower Mary 43.6 44 60.8 61.8 62.9 64 Eton 537.4 514 620.8 633.9 650.3 664.5 Burdekin 766 696.8 1065.4 1755.4 2933.3 3662.9 Bundaberg 405.9 410.0 928.6 957.4 985.1 1000.2 Totals 2661.3 2533.4 3905.4 4696.3 5954 6682.3 Source: SunWater financial model Figure 6. Comparison of Distribution loss allocation Source: SunWater Submission Appendix + QCA Rural Irrigation Price Review 2020-24, March 2019 7 of 13
Recommendations:
15. QCA review of the requirements of distribution losses allocations to maximise the allocation
availability for productive use as well as ensuring efficient water charges for distribution customers.
16. Only the demonstrated requirement for distribution losses allocations should be passed on to
distribution customers.

Recreation area costs

QFF welcomes the State Government’s decision to exclude recreation area costs from the irrigation
pricing review. These costs are increasing across many schemes. QFF notes this is not just in mowing
grass and cleaning toilets, it also includes major water treatment plant upgrades to supply water to the
recreational areas and studies to establish objects under the water surface to improve safety for
recreational users.

It is important that the methodology used to extract theses costs be investigated to ensure all costs for
the provision and servicing of recreation area demands are excluded for this and future pricing
investigations. For example, are transition payments paid to councils to take over the recreational areas
leading up to the start of the next price path being excluded from future costs like non-routine
expenditure? Figure 7 shows the recreation costs that have been extracted from schemes.

Figure 7. Recreation facilities and services costs
                                                                                        Base Year
Step Changes - Routine (nom $000)     Rec Facilities                          Total
                                                                                         Costs (1)
                                                                                                     % Step
BBR - Barker Barambah WS                        (21)                            (21)          892     -2.4%
KBB - Bowen Broken WS                          (260)                           (260)        1,353    -19.2%
BBY - Boyne WS                                  -                               -             570      0.0%
BBB - Bundaberg WS                                (6)                             (6)       1,734     -0.3%
ABB - Burdekin WS                              (427)                           (427)        2,545    -16.8%
LBC - Callide WS                                (23)                            (23)        1,289     -1.8%
IBH - Chinchilla Weir WS                        -                               -               84     0.0%
IBN - Cunnamulla Weir WS                        -                               -               35     0.0%
LBD - Dawson WS                                 -                               -             791      0.0%
KBE - Eton WS                                  (141)                           (141)        1,249    -11.3%
LBF - Lower Fitzroy WS                          -                               -             182      0.0%
BBL - Lower Mary WS                             -                               -             318      0.0%
IBT - Macintyre Brook WS                        (76)                            (76)        1,178     -6.5%
IBM - Maranoa WS                                -                               -               27     0.0%
MBM - Mareeba WS                                (25)                            (25)        1,259     -2.0%
LBN - Nogoa WS                                 (303)                           (303)        2,145    -14.1%
KBP - Pioneer WS                                -                               -           1,010      0.0%
ABP - Proserpine WS                            (126)                           (126)        1,071    -11.8%
IBS - St George WS                              (23)                            (23)        1,090     -2.1%
LBT - Three Moon WS                             -                               -             522      0.0%
BBU - Upper Burnett WS                          (69)                            (69)        1,114     -6.2%
IBU - Upper Condamine WS                        (96)                            (96)        1,333     -7.2%
BIG - Bundaberg IS                              -                               -           6,235      0.0%
AIE - Burdekin IS                               -                               -          12,005      0.0%
LIT - Dawson IS                                 -                               -             304      0.0%
LIW - Emerald IS                                -                               -           2,608      0.0%
KIA - Eton IS                                   -                               -           2,900      0.0%
BIC - Lower Mary IS                             -                               -             873      0.0%
MIM - Mareeba IS                                -                               -           5,214      0.0%
IIS - St George IS                              -                               -             -        0.0%
 Total                                       (1,596)    -   -        -       (1,596)       51,927     -3.1%
Source: SunWater financial model

Recommendations:
17. QCA investigate the methodology used to extract recreational area costs to ensure that all costs
for the provision and servicing of recreation area demands are excluded for this and future pricing
investigations.

QCA Rural Irrigation Price Review 2020-24, March 2019                                                    8 of 13
Implementation of cost reflective Part B & D prices
The cost increases across SunWater irrigation schemes in the first year of the price path will be 12% if
QCA does not consider the need to moderate these impacts in keeping with item (1.4) (a) of the State
Government’s Referral and Direction Notice regarding ‘balancing the legitimate commercial interests of
the businesses with the interests of the customers, including considering less than cost reflective
volumetric prices which are necessary to moderate bill impacts for customers.’
QFF submits that there needs to be a clear policy direction in transitioning schemes to cost recovery on
parts B and D usage. The $2.38/ML/year increase needs to be applied to Part A and B in real terms as a
total, based on usage for bulk schemes and across Parts A, B, C and D as a total, based on usage for
distribution schemes.
Recommendations:
18. A clear policy direction in transitioning schemes to cost recovery on parts B and D usage be
developed.
Access charges
Access charges need to be investigated to better reflect user pays in some schemes. Water charges
(fixed plus volumetric) do not recover the costs for providing supply for small users using 2ML/year or
less. Larger users subsidise smaller users which can involve substantial contributions in some schemes.
Figure 8 shows the numbers of customers in schemes with less than 10ML of allocation.
Access charges need to be investigated and charges should be refined to reflect costs. Options to
introduce incentives through pricing to make improvements in customer behaviour e.g. prompt
payment of charges should also be investigated. QCA also needs to allow for the pricing model to have
access charges as a revenue offset.
Figure 8. Numbers of small allocation holders
No of Customer Accounts with
Scheme
less than 10ML Allocation
Barker Barambah 33
Bowen Broken Rivers 37
Boyne River and Tarong 111
Bundaberg 297
Burdekin Haughton 130
Callide Valley 47
Chinchilla Weir 24
Cunnamulla 8
Dawson Valley 54
Eton 57
Julius Dam 1
Lower Fitzroy 20
Lower Mary River 52
Macintyre Brook 25
Mareeba Dimbulah 414
Nogoa Mackenzie 238
Pioneer River 19
QCA Rural Irrigation Price Review 2020-24, March 2019 9 of 13Proserpine River 8 St George 87 Three Moon Creek 92 Upper Burnett 34 Upper Condamine 17 Total 1805 Source: SunWater financial model Recommendations: 19. QCA investigate access charges to better refine and reflect these costs, particularly for small users, and to better reflect user pays in some schemes. Impacts of setting prices While the implementation of transition pricing may assist customers to cope with price increases, several schemes will face the prospect of long periods of transition to implement cost reflective prices. These forecast prices will have impacts on the schemes and their customers. Prices to recover dam safety costs will add to these impacts in some schemes. The impacts of these pricing outcomes need to be assessed. Any approach should include assessments of direct impacts of prices on schemes and customers. Also, there should be assessments of the cumulative impacts where customers are trying to cope with other increasing costs on farm such as electricity. These direct impacts will have flow on impacts for local and regional economies which need to be investigated. Urgent consideration needs to be given to identify data needs to undertake these assessments. Recommendations: 20. QCA to outline how it would propose to assess the impact of current price setting arrangements, including direct and cumulative impacts on customers. QFF welcomes the opportunity to work through the issues raised in this submission with QCA where appropriate. Yours sincerely Travis Tobin Chief Executive Officer QCA Rural Irrigation Price Review 2020-24, March 2019 10 of 13
ATTACHMENT

                                                                    SunWater                                                           SunWater
                             Bulk            Current price                             New price       Distribution   Current price                      New price
Scheme                                                              cost reflective                                                    cost reflective
                            customers        path 2019/20                              path 2020/21    customers      path 2019/20                       path 2020/21
                                                                    2020/21                                                            2020/21
Lower Mary                  A                                15.1               9.55            15.1   A                        7.31              9.55           9.55
                            B                                1.98               3.41            3.41   B                        1.98              3.41           3.41
Distribution                C                                                                          C                          47             68.31          48.49
                            D                                                                          D                       70.27              90.1           90.1
                            Total/$ML                       17.08             12.96            18.51                          126.56           171.37          151.55
Upper Burnett               A                               30.58             50.42            33.72
                            B                                4.08              7.51             7.51
                            Total$/ML                       34.66             57.93            41.23
Barker-Barambah             A                               25.93             64.93            28.96
                            B                                 4.6               9.8              9.8
                            Total$/ML                       30.53             74.73            38.76
Upper Condamine             A                               34.03             19.92            34.03
                            B                                5.57             17.88            17.88
                            Total$/ML                        39.6              37.8            51.91
Dawson Bulk                 A                               18.04             19.78            19.78   A                       13.98            19.78           16.71
No distribution             B                                2.01              3.47             3.47   B                        2.01             3.47            3.47
                            Total$/ML                       20.05             23.25            23.25                           15.99            23.25           20.18
Cunnamulla                  A                               31.75                25            31.75
                            B                                3.58              2.29             2.29
                            Total$/ML                       35.33             27.29            34.04
Boyne                       A                               28.58                24            28.58
                            B                                1.76              2.73             2.73
                            Total$/ML                       30.34             26.73            31.31
Chinchilla                  A                               30.17             15.96            30.17
                            B                                3.45              3.87             3.87
                            Total$/ML                       33.62             19.83            34.04

    QCA Rural Irrigation Price Review 2020-24, March 2019                                                                                                      11 of 13
Macintyre Brook A 48.62 64.1 52.21
B 4.54 7.32 7.32
Total$/ML 53.16 71.42 59.53
Callide A 18.5 89.52 21.34
B 8.84 12.4 12.4
Total$/ML 27.34 101.92 33.74
Three Moon Creek A 32.43 57.69 35.62
B 4.78 13.04 13.04
Total$/ML 37.21 70.73 48.66
Mareeba-Dimbulah 15.87 5.47 15.87 A 3.45 5.47 5.47
No relift up to 100ML B 0.59 0.91 0.91 B 0.59 0.91 0.91
Distribution C 51.82 48.73 49.81
D 8.27 11.2 11.2
Total$/ML 16.46 6.38 16.78 64.13 66.31 67.39
Lower Fitzroy A 13.55 11.32 13.55
B 1.41 1.09 1.09
Total$/ML 14.96 12.41 14.64
Bundaberg A 13.06 15.85 15.76 A 7.55 15.85 10.11
B 1.31 1.79 1.79 B 1.31 1.79 1.79
Distribution C 45.08 54.92 46.21
D 58.94 75.01 75.01
Total$/ML 14.37 17.64 17.55 112.88 147.57 133.12
St George Bulk A 21.91 19.7 21.91 A 20.86 19.7 19.7
No distribution B 1.37 1.62 1.62 B 1.37 1.62 1.62
Total$/ML 23.28 21.32 23.53 22.23 21.32 21.32
Nogoa Mackenzie A 12.22 8.23 12.22 A 8.85 8.23 8.23
B 1.32 1.27 1.27 B 1.32 1.27 1.27
Distribution C 27.27 39.57 31.17
D 6.88 10.03 10.03
Total$/ML 13.54 9.5 13.49 44.32 59.1 50.7
QCA Rural Irrigation Price Review 2020-24, March 2019 12 of 13Bowen Broken A 12.51 9.05 12.51
B 6.95 20.13 20.13
Total$/ML 19.46 29.18 32.64
Burdekin A 12.71 4.41 12.71 A 3.49 4.41 4.41
B 0.54 0.57 0.57 B 0.54 0.57 0.57
Distribution C 39.1 43.37 41.63
D 29.6 32.94 32.94
Total$/ML 13.25 4.98 13.28 72.73 81.29 79.55
Eton A 31.35 31.55 31.55 A 31.35 31.55 31.55
B 4.05 20.38 20.38 B 4.05 20.38 20.38
Distribution C 38.4 76.02 42.33
D 33.63 48.13 48.13
Total$/ML 35.4 51.93 51.93 107.43 176.08 142.39
Pioneer A 14.81 20.55 17.56
B 3.13 4.13 4.13
Total$/ML 17.94 24.68 21.69
Proserpine A 13.26 15.56 15.56
B 3.02 3.91 3.91
Total$/ML 16.28 19.47 19.47
QCA Rural Irrigation Price Review 2020-24, March 2019 13 of 13You can also read