Achieving 20% Energy Savings by 2020-How Can We Get There? An Energy Efficiency Program Analysis for the Southwest U.S. States
←
→
Page content transcription
If your browser does not render page correctly, please read the page content below
Achieving 20% Energy Savings by 2020—How Can We Get There?
        An Energy Efficiency Program Analysis for the Southwest U.S. States

      Max Neubauer and Maggie Molina, American Council for an Energy-Efficient Economy
             Howard Geller and Jeff Schlegel, Southwest Energy Efficiency Project

   ABSTRACT

           About twenty-five states in the United States have an Energy Efficiency Resource
   Standard (EERS) requiring utilities or program administrators to reach long-term targets for
   energy savings through customer efficiency programs. The most aggressive EERS policies in the
   country—currently established by only a few states including Arizona and Massachusetts—
   require energy efficiency targets of about 2% per year, or about 20% electricity savings by 2020
   using 2010 as the start year. This paper—a summary of a larger report—examines an aggressive
   but achievable utility energy efficiency programs scenario for states in the Southwest. We
   developed a suite of 18 “best practice” residential and business efficiency programs and included
   an individual analysis for each state in the Southwest: Arizona, New Mexico, Colorado, Utah,
   Nevada, and Wyoming. The analyses include detailed estimates of participation rates, electricity
   savings, and program and participant costs necessary to ramp up to aggressive savings levels.
   We found that a comprehensive set of aggressive but realistic utility programs can successfully
   hit the 20% savings target by 2020 in all states except Wyoming, with a total regional investment
   of about $8.2 billion (net present value, 2010$) from 2010 through 2020 in program costs, with
   the levelized costs for the efficiency programs on average 2.2 cents per kilowatt-hour (kWh) for
   business programs and 3.5 cents/kWh for residential programs. The study also includes an
   electricity supply analysis to determine the system-wide benefits of achieving the High
   Efficiency Scenario, which is estimated to avoid about 13,500 megawatts (MW) in new capacity.
   Finally, we estimate a benefit-cost ratio for customer bill savings to energy efficiency programs
   of 2.1.

   Introduction
           About twenty-five states in the United States have an Energy Efficiency Resource
   Standard requiring utilities or program administrators to reach long-term targets for energy
   savings through customer efficiency programs. The most aggressive EERS policies in the
   country—currently established by only a few states including Arizona and Massachusetts—
   require energy efficiency targets of about 2% per year, or about 20% electricity savings by 2020
   using 2010 as the start year. This paper—a summary of a larger report—examines an aggressive
   but achievable utility energy efficiency programs scenario for states in the Southwest and
   Mountain United States: Arizona, New Mexico, Colorado, Utah, Nevada, and Wyoming. In
   addition to Arizona, several states in the region have an EERS, including Colorado, New
   Mexico, and Nevada, which includes efficiency as part of its renewable energy standard. Utah
   has a voluntary efficiency goal but not an EERS, which is a binding target. The states, which
   have been emerging as national leaders in energy efficiency policies and programs, will have to

©2012 ACEEE Summer Study on Energy Efficiency in Buildings                                             5-313
tap into the large amounts of remaining energy efficiency potential in order to meet their
increasing targets and fully benefit from the economic and energy benefits of efficiency.
Policy Context
Some states and utilities in the Southwest have taken steps to achieve 20% or greater
electricity savings by 2020, but others so far have not. Most notably, the Arizona Corporation
Commission (ACC) in 2010 adopted electric energy efficiency standards requiring regulated
utilities to achieve 22% savings by 2020, with 2% of the total possible through a credit for
demand response efforts. Utilities in Arizona have rapidly scaled up efficiency programs as a
result of this policy. In Colorado, the Public Utility Commission (PUC) adopted in 2008 energy
savings goals through 2020 for Xcel Energy, the main electric utility in the state, along with
performance-based incentives for Xcel’s shareholders tied to meeting or exceeding the goals.
The goals were increased in 2011, and if achieved would lead Xcel to achieve about 16% savings
by 2020 from programs implemented during 2010-2020. New Mexico also has adopted energy
savings requirements for regulated utilities, but they only require 10% savings by 2020 (10% of
sales in 2005) from programs implemented during 2007-2020. Nevada, Utah, and Wyoming
have not adopted long-term energy savings standards or goals, although major utilities in Nevada
and Utah are saving 1% or more of retail sales from efficiency programs implemented each year
(Geller and Schlegel 2012).
Overall Methodology
Our analysis covers the six states in the Southwest U.S. region: Arizona, Colorado, New
Mexico, Nevada, Utah, and Wyoming. We first developed statewide Reference Case forecasts of
electricity consumption through 2020 that would occur in the absence of energy efficiency
programs, and then compared that to a high-efficiency scenario. For the high-efficiency
scenario, we assumed adoption of a portfolio of 10 residential and 8 business (commercial and
industrial, or C&I) “best practice” electricity energy efficiency programs. We assumed that these
programs would ramp up during 2012-2020 to achieve aggressive but realistic energy savings.
For each program, we assumed statewide levels of customer eligibility, program participation,
energy and peak demand savings per customer, and costs for both program administrators and
customers. We also accounted for existing program offerings in each state in the estimates for
energy savings impacts and costs. We prepared a separate analysis for each state as well as the
region as a whole.
Reference Case Assumptions
For each state analysis we developed a Reference Case forecast of electricity sales
(GWh) and peak demand (MW), which excludes the projected impacts of either ongoing or
potentially new utility energy efficiency programs. We started with 2010 baseline electricity
sales data (EIA 2012). We analyzed recent available Integrated Resource Plans (IRP) for utilities
in each state and collected data on electricity sales and peak demand forecasts (excluding energy
efficiency program impacts). We then developed statewide sales and peak demand forecasts
©2012 ACEEE Summer Study on Energy Efficiency in Buildings 5-314using a weighted average of the utility forecasts’ annual growth rates.1 While some states have
projections of business-as-usual (BAU) energy efficiency levels and demand, we did not include
a separate BAU scenario because not all states had undergone this energy efficiency resource
planning process.
Choosing Model Programs
Our portfolio of model energy efficiency programs (see Table 1) covers a comprehensive
set of strategies for residential, commercial, and industrial customers. We developed this list of
best practice program offerings by examining what leading utilities and other program
administrators in the U.S. and the Southwest region are typically offering in their program
portfolios.
Table 1. List of Residential and Business Programs Analyzed
Residential Commercial and Industrial
1. Low-Income Weatherization 1. New Construction and Code Support
2. Multi-Family Retrofit 2. Small Business Direct Install
3. New Construction and Code Support 3. Custom Retrofits, Process Efficiency, and Self-Direct
4. Home Retrofit (“Light” & Comprehensive) 4. Computer Efficiency and other Plug Loads
5. Retail Products 5. Prescriptive Rebates and Upstream Incentives
6. Residential Lighting 6. Commercial Tenant Lighting Redesign
7. Refrigerator/ Freezer Recycling 7. Retrocommissioning
8. Residential Cooling 8. Combined Heat and Power (CHP)
9. Water Heating
10. Home Energy Reports & Information Feedback
Treatment of Existing Utility Program Portfolios and Plans
Many utilities in the Southwest and Mountain states are currently administering some
energy efficiency programs, and we accounted for these program impacts in the first few years of
the analysis. For each state, we compiled utility program data and used this to estimate actual
program impacts in the years 2010 and 2011. We also used 2012 program plans in some cases, if
available, to inform our assumptions about 2012 program impacts. Some existing utility
portfolios have programs that do not fit the same general definitions of our model programs
above, however, so in these cases we had to re-categorize programs such as combining several
utility program results into one model program category.
When a state did not already have the model program in place, we assumed that in 2012
the program would start statewide at very modest levels and ramp-up in subsequent years. When
2012 utility program plans were available, we used these plans to inform our analysis (e.g.,
savings per participant, cost data); however, we scaled up model programs to the state level
rather than to the utility level.
It is important to note that our program estimates are statewide values, and not just for
major investor-owned utilities (IOUs), and therefore readers should be careful not to directly
compare our analysis to individual utility plans.
1
We use data from several utility IRPs: Arizona—Arizona Public Service Company (APS 2011b) and Salt River Project (SRP
2010); Nevada—Nevada Power Company (NPC 2011) and Sierra Public Power Company (SPPC 2011); Utah and Wyoming—
Rocky Mountain Power (PacifiCorp 2011a); Colorado—Tri-State Generation and Transmission (Tri-State 2010) and Xcel
Energy (Xcel 2011a); New Mexico—Public Service Company of New Mexico (PNM 2011).
©2012 ACEEE Summer Study on Energy Efficiency in Buildings 5-315Participation, Energy and Peak Savings, and Cost Estimates
For each program, we first collected existing program data if currently offered in the
state. We then developed forecasts of the number of eligible customers and estimated ramp-ups
in participation rates based on best practice programs in Southwest states and across the U.S.
As an example, program eligibility for the business retrocommissioning program includes large
buildings greater than 100,000 square feet, which we estimated based on regional data from
EIA’s Commercial Building Energy Consumption Survey (EIA 2008). The existing program
offered in Utah has reached about 1-2% of eligible customers per year, and we estimated a slow
but steady ramp-up to about 12% per year so that 80% of eligible customers are reached by 2020.
We performed a similar exercise for each program, and more details can be found in the
forthcoming full report by SWEEP.
Gross energy savings (kWh) and peak impacts (kW) per participant were similarly
estimated from best practice programs within or outside the region. Program costs and customer
costs were estimated on a per participant basis or cost per first-year kWh saved. Incremental
annual savings represent one program year’s new impacts only, while total annual savings
include the previous year’s total savings plus incremental annual savings. We examined several
resources on energy efficiency programs to develop these estimates for our analysis.2
Energy savings values were adjusted to take into account pending updates to federal
product standards and assumptions on the adoption of statewide building energy codes. The per-
unit savings generated by measures that are regulated by federal product standards are adjusted
downward due to anticipated updates to the individual standards, which decrease per-unit energy
consumption. Similarly, the per-participant savings generated in the residential and commercial
new construction programs are adjusted downwards to take into account our assumptions on the
adoption of new, more stringent building energy codes. In other words, as building energy codes
become more stringent and building energy use declines, the potential savings generated by these
programs also declines.
Benefit-Cost Analysis
Using the energy savings and cost estimates, we then examined the cost-effectiveness of
each program. Estimates of gross program savings are based on a wide variety of sources from
regional and national best practice programs. The net savings were calculated based on an
assumed net-to-gross ratio for each program, which we estimated based on typical program
assumptions and held constant across all states. For determining cost of saved energy and net
present values of costs and benefits, we assumed a 5% real discount rate.3 Measure lifetime
assumptions were also held constant across all states. Table 2 presents the key assumptions
regarding measure lifetime and net-to-gross energy savings ratios for each model program. Table
2 also includes the levelized cost of saved energy for each type of program, which is a function
2
Further details on each program analysis and the accompanying list of references can be found in the full-length report, which is
forthcoming by SWEEP. Key regional sources include: APS 2010, 2011a; NPC 2011; PacifCorp 2011b; RMP 2010a, 2010b; and
Xcel 2010, 2011b, 2011c.
3
We assume a 5% real discount rate, which includes the cost of capital but excludes the impact of inflation. This rate has been
commonly used in efficiency programs—for example, the California Energy Commission (CEC) has used real discount rates
ranging from 3–5% since the 1980s (CEC 2005). In 2012, cost of capital rates for electric utilities in the U.S., which are
generally used to estimate discount rates, are only about 4.2% nominal (NYU 2012). This makes our 5% real discount rate a
conservative assumption for this analysis.
©2012 ACEEE Summer Study on Energy Efficiency in Buildings 5-316of program costs and energy savings, average measure lifetime, and the discount rate. The cost of
saved energy for residential programs ranges from $0.02–0.09 per kWh, with an overall average
of $0.036/kWh. The cost of saved energy for commercial and industrial programs ranges from
$0.01–0.05 per kWh, with an overall average of $0.022/kWh.
Table 2. Summary of Program Net-to-Gross Ratios, Measure Lifetimes, and
Levelized Costs
Net-to-Gross Average Measure Levelized Cost of Saved
Program
Ratio Lifetime (Years) Energy ($/kWh)**
Residential
Low-Income Weatherization 100% 10 $0.09
Multi-Family 80% 13 $0.04
New Construction and Code Support 80% 20 $0.03
Home Retrofit 80% 13 $0.02
Retail Products 80% 10 $0.02
Residential Lighting and Recycling Varies over time 10 $0.02
Refrigerator Recycling 60% 9 $0.05
Cooling Varies over time 15 $0.06
Water Heating 80% 13 $0.05
Home Energy Reports and Information 100% 1 and 5* $0.04
Feedback
Commercial and Industrial
New Construction and Code Support 80% 14.7 $0.01
Small C&I Direct Install 98.5% 12.7 $0.05
Large C&I Custom Retrofits, Process 80% 15 $0.02
and Self-Direct
Computer Efficiency and Other Plug 90% 7 $0.02
Loads
Tenant Build-out Lighting Design 80% 13 $0.02
Prescriptive Rebates for C&I 80% 16 $0.04
Equipment Replacement
Retrocomissioning 100% 7 $0.03
Combined Heat and Power 100% 19.6 $0.01
*1 year for enhanced billing, 5 years for in-home displays; ** Levelized costs of saved energy are calculated
assuming total program costs only through 2020, a real discount rate of 5%, average measure life, and total annual
energy savings in 2020. These costs do not include customer investments or operating costs, such as for CHP.
Table 2 includes estimates of the cost of saved energy based on utility program costs only
(excluding participant costs). Considering the relative sizes of the different programs, the overall
average cost of saved energy is $0.035/kWh for residential programs and $0.022/kWh for
business programs. These values are consistent with the experience of leading utilities in the
U.S., which have been saving electricity at an average overall cost of $0.025 per kWh saved
(Friedrich et al. 2009).
High-Efficiency Scenario Results
The total annual electricity savings results of the high-efficiency scenario are summarized
by state and region-wide in Figure 1. Tables 3 and 4 provide further detail of the estimated
electricity and peak demand impacts, respectively, by state and year. By 2020, the region would
©2012 ACEEE Summer Study on Energy Efficiency in Buildings 5-317save nearly 50,000 GWh or 21% (relative to sales in that year). And although we examined
impacts of programs implemented through 2020, some of those savings would continue to occur
through 2030 over the measure lifetimes, as shown in Figure 1.
Figure 1. Electricity Consumption by State in Reference and High-Efficiency Scenarios
400
350
300
Electricity Sales (TWh)
250
200
150
100
50
0
2010 2015 2020 2025 2030
Arizona Colorado Nevada New Mexico Utah Wyoming
Notes: Column on the right for each year shows the High Efficiency Scenario. 2010 shows actual electricity sales
data; see Table 3 below for efficiency program saving contributions in 2010. The program analysis ends in 2020, but
savings continue to occur through 2030.
As shown in Table 3, our analysis finds that each state except for Wyoming could reach
at least 20% by 2020, while Wyoming could reach 15% savings by 2020. While we assumed the
same set of best practice programs for each state, and similar ramp-ups in participation rates,
differences in the results among states occurred due to several factors. These include the starting
point of energy savings and participation of existing programs in 2010-2011; the relative mix of
residential, commercial, and industrial customers; the relative size of customers; and forecasts
for new construction rates; as well as differences in electricity end-use consumption (e.g.,
heating and cooling degree days).
Peak demand impacts, shown in Table 4, are the estimated impacts from the energy
efficiency programs alone, which we developed for each program using per-participant peak
demand reductions based on best practice program results. We did not estimate additional
impacts from demand response—i.e., load management, programs. We estimate that the best
practice portfolio of energy efficiency programs could save 9,681 MW by 2020, which is
equivalent to 18% of the modified peak demand in the same year.
©2012 ACEEE Summer Study on Energy Efficiency in Buildings 5-318Table 3. Total Annual Electricity Savings by State (GWh)
Savings in
Electricity
State 2010 2015 2020 2020 as % of
Sales in 2020
2020 Sales
Arizona 695 6,059 16,713 78,111 21%
Colorado 285 4,373 11,495 1,538 22%
Nevada 304 2,722 7,040 31,321 22%
New Mexico 87 1,863 5,110 21,370 24%
Utah 194 2,455 6,234 30,757 20%
Wyoming 17 1,143 3,238 20,771 15%
Total Regional Savings 1,582 18,615 49,828 234,469 21%
Regional Reference Case* 227,109 254,642 284,298 284,298
High EE Case* 227,109 236,027 234,469 234,469
*2010 sales are adjusted for savings generated by efficiency programs in the 2010 program year, so the Reference
and High EE Case sales are the same in 2010.
Table 4. Total Annual Peak Demand Savings by State (MW)
Savings in
Peak Load in
State 2010 2015 2020 2020 as % of
2020
Sales
Arizona 111 1,183 3,239 21,486 15%
Colorado 52 861 2,213 11,020 20%
Nevada 53 645 1,745 8,096 21%
New Mexico 10 351 973 4,719 20%
Utah 29 450 1,144 6,312 18%
Wyoming 1 132 367 2,561 14%
Total Regional Savings 257 3,622 9,681 54,194 18%
Regional Reference Case* 52,009 57,651 63,875 63,875
High EE Case* 52,009 54,029 54,194 54,194
* 2010 peak load requirements area adjusted for savings generated by efficiency programs in the 2010 program year,
so the Reference and High EE Case peak load requirements are the same in 2010.
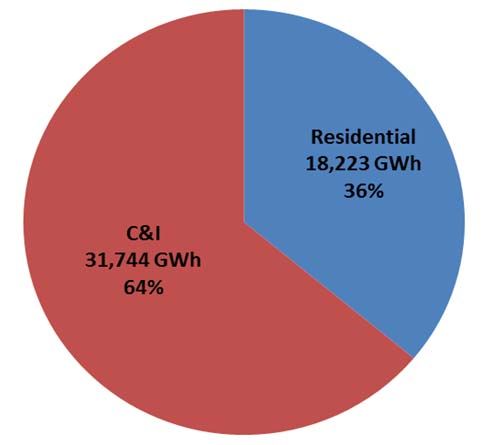
The relative savings contributions by sector and by program vary somewhat by state;
however, overall in each state the business sector savings exceed the residential sector savings.
Overall, we estimated that region-wide the residential sector accounts for 36% of the electricity
savings and the C&I or business sector accounts for 64% of the savings (see Figure 2). The
program-by-program breakdown of electricity savings also varied somewhat from state to state,
and the overall regional results are shown in Figures 3 and 4.
©2012 ACEEE Summer Study on Energy Efficiency in Buildings 5-319Figure 2. Regional: Total Annual Electricity Savings in 2020 by Sector (GWh)
Figure 3. Regional: Total Annual Residential Electricity Savings in 2020 by Program
(GWh)
Low‐Income
1,587 GWh, 9%
Multi‐Family
Home Energy 475 GWh, 3%
Reports & Info.
Feedback
Water Heating 3,096 GWh, 17%
752 GWh, 4% New Const.
1,965 GWh, 11%
Cooling
1,673 GWh, 9% Home Retro.
2,575 GWh, 14%
Refrigerator Lighting
Recycling 3,980 GWh, 22%
1,028 GWh, 6%
Retail Prods.
828 GWh, 5%
©2012 ACEEE Summer Study on Energy Efficiency in Buildings 5-320Figure 4. Regional: Total Annual Commercial and Industrial Electricity Savings in 2020 by
Program (GWh)
Combined Heat New Const.
and Power 4,156 GWh, 13%
4,470 GWh, 14%
Retrocomm. Small C&I / Direct
2,013 GWh, 6% Install
3,397 GWh, 11%
Tenant Buildout
Ltg. Design
583 GWh, 2% Prescriptive
Rebates Custom Efficiency
7,641 GWh, 24% Retrofits
7,932 GWh, 25%
Computer
Efficiency
1,678 GWh, 5%
We estimated costs to administer each type of program, including both incentives
delivered to customers or other mid-stream/up-stream market players, as well as marketing and
other associated administrative costs. As shown in Table 5, we estimated that overall program
costs for the regions would reach about $1.78 billion annually in 2020, or about $8.23 billion net
present value through 2020. As shown previously, estimated levelized costs are $0.022/kWh for
business programs and $0.035/kWh for residential programs, which is far less than the levelized
costs for new electricity generation supply.
Table 5. Program Costs by State (Million 2010$)
NPV through
State 2010 2015 2020
2020*
Arizona $54 $377 $623 $2,767
Colorado $43 $257 $404 $1,918
Nevada $29 $152 $248 $1,137
New Mexico $15 $121 $191 $877
Utah $40 $138 $214 $1,052
Wyoming $4 $71 $101 $480
Total Regional Costs $185 $1,116 $1,780 $8,230
*Note: Assumes 5% real discount rate
©2012 ACEEE Summer Study on Energy Efficiency in Buildings 5-321Electricity Market Impacts Results
Synapse Energy Economics developed a methodology and created a model for
calculating avoided electricity costs at the state level using a number of public data sources,
including load and fuel price forecasts. The model begins with an analysis of actual electricity
generation and cost data for a base year, develops a plan for meeting projected physical
requirements in each future year of the study period, and calculates the incremental wholesale
electricity costs associated with that plan (incremental to electricity supply costs being recovered
in current retail rates). This model has been used and refined by Synapse since 2009 in a number
of avoided cost studies.
The High Efficiency Scenario reduces state sales in 2020 by 17.5% relative to the
Reference Case, and the relative savings still remain at 14.5% by 2030. The overall growth rate
in the Reference Case is 2.09%, which is lowered to 1.29% in the High Efficiency Scenario.
Figure 5 below summarizes those differences.
Figure 5. Customer Sales in the Southwest
400,000
350,000
300,000
Retail Sales (GWh)
250,000
200,000
150,000
100,000
50,000
0
2010 2015 2020 2025 2030
Year
Reference Case High EE Case
The generation mix for the Southwest region is currently dominated by coal, which
makes up 58% of the generation mix. Natural gas makes up 25%, nuclear makes up 10%, and
hydro and other renewable technologies make up the remaining 7% of generation. Figure 6
below shows how the generation mix changes over time in the High Efficiency Scenario.
Generation from hydroelectric and nuclear generating resources stays constant over time. Some
coal generation is retired for economic reasons, and natural gas and renewables not only make up
the difference but also increase to meet higher loads. The amount of generation and new capacity
required, however, is reduced compared to the Reference Case.
©2012 ACEEE Summer Study on Energy Efficiency in Buildings 5-322Figure 6. High Efficiency Scenario—Generation Mix in the Southwest
450,000
400,000
Wind
350,000
Generation Mix (GWh)
Solar
300,000
Biomass
250,000 Geothermal
200,000 Exist Renew
Other
150,000
Nat Gas
100,000
Coal
50,000 Nuclear
0 Hydro
2010 2015 2020 2025 2030
Year
Reduced loads mean reduced generation costs and the delay and avoidance of new plant
construction. Figure 7 shows the capacity savings in the Southwest associated with the High EE
Case as compared to the Reference Case. The coal portion reflects the retirement of 4,371 MW
of existing coal generation to avoid about $2,936M for new emission control equipment. The
majority of avoided capacity is natural gas, with almost 8,000 MW of capacity avoided in the
High Efficiency Scenario. Avoided capacity from coal follows next, with approximately 4,500
MW avoided. Fewer renewables are needed due to reduced loads, and more than 1,000 MW of a
combination of wind, solar, geothermal, and biomass capacity could be avoided.
Figure 7. Avoided Capacity in the Southwest in the High Efficiency Scenario
14,000
12,000
Capacity Savings (MW)
10,000
Wind
8,000 Solar
6,000 Geothermal
Biomass
4,000
Nat Gas
2,000 Coal
0
2015 2020 2025 2030
Year
©2012 ACEEE Summer Study on Energy Efficiency in Buildings 5-323There are five major categories of avoided costs associated with reduced electricity:
1. Capital investment in new plants in levelized terms
2. Investment in Transmission and Distribution (T&D) system expansion
3. Avoided pollution control costs from retirement of existing coal plants (also levelized)
4. Operating and Maintenance (O&M) cost reductions due to decreased generation
5. Reduced fuel consumption (on an annual basis)
Figure 8 shows those results for the Southwest. The largest savings are fuel costs and
avoided investments in new power plants. Then O&M and T&D savings grow along with
cumulative load reduction. There are also avoided emission control costs associated with the
retirement of some older coal facilities. Then as load growth returns after 2020 more capital
investment is needed so that the net savings start to level off.
Figure 8. Avoided Costs in the Southwest
4,500
4,000
Avoided Costs (M2010$)
3,500
3,000
Fuel
2,500
O&M
2,000
Pollution Control
1,500
T&D
1,000
Capacity
500
0
2010 2015 2020 2025 2030
Year
For comparison with the cost of the High EE programs, we present below the utility
avoided costs and customer bill savings in Table 6, in net present value terms. The utility
avoided cost categories do not reflect labor and material costs, nor taxes. The bill impacts
represent a more complete representation of the total costs. Note that the savings from the High
EE programs are significantly more than the total program and participant costs.
Natural gas prices represent a key uncertainty in this analysis. A sensitivity analysis
indicates that a 30% increase in natural gas prices would increase total fuel cost savings for the
High EE versus the Reference Case by 17% and increase overall customer savings by 5%. The
benefit-cost ratio would also increase by 5% from 2.11 to 2.22. A decrease in the natural gas
price would reduce the savings by the same amounts.
©2012 ACEEE Summer Study on Energy Efficiency in Buildings 5-324Table 6. Southwest Region Benefit & Cost Comparison
Utility Avoided NPV (M 2010$)
Costs (2010-2030)
Capacity 8,320
T&D 2,380
Pollution Control 2,084
O&M 4,070
Fuel 10,566
Customer Savings
Bill Impacts 36,611
EE Costs
Program Costs 8,230
Participant Costs 9,124
Total EE Costs 17,354
Benefit Cost Ratio 2.11
Conclusion
Our analysis of 18 “best practice” programs found that most states in the Southwest and
Mountain U.S. (Arizona, Colorado, Nevada, New Mexico, and Utah) could scale up to at least
20% electricity savings by 2020 (starting with 2010 as year one), and that Wyoming could scale
up to 15% savings by 2020. While existing program portfolios in the states give the region a
head start toward these levels, the region still needs a steady and aggressive ramp-up in
participation rates through a comprehensive set of best practice programs to achieve the
estimated regional electricity savings of 21%. We find that these electricity savings would be
generated mostly through business (commercial and industrial) programs (64%) and the rest
through residential programs (36%). We estimate that this mix of best practice programs would
cost the region about $17.4 billion (net present value, 2010$) from 2010 through 2020 in
program and participant costs, with levelized costs for the efficiency programs on average 2.2
cents/kWh for business programs and 3.5 cents/kWh for residential programs. We estimate
customer bill savings of $36.6 billion (net present value, 2010$), and a benefit-cost ratio of 2.1.
Finally, we estimate avoided capacity of 13,500 MW by 2030.
©2012 ACEEE Summer Study on Energy Efficiency in Buildings 5-325References
[APS] Arizona Public Service Company. 2011a. Demand-Side Management Semi-Annual
Report. July through December 2010. Phoenix, AZ: Arizona Public Service Company.
____. 2011b. “APS Resource Planning Stakeholder Meeting.” Presentation. August 1. Phoenix,
AZ: Arizona Public Service Company.
____. 2010. Demand Side Management Semi-Annual Report.” July through December 2009.
Phoenix, AZ: Arizona Public Service Company.
[CEC] California Energy Commission. 2005. Funding and Energy Savings from Investor-Owned
Utility Energy Efficiency Programs in California for Program Years 2000 to 2004.
http://www.energy.ca.gov/2005publications/CEC-400-2005-042/CEC-400-2005-042-
REV.PDF
[EIA] U.S. Energy Information Administration. 2012. State Electricity Profiles (Data for 2010).
http://www.eia.gov/electricity/state/. Washington, DC: U.S. Department of Energy,
Energy Information Administration.
____. 2008. 2003 Commercial Building Energy Consumption Survey (CBECS).
http://www.eia.gov/emeu/cbecs/cbecs2003/detailed_tables_2003/detailed_tables_2003.ht
ml. Washington, DC: U.S. Department of Energy, Energy Information Administration.
Friedrich, K. Maggie Eldridge, Dan York, Patti Witte, and Marty Kushler. 2009. Saving Energy
Cost-Effectively: A National Review of Cost of Saved Energy Saved Through Utility-
Sector Energy Efficiency Programs. Washington, DC: American Council for an Energy-
Efficient Economy.
Geller, Howard and J. Schlegel. 2012. “Utility Energy Efficiency Programs in the Southwest:
2012 Update.” In Proceedings of the 2012 ACEEE Summer Study on Energy Efficiency in
Buildings. Washington, DC: American Council for an Energy-Efficient Economy.
[NPC] Nevada Power Company. 2011. Volume 3 of 5 Technical Appendix, Load Forecast
(February 25, 2011). Filed before the Public Utilities Commission of Nevada. Nevada
Power Company.
[NYU] New York University. 2012. “Cost of Capital by Sector, Value line database of 5891
firms.” http://pages.stern.nyu.edu/~adamodar/New_Home_Page/datafile/wacc.htm. New
York University.
PacifiCorp. 2011a. 2011 Integrated Resource Plan, Volume I and II. Portland, OR: PacifiCorp
IRP Resource Planning.
©2012 ACEEE Summer Study on Energy Efficiency in Buildings 5-326____. 2011b. Assessment of Long-Term, System-Wide Potential for Demand-Side and Other
Supplemental Resources—Volumes I & II. Prepared by Cadmus Group, Inc. Portland,
OR: PacifiCorp.
[PNM] Public Service of New Mexico. 2011. Electric Integrated Resource Plan 2011-2030:
Appendix B Load Forecast. July. Prepared by the PNM Integrated Resource Planning
Department.
[RMP] Rocky Mountain Power. 2010a. Demand-Side Management Annual Report for 2009—
Utah. Salt Lake City, UT: Rocky Mountain Power.
[RMP] Rocky Mountain Power. 2010b. “Demand-Side Management Annual Report for 2009 –
Wyoming”.
[SPPC] Sierra Public Power Company. 2011. Volume 4 of 22; Load Forecast and Market
Fundamentals and Technical Appendix. Filed before the Public Utilities Commission of
Nevada. Sierra Public Power Company.
[SRP] Salt River Project. 2010. Fiscal Year 2011 Resource Plan. August. Salt River Project.
[Tri-State] Tri-State Generation and Transmission Association, Inc. 2010. Integrated Resource
Plan / Electric Resource Plan. Submitted to Western Area Power Authority and the
Colorado Public Utilities Commission. Tri-State Generation and Transmission
Association, Inc.
[Xcel] Public Service Company of Colorado. 2011a. 2011 Electric Resource Plan. Denver, CO:
Public Service Company of Colorado.
____. 2011b. 2010 Demand-Side Management Annual Status Report, Electric and Natural Gas.
Denver, CO: Public Service Company of Colorado.
____. 2011c. 2012/2013 Demand-Side Management Plan, Electric and Natural Gas. Denver,
CO: Public Service Company of Colorado.
____. 2010. 2011 Demand-Side Management Plan, Electric and Natural Gas. Denver, CO:
Public Service Company of Colorado.
©2012 ACEEE Summer Study on Energy Efficiency in Buildings 5-327You can also read