M1 PACIFIC MOTORWAY - VARSITY LAKES TO TUGUN (VL2T) DETAILED BUSINESS CASE 2018 BUSINESS CASE/COST BENEFIT ANALYSIS SUMMARY - Building Queensland
←
→
Page content transcription
If your browser does not render page correctly, please read the page content below

M1 PACIFIC MOTORWAY – VARSITY LAKES TO TUGUN (VL2T)
DETAILED BUSINESS CASE 2018

BUSINESS CASE/COST BENEFIT ANALYSIS SUMMARY

                                                      D19/875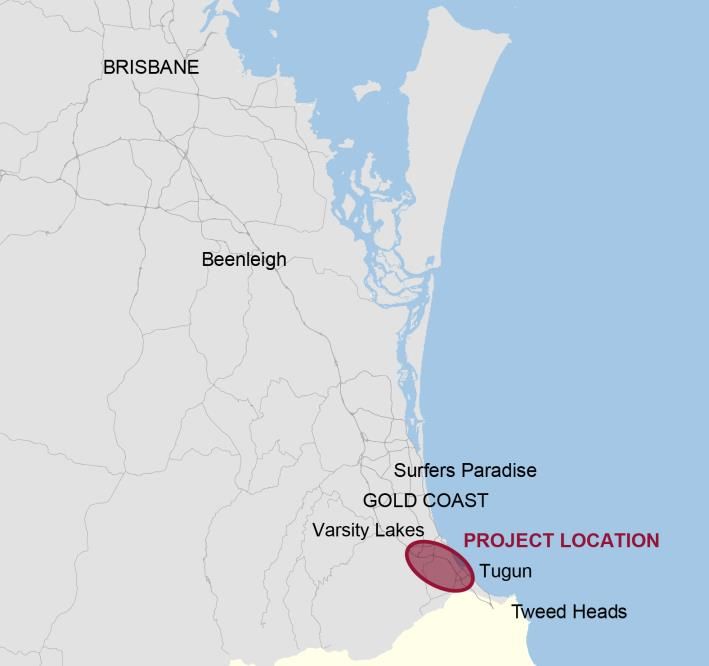
Purpose of this document   This document provides an overview of the economic analysis for the M1
                              Pacific Motorway – Varsity Lakes to Tugun Project (VL2T) detailed
                              business case. The primary objective of this document is to outline the
                              economic analysis undertaken and the key outcomes.
   Status                     This summary was prepared based on the contents of the detailed
                              business case presented to the Building Queensland Board in Q4 2018.
                              The information presented may be subject to change as the proposal
                              progresses through future stages of development, delivery and
                              operations.

VARSITY LAKES TO TUGUN SUMMARY                                                                  PAGE 1
CONTENTS 1 Summary information ......................................................................................................... 3 2 Proposal overview ............................................................................................................... 4 3 Approach ............................................................................................................................. 5 4 Base case ............................................................................................................................. 5 5 Reference project ................................................................................................................ 6 6 Methodology ....................................................................................................................... 6 7 Demand forecasts ............................................................................................................... 7 8 Profile of capital, operating/maintenance costs.................................................................. 8 9 Project benefits ................................................................................................................... 9 10 Cost benefit analysis results ................................................................................................ 9 11 Sensitivity analysis ............................................................................................................. 11 12 Other considerations ......................................................................................................... 12 VARSITY LAKES TO TUGUN SUMMARY PAGE 2
1                Summary information
     Project name                      M1 Pacific Motorway – Varsity Lakes to Tugun (VL2T) Project
     Location                          South-East Queensland.
     Proposal owner                    Queensland Department of Transport and Main Roads
     Proposed delivery agency          Queensland Department of Transport and Main Roads
     Discount rate                     7%
                                       P50                                           P90
     Project costs1                    $960 million                                  $1,017 million
     Incremental ongoing cost2         $173 million                                  $181 million
     Net Present Value (NPV)           $446 million                                  $419 million
     Benefit cost ratio (BCR)          1.74                                          1.67

1   Nominal capital cost estimates are undiscounted and have been rounded to the nearest million.
2   Nominal ongoing operating and maintenance costs, undiscounted dollars and rounded to the nearest million.

VARSITY LAKES TO TUGUN SUMMARY                                                                                  PAGE 3
2 Proposal overview The M1 Pacific Motorway is the key road link between Queensland and NSW. It is also the primary regional road connecting Brisbane and the Gold Coast. It caters for long-distance travellers, local residents, commuters, commercial vehicles, freight, buses, tour operators and international and domestic tourists. The Australian and Queensland Governments have been progressively upgrading the motorway and work is now underway on widening the section between Nerang and Tugun from four to six lanes. Construction is complete between Nerang and Mudgeeraba, works are underway from Mudgeeraba to Varsity Lakes and planning for the Varsity Lakes to Tugun section is being undertaken through the VL2T Project. The detailed business case for the VL2T Project was developed in accordance with Building Queensland’s Business Case Development Framework (BCDF) and the Queensland Government’s Project Assessment Framework. The project owner of the VL2T Project is the Department of Transport and Main Roads (TMR). Development of the detailed business case was led by Building Queensland, supported by TMR. A Project Steering Committee consisting of representatives from; TMR, Building Queensland, and the Australian Government Department of Infrastructure, Regional Development and Cities provided strategic advice and direction to the VL2T Project. VARSITY LAKES TO TUGUN SUMMARY PAGE 4
3            Approach
A cost benefit analysis (CBA) was undertaken as part of the detailed business case to establish the economic
case for the VL2T Project. The CBA seeks to estimate the net economic benefits to affected parties by
measuring the overall change in welfare caused by the proposal. CBA involves identifying and, where
possible, quantifying relevant economic costs and benefits attributable to a project incrementally from the
base case.
Costs and benefits associated with the reference project are spread over several decades. Timing differences
are accounted for by discounting values incurred after the base year. In this way, all costs and benefits are
measured and compared in ‘present value’ terms.
The economic costs of delivering and maintaining the reference project (capital and operating costs) have
been included in the CBA. All costs were estimated incremental to the base case and are expressed in real
June 2018 dollars. In keeping with the application of real effects only, project costs include only real price
escalation.
The CBA followed Infrastructure Australia’s Assessment Framework (2018) and drew on the following state
and national guidelines for guidance:
▪ Building Queensland, BCDF Cost Benefit Analysis Guide, Supplementary Guidance, Release 2, December
  2016
▪ Australian Transport Assessment and Planning (ATAP)
    – T2 Cost Benefit Analysis (August 2016)
    – PV2 Road Parameter Values (August 2016)
▪ TMR, Cost-benefit Analysis Manual—Road projects, First Edition, published February 2011.
The above guidelines were generally applied in the order listed. For more detailed guidance, or where
information on a specific topic was unclear, other documents sourced from Australian and international
literature were considered.

4            Base case
Between Varsity Lakes Interchange (Exit 85) and Tugun Interchange (Exit 95), the M1 is four lanes (two lanes
in each direction) with a posted speed limit of 100km/h. It passes through a highly developed urban area and
includes six interchanges and numerous other large structures both under and over the motorway.
Should the VL2T Project not proceed, significant works will still be required for the motorway to remain
operational. The pavement must be fully replaced, including concrete median barriers, and additional
geotechnical works are needed to strengthen embankments. The detailed business case assumed that these
works would be delivered in four stages between July 2020 and December 2027.
Pressure on the M1 Pacific Motorway will intensify as South East Queensland continues to grow and regional
employment becomes more centralised. Approximately 400,000 extra jobs are projected for Brisbane City by
2041 and about 170,000 for the Gold Coast. More workers will be commuting to these economic hubs from
surrounding local government areas, and despite upgrades to the public transport network, many of these
trips will be on the M1.

VARSITY LAKES TO TUGUN SUMMARY                                                                            PAGE 5
Traffic modelling shows the base case will be unable to cope with forecast traffic flows, exacerbating congestion and heightening safety risks for both freight and commuter traffic. The two largest congestion points on the motorway (Palm Beach Avenue in the morning and Bermuda Street in the evening) will remain the same in 2026 as in 2016. However, queues begin earlier, dissipate later and affect longer portions of the motorway, as regional population and employment growth increase traffic demand. By 2026, morning peak-hour congestion lasts until 11 am instead of 9 am and trips through the 10-kilometre stretch take 15 minutes longer than in 2016. By 2041, peak-hour is not expected to end until 1pm and trips take twice as long as in 2016. 5 Reference project The key features of the reference project include: ▪ six lanes full construction of the M1 between Varsity Lakes and Tugun, including auxiliary lanes between the majority of interchanges ▪ overall improved geometric alignments, sight distances and ramp lengths ▪ motorway realignment of tight horizontal curves between Burleigh and Tallebudgera ▪ upgrade of Varsity Lakes, Burleigh, Tallebudgera and Palm Beach interchanges, including replacement of the Reedy Creek flyover and a new flyover at Bermuda Street ▪ relocation of Sarawak Avenue exit ramp through the provision of a southbound collector road between Palm Beach Avenue and Sarawak Avenue ▪ new bridge overpass at Nineteenth Avenue to accommodate future heavy rail requirements ▪ entry ramp upgrades between Nerang and Tugun to provide improved ramp storage for ramp metering ▪ managed motorways between Nerang and Tugun including ramp metering, variable speed limit (VSL) and variable message signs ▪ new service road between Tallebudgera and Palm Beach interchanges including a crossing of Tallebudgera Creek and a connection to Tsipura Drive ▪ cycle facilities at interchanges and along service roads to improve cycle connectivity ▪ two fauna crossings. 6 Methodology Traffic modelling outputs were used as inputs for the economic analysis. Generated traffic modelling outputs for car, light commercial vehicles and heavy commercial vehicles included number of trips, vehicle kilometres travelled, vehicle hours travelled, average speeds and average trip length. Following the application of parameter values to calculate benefits and account for real increases, the benefit and cost streams were discounted to present day values to calculate key economic indicators, including net present value (NPV), benefit cost ratio (BCR), internal rate of return and first year rate of return. The CBA was completed using the assumptions shown in Table 1. VARSITY LAKES TO TUGUN SUMMARY PAGE 6
Table 1      Cost benefit analysis assumptions
 ASSUMPTION             ADOPTED ASSUMPTION                   SOURCE AND COMMENTS
 Real discount rate     Seven per cent (real) as central     Infrastructure Australia (2018) and BCDF
                        case
                        Four per cent and 10 per cent
                        (real) as sensitivity tests
 Base price year        June 2018                            Latest ABS price index data was June 2018. Parameters
                                                             in earlier price years were inflated to June 2018 dollars
                                                             based on the Consumer Price Index or change in
                                                             Average Weekly Earnings, where appropriate.
 Construction period    June 2019—December 2023              TMR
                        (benefits accruing from July 2024)
 Appraisal period       June 2018—June 2054                  Infrastructure Australia (2018), ATAP – T2 (2016)
                                                             Commences in FY2017–18 and extends to 30 years from
                                                             the opening date of the reference project
 Residual value         Assumed to be zero for reference     Reference project contains bridge infrastructure that
                        project and base case                would have a useful life longer than the appraisal
                                                             period. However, the inclusion of a residual value
                                                             assumes that the bridge is entirely rehabilitated (or
                                                             new) following construction. As the VL2T Project is
                                                             focused on road widening, some bridges included in
                                                             reference project will have a lesser remaining asset life,
                                                             resulting in a lower residual value. It has therefore
                                                             conservatively been assumed that reference project has
                                                             no residual value, as information around the proportion
                                                             of fully rehabilitated versus partially rehabilitated
                                                             bridges is unavailable
 Demand                 350 (car); 312 (LGV); 302 (HGV);     TMR TARS Classified Traffic Counts – 2013 to 2016 and
 annualisation factor   285.6 (PT passenger)                 ATAP – M1 (2018)
                        Sensitivity tests were also
                        conducted for 260, 290 and 330.

7            Demand forecasts
Transport modelling has been undertaken to understand how the reference project will affect travel
behaviours and outcomes and provided the evidence base for quantifying benefits. Two models were used:
▪ Zenith Strategic Model for M1—a strategic model used to represent area-wide, multimodal travel.
▪ Zenith Dynamic Traffic Assessment Model—a corridor-level dynamic traffic assignment model used to
  represent vehicle queuing in more detail.
Two behavioural response scenarios were modelled—a fixed trip matrix which only allows for changes in
route choice in both models, and a variable trip matrix via the strategic model which allows for changes in
route, mode and destination. For the reference project, allowing for changes in route choice only (i.e. the
fixed trip matrix) would overstate the benefits by holding constant several behavioural responses that tend
to reduce travel-time savings (e.g. people choosing to travel further, adding to road congestion). In contrast,
the variable trip matrix understates benefits because it assumes substantial behavioural responses will occur
immediately after the reference project opens.

VARSITY LAKES TO TUGUN SUMMARY                                                                                   PAGE 7
To capture changes in behavioural response for the reference project over time, the CBA relies upon benefits
associated with a ‘blended’ scenario, which assumes a transition from the fixed trip matrix to the variable
trip matrix over a 10-year period, commencing from the first year after the reference project opens.
8 Profile of capital, operating/maintenance costs
The economic costs of delivering and maintaining the reference project (capital and operating costs) are
included in the CBA. All costs have been estimated incremental to the base case and are expressed in real
June 2018 dollars. In keeping with the application of real effects only, project costs include only real price
escalation. Economic capital costs including planning, design, construction and client and construction
contingencies have been used as the central case for the economic assessment (Table 2). Costs incurred
before the start of the appraisal period (sunk costs) are excluded.
Table 2 Project capital cost estimate
CAPITAL COSTS1 ($ JUNE 2018, MILLIONS, UNDISCOUNTED)
2018–19 2019–20 2020–21 2021–22 2022–23 2023–24 TOTAL
(UNDISCOUNTED)
P50 61.2 119.8 214.9 236.4 186.1 65.5 883.9
P90 61.2 119.8 214.9 236.4 186.1 114.9 933.3
1
As used in the economic analysis, cashflow allows for P50 risk to be spread during the scoping, development and delivery phases and then the
difference between P50 and P90 risk quantum in the year after delivery.
Operating and maintenance costs include all labour, machinery and materials for routine, periodic and
rehabilitation maintenance required to maintain and preserve the reference project. Ongoing operating and
maintenance costs have been included from the first full year of operations (immediately after construction
finishes) to the end of the evaluation period of 30 years.
Quantified operating costs for this economic assessment are structural maintenance and rehabilitation costs
relative to the base case. Annual lighting and delineation costs have been conservatively assumed to remain
the same between the Base Case and reference project. The incremental cost of other maintenance items
(e.g. corridor management—environment and road safety, intelligent transport systems (ITS) and traffic
operations) have been assumed to not vary significantly between the base case and reference project.
Operating costs for the reference project, relative to the base case, are summarised in in Table 3.
Table 3 Operating and maintenance costs
OPERATING AND MAINTENANCE COSTS INCREMENTAL TO BASE CASE ($ MARCH 2018 MILLIONS, UNDISCOUNTED)
AVERAGE ANNUAL TOTAL EXPENDITURE | 30 YEAR
EXPENDITURE (UNDISCOUNTED) APPRAISAL PERIOD
Routine maintenance 0.9 33.1
Rehabilitation 0.6 22.5
ITS operating costs 0.7 27.8
Total 2.2 83.4
VARSITY LAKES TO TUGUN SUMMARY PAGE 89 Project benefits The primary focus of the reference project is improving direct transport outcomes for users of the network. This focus is reflected in the project objective of a transport corridor that improves travel times, reliability and safety and optimises efficiency. Alongside these primary outcomes and associated benefits, the reference project is also expected to generate a number of non-user benefits. Targeted and monetised benefits are: ▪ direct benefits to users—travel time savings, reduced vehicle operating costs and improvements in travel time reliability and safety for private vehicle users, commercial vehicles and public transport passengers as well as improvements in public transport amenity ▪ benefits to South East Queensland—improvements to externalities ▪ benefits to government—increases in government revenue (i.e. excise and GST on fuel, and farebox revenue) ▪ wider economic benefits—economic gains that arise from relaxing some of the assumptions in conventional CBA, such as that all markets are perfectly competitive. Wider economic benefits estimate the impact on markets and economic sectors beyond the direct user impacts and ‘external’ impacts conventionally measured in CBA. Benefits for the reference project are summarised in in Table 4. Table 4 Project benefits ECONOMIC BENEFITS ($ JUNE 2018 MILLIONS, REAL, PRESENT VALUES DISCOUNTED AT 7%) ($ M) Road user benefits 1,076.2 Public Transport user benefits 41.9 Changes in Government revenue -12.3 Unperceived impacts of changes in user behaviour -61.7 Externalities 4.3 Total 1,048.4 Travel time reliability 82.3 Wider economic benefits (excluded from BCR Results) 74.8 10 Cost benefit analysis results The results of the cost benefit analysis for the reference project are presented in Table 5. Monetised costs and benefits were discounted to present value terms using a real discount rate of 7 per cent per annum. VARSITY LAKES TO TUGUN SUMMARY PAGE 9
Table 5          Project result table
 CBA RESULTS ($ JUNE 2018 MILLIONS1, REAL, PRESENT VALUES DISCOUNTED    REFERENCE          % OF TOTAL
 AT 7%)                                                                PROJECT ($M)

 PROJECT COSTS (P90 ESTIMATES)                                            629.0              100%
 Project costs                                                            615.4               98%
 Operating and maintenance costs                                           13.6               2%
 TOTAL PROJECT BENEFITS                                                  1,048.4             100%
 User benefits (consumer surplus)                                        1,118.0             107%
 Car users                                                                927.4               88%
 Travel time savings | personal                                           613.3               58%
 Travel time savings | business                                           120.2               11%
 Fuel consumption benefits                                                193.9               18%
 Light goods vehicles                                                      43.8               4%
 Travel time savings                                                       35.1               3%
 Fuel consumption benefits                                                 8.7                1%
 Heavy goods vehicles                                                     105.0               10%
 Travel time savings                                                       78.7               8%
 Fuel consumption benefits                                                 26.2               2%
 Public transport user benefits                                            41.9               4%
                                2
 Trip time savings | personal                                              33.3               3%
 Trip time savings | business2                                             12.3               1%
 Station amenity improvements | Personal                                   -1.3               0%
 Station amenity improvements | Business                                   -2.5               0%
 Savings in public transport fares                                         0.1                0%
 Consumer surplus as reflected in                                         -12.3               -1%
 Additional government revenue from excise and GST on fuel                -12.1               -1%
 Additional public transport fare revenue collected                        -0.2               0%
 Unperceived impacts of changes in user behaviour                         -61.7               -6%
 Changes in vehicle operating costs (excl. fuel) | car                    -70.6               -7%
 Changes in vehicle operating costs (excl. fuel) | LGV                     -1.3               0%
 Changes in vehicle operating costs (excl. fuel) | HGV                     12.0               1%
 Crash cost savings                                                        -1.7               0%
 Externalities                                                             4.3                0%
 Reduced emissions                                                         4.3                0%
 Benefit cost ratio                                                                1.67
 Net present value                                                                 $419M
 Internal rate of return                                                           11.8%

VARSITY LAKES TO TUGUN SUMMARY                                                                  PAGE 10
CBA RESULTS ($ JUNE 2018 MILLIONS1, REAL, PRESENT VALUES DISCOUNTED REFERENCE % OF TOTAL
AT 7%) PROJECT ($M)
First year rate of return 9.7%
Productivity benefits $413M
BENEFITS EXCLUDED FROM BCR RESULTS 157.1 100%
Travel time reliability 82.3 52%
Travel time reliability improvements | car 74.4 47%
Travel time reliability improvements | LGV 3.4 2%
Travel time reliability improvements | HGV 4.5 3%
Wider economic benefits 74.8 48%
WEB1 | Agglomeration economies 57.1 36%
WEB 2 | Output change in imperfectly competitive markets 14.4 9%
WEB 3 | Tax revenues from labour market impacts 3.3 2%
(1) Results estimated incremental to the base case, discounted over the period appraisal period (June 2018 to September 2054).
Benefits held constant post last modelled year (2041).
(2) Includes car and walk access, waiting and transfer time savings.
11 Sensitivity analysis
CBA results are based on best estimates of costs and benefits. The robustness of the economic analysis
results was assessed through a series of sensitivity tests, including all of those suggested by Infrastructure
Australia’s Assessment Framework (2018) plus others considered relevant. Under the discount rate
sensitivity tests, the BCR increases to 2.6 when a four per cent discount rate is used and declines to 1.1 at a
10 per cent discount rate.
The internal rate of return is the minimum discount rate at which the initiative is viable in economic terms.
The observed internal rate of return of 11.8 per cent indicates the reference project will return a positive
NPV for all discount rates below this rate. The sensitivity analysis for the reference project is summarised in
Table 6.
Table 6 Sensitivity analysis
SENSITIVITY TEST BCR
Reference project 1.67
DISCOUNT RATE
4% 2.6
10% 1.1
PROJECT COST
P50 costs 1.7
+20% costs 1.4
-20% costs 2.1
PROJECT BENEFITS
+20% benefits 2.0
VARSITY LAKES TO TUGUN SUMMARY PAGE 11SENSITIVITY TEST BCR - 20% benefits 1.3 BEST CASE SCENARIO +20% benefits and -20% costs 2.5 WORST CASE SCENARIO -20% benefits and +20% costs 1.1 ANNUALISATION FACTOR Road user annualisation factor of 260 1.3 Road user annualisation factor of 290 1.4 Road user annualisation factor of 330 1.6 ADDITIONAL BENEFITS Including wider economic benefits and reliability benefits 1.9 12 Other considerations Assumed proposal completion times Assuming design activities can commence in January 2019, construction on the VL2T Project could be completed by December 2023. Wider economic impact assessment Wider economic benefits reflect economic gains that arise from relaxing some of the assumptions in conventional CBA, such as that all markets are perfectly competitive. Wider economic benefits complement the direct user impacts (and externality benefits) measured elsewhere in CBA. Three main categories of wider economic benefits are relevant to transport initiatives: ▪ Agglomeration economies (WEB1) ▪ Output change in imperfectly competitive markets (WEB2) ▪ Tax revenues from labour supply impacts (WEB3) Under Infrastructure Australia’s Assessment Framework (2018), and consistent with all local and international guidance, wider economic benefits are not included in the central case BCR calculation. These results are summarised in Table 7. Table 7 Wider project economic impacts WIDER ECONOMIC IMPACT CBA RESULTS Productivity gains (GSP) $413 million Wider economic benefits $74.8 million VARSITY LAKES TO TUGUN SUMMARY PAGE 12
You can also read