The Enhanced Frequency Control Capability (EFCC) Network Innovation Competition Project - National Grid ESO
←
→
Page content transcription
If your browser does not render page correctly, please read the page content below

The Enhanced Frequency Control Capability (EFCC)
Network Innovation Competition Project

Cost Benefit Analysis – Initial Results
25th September 2018

box.EFCC@nationalgrid.com

Contents

    1   Project Overview                  3 - 10
    2   Cost Benefits Analysis Results   11 - 42
    3   Next Steps                       43 - 44

2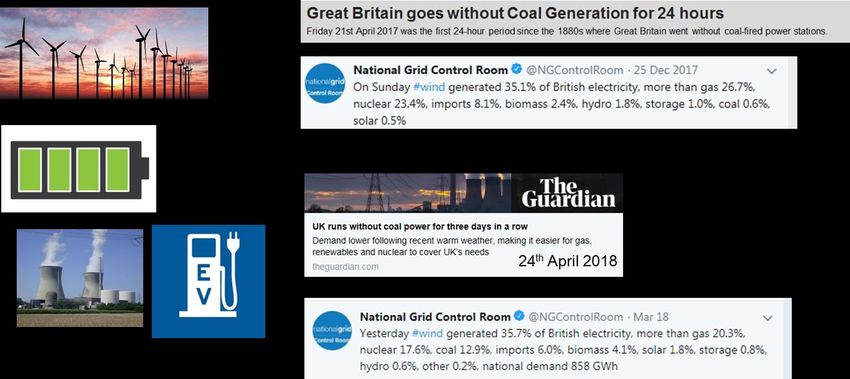
Project Overview
EFCC – the future of frequency control
The EFCC project
▪ Three year, £8.5 million project network innovation competition project which started in
  2015
▪ Working alongside eight industry and academic partners
Project background
▪ Changes to energy landscape have identified potential future system operability
  challenges.
▪ Project focus on one of these challenges; reduction in system inertia, which results in
  more volatile system frequency.
The solution
▪ Provision of rapid frequency response from a diverse range of technologies, to assist with
  frequency management.
▪ Underpinned by a monitoring and control system (MCS) that facilitates the coordination
  of, and maximises the contribution from resource providers.
▪ Project has focused on the development and testing of the MCS and commercial trials of
  fast frequency response (target 500ms).

4

The energy landscape is changing

5

How can EFCC resolve the system operability
challenges?

                                                                  Regional vs National
                                  Rate of Change of
    Reduction in system                                           Frequency: frequency
                                  Frequency (RoCoF) is
    inertia, making system                                        differs across the system
                                  increasing, faster response
    frequency more volatile                                       immediately after an
                                  capability is required
                                                                  event

    ▪   System inertia is the    ▪    RoCoF depends on the       ▪    Requires proportional
        aggregated inertia of         total amount of energy          response to frequency
        all rotating machines         stored in the rotating          events
        that are coupled to           masses which are
        the system                    synchronised to the
    ▪   Frequency is more             system
        volatile when system     ▪    Reducing system inertia
        inertia is low                requires faster delivery
                                      of response

        EFCC Project: what are the potential system benefits from accessing and instructing
              faster response to frequency disturbances in a proportional manner?

6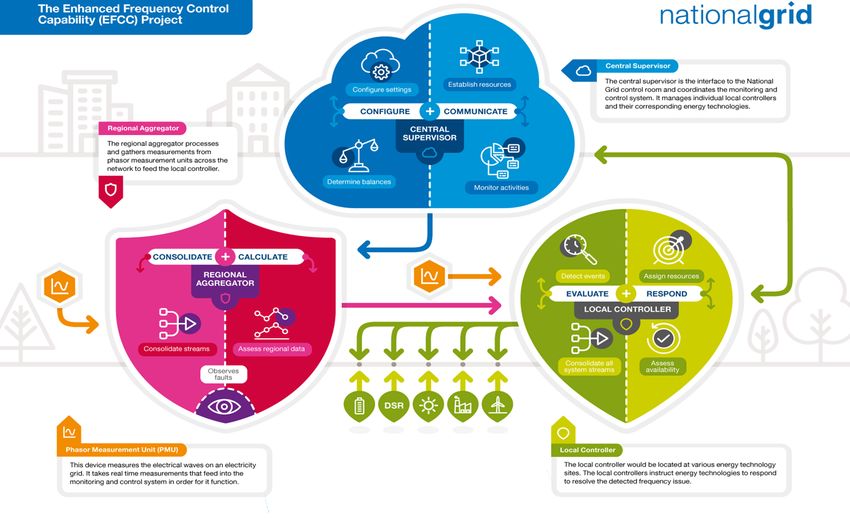
Falling system inertia results in faster Rate of Change of
Frequency (RoCoF)
                                        Operating with low system
                                        inertia: RoCoF relay changes
                                        and predicted reduction in
                                        synchronous generation
                                        resulting in reduced levels of
                                        system inertia (unconstrained
                                        system)

                                        Frequency Containment: will
                                        become more challenging as
                                        RoCoF increases with the
                                        ability to respond faster
                                        required in the next 3-5 years

                                        Regional vs National
                                        Frequency: when responding
                                        faster to an event (1-2 secs),
                                        system frequency differs
                                        across the network, requiring
                                        proportional response

7
with divergence & increased unpredictability in system
frequency movement across the network

                                      Event detection: ability to
                                      accurately identify events
                                      within faster timescales

                                      Verification of Event: faster
                                      event detection requires
                                      accurate measurement

                                      Faster Response: required to
                                      ‘catch’ frequency immediately
                                      after the event

                                      Targeted and Proportional:
                                      accurate deployment required
                                      to avoid unintentional system
                                      consequences

8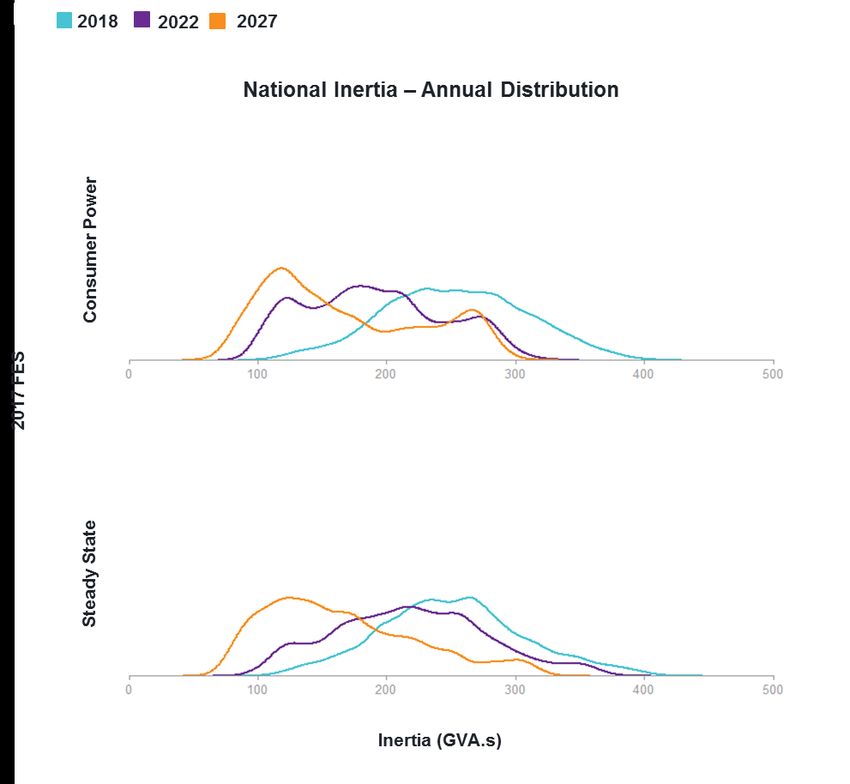
The MCS detects and verifies frequency events, providing
a targeted, proportional response

9
What is the system benefit of faster frequency response
when coupled with the MCS?

     Ability to run the        The MCS is a delivery            What is the system value
     electricity system with   mechanism for                    of faster frequency
     increasing volumes of     managing faster                  response coupled with
     non-synchronous           frequency response               MCS?
     generation
                               Utilising full capability from   The ability to access and
     Managing the system to    resource providers,              coordinate within quicker
     faster RoCoF which has    coordinating the output to       timeframes
     regional variation        meet the response profile

10
Cost Benefit Analysis
EFCC project CBA
CBA results – progress update

EFCC webinar
25 September 2018

Copyright © Baringa Partners LLP 2018. All rights reserved. This document is subject to contract and contains confidential and proprietary information.
Agenda

                                                                               Description
                                                                               What are we trying to achieve, what it our approach and what are the key
  Analysis overview
                                                                               elements of the CBA?
                                                                               How have we modelled inertia constraints, RoCoF and generator groupings?
  Modelling assumptions
                                                                               How have we used Plexos to model EFCC?
  Worked example of EFCC                                                       How will EFCC work in theory and in practice? What’s the interaction with
  response                                                                     traditional response services and timeframes?
                                                                               What have we assumed about the EFCC roll-out assumptions for each
  Roll-out profile assumptions
                                                                               technology?
                                                                               What are the high level benefits of EFCC? How are the benefits generated?
  High level CBA results
                                                                               What are the costs and the total NPV and breakeven date for EFCC?
  Further results and analysis                                                 How does inertia distribution change between each scenario and model run?

Copyright © Baringa Partners LLP 2018. All rights reserved. This document is subject to contract and contains confidential and proprietary information.
                                                                                                                                                           13
Summary
Baringa are developing cost and benefits analysis (CBA) of the EFCC innovation project. This slide
pack provides an overview of the Baringa’s approach, our CBA design, work to date and next steps.
What are the expected benefits of EFCC?
EFCC will give National Grid the tools to accommodate a faster RoCoF, reducing system re-dispatch costs and reducing the overall reserve
provision required to manage the system.
Wider benefits may also expected from a possible reduction in carbon intensity of the GB system.
How are Baringa helping and how will the CBA be
used?
Baringa has developed an economic model to calculate the economic benefits of the EFCC project.
The CBA will identify the distribution of potential benefits from domestic and cross-border re-dispatch, changes to curtailment, and changes
to carbon intensity of the generation mix in GB
The CBA will be used by:
– National Grid to consider the potential costs/savings for future response strategy
– EFCC Project Partners and wider industry to show the value of EFCC capabilities as the system evolves
What have we done so far?
Used National Grid’s FES assumptions (Steady State and Consumer Power) to build a model of the GB market in Baringa’s Plexos model
Developed a set of results to show the impact of a move to faster RoCoF, and the impact on system dispatch costs
Taken simplified response assumptions from Project Partners to understand the response from the EFCC technologies
Developed an approach to model the impact of EFCC on response holding volumes for primary, secondary and high, as well as a 0.5 second
stylised EFCC response
Copyright © Baringa Partners LLP 2018. All rights reserved. This document is subject to contract and contains confidential and proprietary information.
14High level costs and benefits of EFCC
There are a range of possible benefits and costs from EFCC. These costs and benefits will be
distributed amongst new and existing market participants, and consumers.
EFCC expected benefits EFCC expected costs
1. Faster RoCoF = Reduction in system actions & 1. EFCC investment costs (i.e. the cost of
costs innovation to develop the project)
2. Higher EFCC response potential = potential 2. Estimated costs of investment needed in
impact in holding volumes and costs existing GB generation fleet to accommodate
3. Carbon savings from constraining on thermal faster RoCoF (i.e. RoCoF based relays)
plant less as a result of enabling faster RoCoF 3. Ongoing opex
4. Response holding costs
EFCC distributional impacts
Some redistribution of revenue from the
provision of response services from ‘traditional’
to ‘EFCC’ providers
Impact on consumers – net benefit/cost feeds
through to BSUoS (for example)
Copyright © Baringa Partners LLP 2018. All rights reserved. This document is subject to contract and contains confidential and proprietary information.
15Overview of Baringa’s CBA approach
The CBA includes a counterfactual model run and a ‘test case’ to show the impact of a change in
RoCoF limits and the introduction of EFCC
1
Replicate FES Steady State and
Consumers Power in Baringa’s
in-house dispatch model
2019-2028
Traditional
MFR and
FFR Counterfactual EFCC impact “test case” Sunk Costs
providers
of Primary,
2 5
Secondary Run Baringa model with
and High existing RoCoF constraint Re-run the analysis
response and traditional response allowing faster RoCoF
providers 8
3 6 Costs of installing
Calculate cost of system Calculate change in system and maintaining
Move to 0.2
actions required to meet the actions required to meet EFCC (for NG and
Hz/s in
current RoCoF constraint ∆ in faster RoCoF industry)
2021
total
4 system 7 Subtracted
costs = Calculate the response from benefit
Calculate response holding
market holding requirements with to reveal total
requirements
EFCC capabilities net effect
impact
of EFCC
Move to 1
Hz/s in
2021
Copyright © Baringa Partners LLP 2018. All rights reserved. This document is subject to contract and contains confidential and proprietary information.
16Modelling assumptions
Copyright © Baringa Partners LLP 2018. All rights reserved. This document is subject to contract and contains confidential and proprietary information.
17RoCoF and inertia modelling
The RoCoF and inertia modelling optimises largest infeed re-dispatch actions to manage the
system within the required RoCoF limit
RoCoF assumptions
The fast response from EFCC is a system enabler, allowing the system to operate at a faster RoCoF.
The main EFCC benefit in the CBA is derived from enabling this RoCoF limit change, and the resulting benefit from reduced system actions. The RoCoF
limits used in the modeling are shown in the table below.
Without EFCC, we With EFCC, we assume
assume the system can the system can manage
manage a 0.2Hz/s a 1Hz/s RoCoF
RoCoF
RoCoF limit (Hz/s) 2019 2020 2021 2022 2023 2024 2025 2026 2027 2028
Counterfactual 0.125 0.125 0.200 0.200 0.200 0.200 0.200 0.200 0.200 0.200
Factual-EFCC case 0.125 0.125 1.000 1.000 1.000 1.000 1.000 1.000 1.000 1.000
Interconnector assumptions Generator groupings
Interconnectors are commonly the largest infeed on the system, and The RoCoF modelling takes into account the impact of generator
therefore constraining down flows on interconnectors is a key tool transmission connection groupings and the impact this has on the
for managing RoCoF. largest infeed (i.e. the extent to which a credible loss on the
transmission system could result in a RoCoF event exceeding the
To simulate this, we first model an unconstrained market to calculate
RoCoF limit).
the cross-border flows for each hour (i.e. based on economic
dispatch). Then, we use these unconstrained market results to set The Baringa model takes into account the local RoCoF groups
the interconnector flows for the constrained market run (i.e. identified by National Grid in ‘The Statement of the Constraint Cost
applying the RoCoF constraints). Target Modelling Methodology’ (Immingham, Saltend, Seabank and
South Humber Bank).
We limit the re-dispatch of interconnectors for RoCoF management
to 50 % of interconnector capacity. We also assume a fixed cost of
interconnector re-dispatch of £25/MWh.
Copyright © Baringa Partners LLP 2018. All rights reserved. This document is subject to contract and contains confidential and proprietary information.
18Response modelling – response volumes
The response modelling sets the demand for each response service using regression analysis of
the relationship between demand, inertia, infeed and static response.
Counterfactual: Within the counterfactual, our model is procuring the traditional frequency services:
Primary (Max delivery by 10s after the event).
Secondary (Max delivery by 30s after the event).
Primary, Secondary, High
High (Max delivery by 10s after the event).
Regression analysis: To calculate response holding volumes we derived a relationships between demand, inertia, largest loss and
static volume
This regression analysis provided coefficients for each variable which we have used in our model to calculate the required
response holding requirements for each hour
In-feed/ex-
Response Demand Inertia
feed loss
Copyright © Baringa Partners LLP 2018. All rights reserved. This document is subject to contract and contains confidential and proprietary information.
19Response modelling – response volumes
The response modelling sets the demand for each response service using regression analysis of
the relationship between demand, inertia, infeed and static response.
We conducted this CBA on the understanding that a faster-acting form of frequency containment is required to manage a system
with a faster RoCoF.
For modelling purposes, we assume that this faster acting form of frequency containment is provided within 0.5 seconds. This is a
modelling simplification. We understand alternative services can also deliver valuable response and forms part of the scope of the
EFCC analysis. The team at National Grid are considering all these options.
EFCC ‘factual’ modelling:
The modelled EFCC technology response is based on max delivery by 0.5s after the event.
Modelled EFCC response
The EFCC response requirement is a function of the largest infeed, with our current assumptions that EFCC volume will equal
1 x LIFL
Economic choice: If it is more economic to sustain an EFCC response into the traditional frequency service timeframes, then the
model will choose to hold EFCC over current ‘traditional’ providers.
Plexos calculates the response holding provisions from each of the technologies included in the EFCC analysis, taking into account:
The economic market dispatch (where applicable)
Availability of response in each hour (accounting for wind speed, solar irradiation profiles, system inertia constraints,
outages).
Low and high response: In the low response service, Plexos will either use available headroom to count towards response or
deload generation where required to ensure response holding requirements are met each half-hour. The opposite is true for high
response.
Modelled
In-feed/ex-
EFCC
feed loss
Response
Copyright © Baringa Partners LLP 2018. All rights reserved. This document is subject to contract and contains confidential and proprietary information.
20Worked example #1 – Normal conditions
Under normal conditions, and with high levels of inertia, a frequency is contained from dipping
past 49.5Hz with traditional Primary and Secondary response
Primary response responds quickly Secondary response kicks in with
with full output by 10 seconds full output by 30 seconds
Copyright © Baringa Partners LLP 2018. All rights reserved. This document is subject to contract and contains confidential and proprietary information.
21Worked example #2 – Low inertia
With low inertia, the frequency drop cannot be contained by the traditional services as response
times are not fast enough. Frequency falls below 49.5Hz in the 2s window before services kick in
Primary response responds quickly
with full output by 10 seconds
Secondary response kicks in with
full output by 30 seconds
Copyright © Baringa Partners LLP 2018. All rights reserved. This document is subject to contract and contains confidential and proprietary information.
22Worked example #3 – With EFCC
With EFCC, the very fast response is able to contain the frequency change in the 0.5 second
timeframe, even with low inertia, buying time for the traditional Primary and Secondary services
to kick-in.
30s response
10s response
response
0.5s
Copyright © Baringa Partners LLP 2018. All rights reserved. This document is subject to contract and contains confidential and proprietary information.
23Roll-out assumptions
Copyright © Baringa Partners LLP 2018. All rights reserved. This document is subject to contract and contains confidential and proprietary information.
24Roll-out profile – explanatory slide
This slide provides an example of the response and EFCC assumptions presented in the remainder
of this section. All of the assumptions are based on 2017 data.
Example roll-out – to explain the assumptions slides
Total capacity taken from the
FES for all technologies De-load: maximum volume the generator can reduce
output to offer response service (no change over time)
Counterfactual De-load Response Response:
Proportion of de-load
Low response 45% 100% that counts towards
High response 0% 100% response provision at
each timeframe (i.e.
10 and 30s)
EFCC De-load Response
EFCC boost (low) 0% 1.5% We assume an EFCC
boost for onshore
EFCC (low) 45% 10% and offshore wind
only, with a small
EFCC (high) 0% 10% response at 0.5s
The de-load and potential response approach is the
Response capability is the MW of total The EFCC response capability is the
same for traditional response and EFCC. For EFCC we
capacity assumed to be able to offer MW of total capacity that can offer
show the assumed response from each technology at
traditional response (primary, EFCC capability (i.e. some response at
0.5s
secondary and high) 0.5s)
The EFCC assumptions are combined with the
The actual response provided by each The actual EFCC response will be a
counterfactual/traditional response assumptions in the
technology will be a function of the function of this assumption and the
EFCC case (i.e. EFCC is additional to traditional
response capability, and the assumed assumed EFCC response (shown in the
response)
service response (shown in the pink blue table)
table)
Copyright © Baringa Partners LLP 2018. All rights reserved. This document is subject to contract and contains confidential and proprietary information.
25Response and EFCC roll-out profiles: Offshore wind
The roll-out profiles are technology specific and show the volume of capacity assumed to be able
to provide P/S/H and EFCC response from 2019-2028
Offshore wind
Counterfactual De-load Response
Low response 45% 100%
High response 0% 100%
EFCC De-load Response
EFCC boost (low 0% 1.5%
EFCC (low) 45% 10%
EFCC (high) 0% 10%
In the counterfactual we assume that 100% of offshore wind will provide response (Primary, Secondary and High) as part of mandatory
service from 2019. To replicate current commercial arrangements, we assume that onshore and offshore wind can only provide high
response if the generator is de-loaded to provide Primary and Secondary response.
This assumption is maintained for new offshore wind investment throughout the time horizon.
The EFCC deployment assumptions are based on a steady roll-out of 5% of installed capacity per year between 2019 and 2023, then
maintained at 25% thereafter
EFCC response capability is set at 10% at 0.5 seconds, with additional value assumed from EFCC boost capability (1.5% at 0.5 seconds)
Copyright © Baringa Partners LLP 2018. All rights reserved. This document is subject to contract and contains confidential and proprietary information.
26Response and EFCC roll-out profiles: Onshore wind
The roll-out profiles are technology specific and show the volume of capacity assumed to be able
to provide P/S/H and EFCC response from 2019-2028
Onshore wind
Counterfactual De-load Response
Low response 45% 100%
High response 0% 100%
EFCC De-load Response
EFCC boost (low 0% 1.5%
EFCC (low) 45% 10%
EFCC (high) 0% 10%
In the counterfactual, onshore wind greater than 10MW is required to offer mandatory response under the grid code
We have applied the ratio of wind capacity >10MW/total capacity in 2017 to each modelled year to show the counterfactual onshore
wind response capacity (equal to 63% of total capacity)
We assume that for EFCC, onshore wind can provide the same response as offshore wind
Onshore and offshore roll-out profiles are aligned, with 5% conversion per year from 2019 to 2023, then maintained at 25% of total
capacity each year thereafter
Copyright © Baringa Partners LLP 2018. All rights reserved. This document is subject to contract and contains confidential and proprietary information.
27Response and EFCC roll-out profiles: Solar
The roll-out profiles are technology specific and show the volume of capacity assumed to be able
to provide P/S/H and EFCC response from 2019-2028
Solar
Counterfactual De-load Response
Low response 100% 100%
High response 0% 100%
EFCC De-load Response
EFCC (low) 100% 12%
EFCC (high) 0% 12%
In the counterfactual, solar generators greater than 10MW are required to offer mandatory response under the grid code
We have applied the ratio of solar capacity >10MW/total capacity in 2017 to each modelled year to show the counterfactual solar
response capacity (equal to 37.5% of total capacity)
We use the assumption that solar deployment could start at 10% of installed capacity, rising to 25% by 2023 then remaining flat through
to 2028
Copyright © Baringa Partners LLP 2018. All rights reserved. This document is subject to contract and contains confidential and proprietary information.
28Response and EFCC roll-out profiles: Batteries
The roll-out profiles are technology specific and show the volume of capacity assumed to be able
to provide P/S/H and EFCC response from 2019-2028
Batteries
Counterfactual De-load Response
Low response 100% 100%
High response 0% 100%
EFCC De-load Response
EFCC (low) 100% 100%
EFCC (high) 0% 100%
We assume that the battery capacity providing response in 2019 is the current FFR market size (600MW) plus 30% of the total market in
2019 is retrofitted to providing response
This reflects the fact that not all batteries will be operating in response mode in 2019 (also taking arbitrage strategies)
Between 2020 and 2028, we assume that the volume of new batteries providing response will rise from 30-50%
In total, combining the existing 600MW and new batter assumptions, we assume that 54% of total battery capacity in 2019 provides
response services, rising to 70% by 2028
We assume that most, but not all of the batteries providing response will also provide EFCC. Battery capacity providing EFCC start at 35%
of total installed capacity in 2019 rising to 65% in 2028.
Copyright © Baringa Partners LLP 2018. All rights reserved. This document is subject to contract and contains confidential and proprietary information.
29Response and EFCC roll-out profiles: DSR
The roll-out profiles are technology specific and show the volume of capacity assumed to be able
to provide P/S/H and EFCC response from 2019-2028
DSR
Counterfactual De-load Response
Low response 100% 100%
High response - -
EFCC De-load Response
EFCC (low) 100% 25%
EFCC (high) - -
We assume 30% of installed DSR provides response in 2019, rising to 50% by 2023 and plateauing at this level
We have applied a simplified approach to DSR EFCC provision (although noting that three separate products were investigated – static,
dynamic and inertial)
We assume 25% response as 0.5 seconds for DSR with deployment set at 10% of installed capacity in 2019 rising to 20% by 2023 and
plateauing at this level through to 2028
We note that DSR may, in some situations, provide high response at the 0.5s timeframe and will consider how to incorporate this into
further analysis
Copyright © Baringa Partners LLP 2018. All rights reserved. This document is subject to contract and contains confidential and proprietary information.
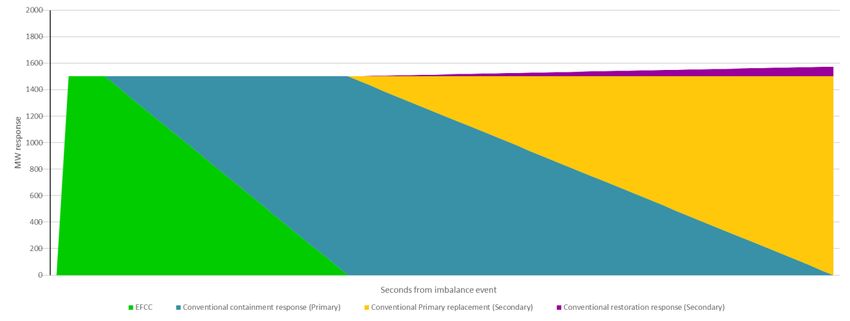
30EFCC provision by technology
Different technologies can meet the immediate EFCC requirement (assumed at 0.5s in our
modelling) and the transition to Primary and Secondary timeframes.
EFCC 0.5s response: EFCC transitional response: Traditional secondary response:
Mainly provided by batteries and Between 0.5s and the primary timeframe, In the secondary timeframe, batteries may
interconnection, with some provision CCGTs may provide transitional response continue to provide response, alongside
from DSR, wind (wind-boost) and reducing reliance on 0.5s responders traditional providers
solar
+
10s response
30s response
response
0.5s
Diagram is indicative
Traditional primary response:
Batteries may continue through the EFCC timeframe
into primary response (instead of contracting
additional/traditional primary providers).
Copyright © Baringa Partners LLP 2018. All rights reserved. This document is subject to contract and contains confidential and proprietary information.
31Modelling and results
Copyright © Baringa Partners LLP 2018. All rights reserved. This document is subject to contract and contains confidential and proprietary information.
32High level benefits summary – Steady State (1)
The benefits in Steady State are driven by renewables and interconnectors, with the step up in
2024 and 2028 driven by new interconnectors setting a higher LIFL
Steady State – total benefit Key messages
Steady State
This chart shows the total aggregate benefits from
EFCC (we consider costs later in this pack)
In this modeling set-up, EFCC enables faster RoCoF
from 2021
In early years, we apply an EFCC-choice whereby
faster RoCoF is enables in periods (months) where
there an expected benefit can be realised
This limits the benefit in early years as in some
periods, the model takes actions to reduce the largest
infeed in order to reduce the EFCC requirement (as
we model EFCC as a function of LIFL)
The EFCC requirement is met in all later years due to
increasing volume of batteries and renewables
There is a higher benefit from 2024 onwards with two
2.4 GW new interconnectors coming online
As a result, LIFL increases. Managing this LIFL is costly
in the low RoCoF run, which leads to a larger benefit
with EFCC (i.e. high RoCoF) from 2024 onwards
In 2028, another 1.4 GW interconnection comes
online, leading to further jump in benefit
Copyright © Baringa Partners LLP 2018. All rights reserved. This document is subject to contract and contains confidential and proprietary information.
33High level benefits comparison – Steady State (2)
Around two-thirds of the EFCC benefits result from a change in generation cost (re-dispatch and
LIFL actions) the remainder is largely from the reduction in carbon intensive generation
Steady State– breakdown of benefits Key messages
Total change in generation costs
The change in generation costs reflects the total
system cost change with a move to faster RoCoF
This include GB and connecting market generation
costs (including fuel, VOM, emission and start and
shut down costs), plus an assumed cost of
interconnector re-dispatch as shown below (at an
assumed cost of 25 £/MWh)
Social cost of carbon
Our modelled generation costs takes into account the
cost of carbon for each generator. Here we add in
the social cost of carbon, from the Treasury green
book to account for wider benefits to society
This only reflects the GB portion of carbon savings
(i.e. does not take into account the change in carbon
in connecting markets)
Renewable curtailment costs
At a faster RoCoF, the system can accommodate a
greater volume of renewables. This reduces the cost
or renewables curtailment, represented by a benefit
GB Total in the CBA
‘European’ IC re- Total
generation We calculate this using the change in wind and solar
costs generation dispatch generatio
generation multiplied by an assumed balancing bid
costs (+ NL, costs n cost cost (£50/MWh onshore wind, £100/MWh offshore
SEM, FR, BE, wind & solar)
NO, DK)
Copyright © Baringa Partners LLP 2018. All rights reserved. This document is subject to contract and contains confidential and proprietary information.
34High level results summary – Cost assumption
The current cost assumptions are based on NG’s assessment of EFCC costs (MCS capex and opex
along with provider costs) between 2019 and 2028
Steady State Consumer Power
Cost variant description
Transmission resource focussed scenario: Distribution resource focussed scenario:
The required volume is satisfied via fast response technologies available in For ease of illustration, based on battery provision (5MW units) managing
the FES scenarios. output at 50% state of charge. In practice could represent a broader range
Cost assumptions are based on the expected volumes of upside response of providers.
(down side not being a major issue) and the number of fast response Cost assumptions and volume requirement as per Transmission focused
providers that satisfy the volume. Each provider has a local controller scenario.
Wider National Grid MCS hardware, system monitoring equipment, Larger number of more remote located resources to meet same volume of
estimated redundancy plus maintenance and support costs have been procured capability, and estimates for a dedicated communications link to
included each provider are included.
Copyright © Baringa Partners LLP 2018. All rights reserved. This document is subject to contract and contains confidential and proprietary information.
35High level results summary – Steady State
The Steady State results show positive NPVs under both cost variants, with only a small positive
NPV under the more costly distribution-focussed as a result of battery volume costs
Steady State – Transmission resourced Steady State – Distribution resourced
Results metrics – SS, T Results metrics – SS, D
NPV (costs and benefits) £175m NPV (costs and benefits) £45m
Breakeven 2022 Breakeven 2027
Copyright © Baringa Partners LLP 2018. All rights reserved. This document is subject to contract and contains confidential and proprietary information.
36High level benefits summary – Consumer Power (1)
Benefits in the Consumer Power scenario are driven by large volumes of interconnection and
renewables – reductions in re-dispatch and LIFL actions drives a large benefits with higher RoCoF
Consumer Power – total benefits Key messages
Consumer Power
10-year NPV (benefits only) = £978m (at 3.5%)
EFCC enables faster RoCoF from 2021
EFCC requirement met in all years due to significant
volume of batteries and renewables in this scenario
Significant interconnector investment in this scenario
delivers a large, and increasing benefit from EFCC, as
the higher RoCoF significantly reduces the cost of re-
dispatch
Similarly, the large volume of renewables in this
scenario increases the impact of the move to faster
RoCoF
In particular, we see:
2022: 2.4GW
2023: 2GW
2024: 2.8GW
2026: >3GW
The 1.4GW interconnectors set LIFL in both scenarios,
with a more significant impact in Consumer Power
due to the large number of large projects
Copyright © Baringa Partners LLP 2018. All rights reserved. This document is subject to contract and contains confidential and proprietary information.
37High level benefits comparison – Consumer Power (2)
The ratio of benefits is similar between Steady State and Consumer Power, with more benefit from
a reduction renewable curtailment costs in this scenario, given renewable investment
Consumer Power – breakdown of benefits Key messages
Total change in generation costs
The change in generation costs reflects the total
system cost change with a move to faster RoCoF.
This include GB and connecting market generation
costs, plus an assumed cost of interconnector re-
dispatch (as shown below)
Social cost of carbon
Our modelled generation costs takes into account the
cost of carbon for each generator. Here we add in
the social cost of carbon, from the Treasury green
book to account for wider benefits to society
This only reflects the GB portion of carbon savings
(i.e. does not take into account the change in carbon
in connecting markets)
Renewable curtailment costs
At a faster RoCoF, the system can accommodate a
greater volume of renewables. This reduces the cost
or renewables curtailment, represented by a benefit
in the CBA.
We calculate this using the change in wind and solar
GB Total generation multiplied by an assumed balancing bid
‘European’ IC re- Total
generation cost (£50/MWh onshore wind, £100/MWh offshore
costs generation dispatch generatio
wind & solar)
costs (GB, NL, costs n cost
SEM, FR, BE,
NO, DK)
Copyright © Baringa Partners LLP 2018. All rights reserved. This document is subject to contract and contains confidential and proprietary information.
38High level results summary – Consumer Power
The higher benefits under Consumer Power, driven by renewable and interconnector assumptions,
results in a large positive NPV under both cost variants
Consumer Power – Transmission resourced Consumer Power – Distribution resourced
Results metrics – CP, T Results metrics – CP, D
NPV (costs and benefits) £953m NPV (costs and benefits) £792m
Breakeven 2021 Breakeven 2023
Copyright © Baringa Partners LLP 2018. All rights reserved. This document is subject to contract and contains confidential and proprietary information.
39Inertia distribution – Steady State
These charts show how system inertia changes over the modelling horizon in Steady State.
2021 2024
2028 The charts compare inertia in the unconstrained market run (blue), with
the Low RoCoF run (pink) and High RoCoF run (grey)
In 2021, there is very little difference between the low and high RoCoF
runs, but this does show a small increase in inertia in the Low RoCoF run
(pink line to the right)
Later on in the scenario, we see higher inertia in the Low RoCoF run as
plant is brought on for inertia to manage the low RoCoF limit
Moving to High RoCoF moves inertia back to levels closer to the
unconstrained run, as fewer actions are needed to manage system
frequency compared to the Low RoCof run
Copyright © Baringa Partners LLP 2018. All rights reserved. This document is subject to contract and contains confidential and proprietary information.
40Inertia distribution – Consumer Power
These charts show how system inertia changes over the modelling horizon in Consumer Power.
2021 2024
2028 In the Consumer Power scenario, the significant volume of renewables
results in a larger difference in inertia distribution between the
unconstrained run and the Low RoCoF run (i.e. the system needs more
re-dispatch actions to meet the RoCoF constraint)
The modelling shows this as a greater move in the inertia distribution
curve between the unconstrained run and Low RoCoF run (compared to
Steady State)
As a result, moving to Higher RoCoF delivers a greater benefit than in the
Steady State scenario
Copyright © Baringa Partners LLP 2018. All rights reserved. This document is subject to contract and contains confidential and proprietary information.
41This report has been prepared for Baringa's client (“Client”) and has been designed to meet the agreed requirements of Client as contained in the relevant contract between Baringa and Client. It is released to Client subject to the terms of such contract and is not to be disclosed in whole or in part to third parties, altered or modified without Baringa's prior written consent. This report is not intended for general advertising, sales media, public circulation, quotation or publication except as agreed under the terms of such contract. Information provided by others (including Client) and used in the preparation of this report is believed to be reliable but has not been verified and no warranty is given by Baringa as to the accuracy of such information unless contained in such contract. Public information and industry and statistical data are from sources Baringa deems to be reliable but Baringa makes no representation as to the accuracy or completeness of such information which has been used without further verification. This report should not be regarded as suitable to be used or relied on by any party other than Client. Any party other than Client who obtains access to this report or a copy, and chooses to rely on this report (or any part of it) will do so at its own risk. To the fullest extent permitted by law, Baringa accepts no responsibility or liability in respect of this report to any other person or organisation. Copyright © Baringa Partners LLP 2018. All rights reserved.
Next Steps
Next steps for EFCC Project

Completion of         Completion of         Installation of MCS    Project learning
commercial trials     cost benefit          on the system –        into business as
                      analysis including    testing                usual activities
                      sensitivities         communications
                                            network

            Continue to share our findings and learnings with the industry

44
Thank you for listening
▪ Please send any questions to box.EFCC@nationalgrid.com
▪ Feedback on webinar welcome, please complete survey
▪ Presentation will be available on EFCC website:
www.nationalgrid.com/EFCC
45nationalgrideso.com
nationalgrideso.com
National Grid ESO, Faraday House, Warwick Technology Park,
Gallows Hill,Grid
National Warwick,
ESO, CV346DA
Faraday House, Warwick Technology Park,
Gallows Hill, Warwick, CV346DAYou can also read