The Farm Credit System - Federal Farm Credit Banks
←
→
Page content transcription
If your browser does not render page correctly, please read the page content below
The Farm Credit System
     REGINA GILL
     SVP INVESTOR RELATIONS
     FEDERAL FARM CREDIT BANKS FUNDING CORPORATION

     DECEMBER 2019

1/2/20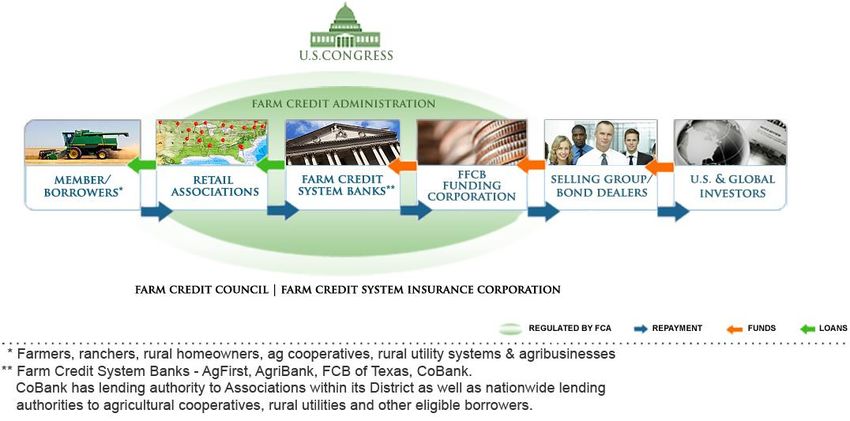
OVERVIEW OF THE SYSTEM
Created by an Act of Congress (1916)
Government Sponsored Enterprise (GSE) created to support rural communities and
agriculture with reliable, consistent credit and financial services
Network of cooperatives owned by its borrowers (farmers, ranchers, agricultural
cooperatives and rural customers)
Regulated and examined by the Farm Credit Administration (FCA), an independent agency in
the Executive Branch of the US Government
Federal Farm Credit Banks Consolidated Systemwide Debt Securities are issued to fund the
System’s loan portfolio, investments and operations
The Farm Credit System funds approximately 41% of all US farm business debt. (November 2019,
USDA ERS)
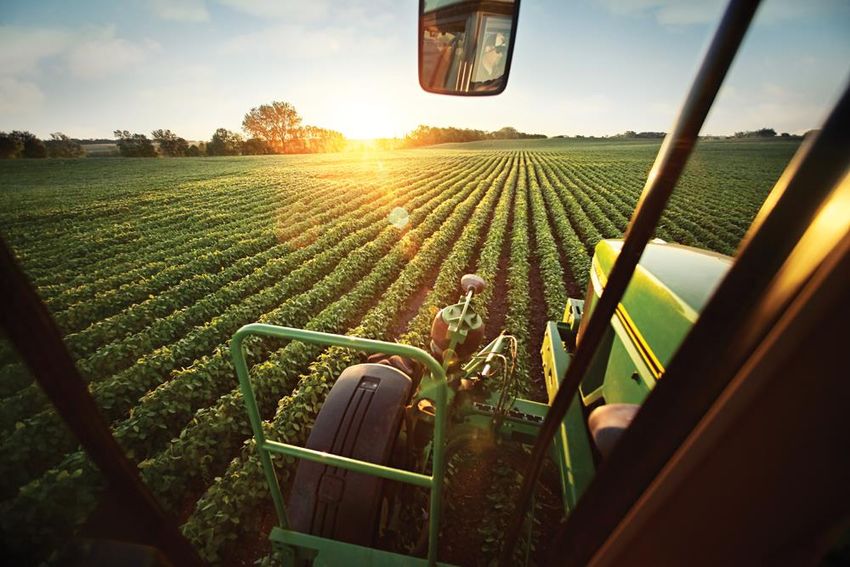
Farm Credit supports rural communities and agriculture
with reliable, consistent credit and financial services today and tomorrow.
Part of the Farm Credit System 2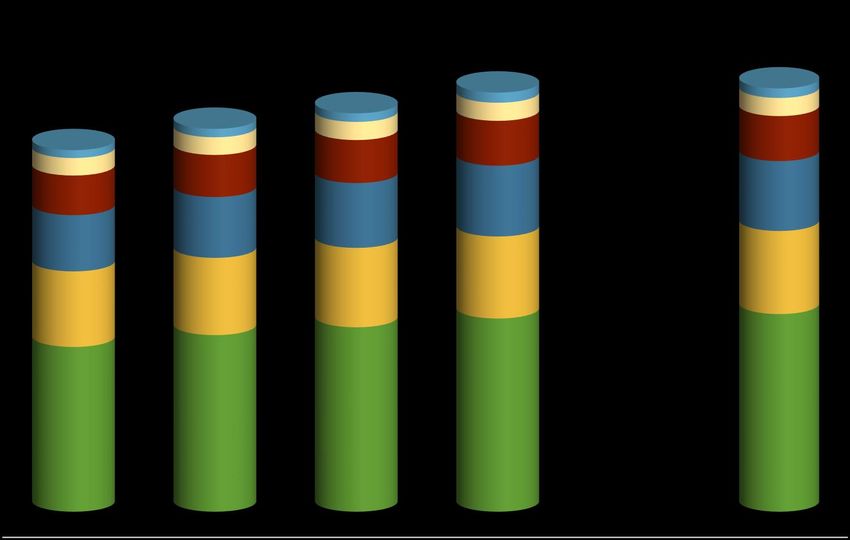
STRUCTURE/OWNERSHIP

                      Part of the Farm Credit System   3
GROSS LOANS
A variety of loan types are available to qualified borrowers
Underwriting standards are based on credit, collateral AND repayment capacity/cash flow
($($
billions)
billions) 276.1
273.4
259.9 6.2
249.8 6.6
5.6 11.8 Agricultural Export
235.9 5.5
11.8
Finance
11.8 29.3
5.1 11.5 29.2
28.0 Rural residential real
11.4 27.4 estate and other loans
25.8 46.1 45.5
42.2 Rural Infrastructure
39.6
36.6
53.4 54.1 Agribusiness loans
50.3 51.7
49.2
Production &
intermediate-term loans
Generally ag loans -
129.2 collateralized by land
115.5 120.6 126.3
107.8
1 2 /3 1 /2 0 1 5 1 2 /3 1 /2 0 1 6 1 2 /3 1 /2 0 1 7 1 2 /3 1 /2 0 1 8 9 /3 0 /2 0 1 9
Part of the Farm Credit System 4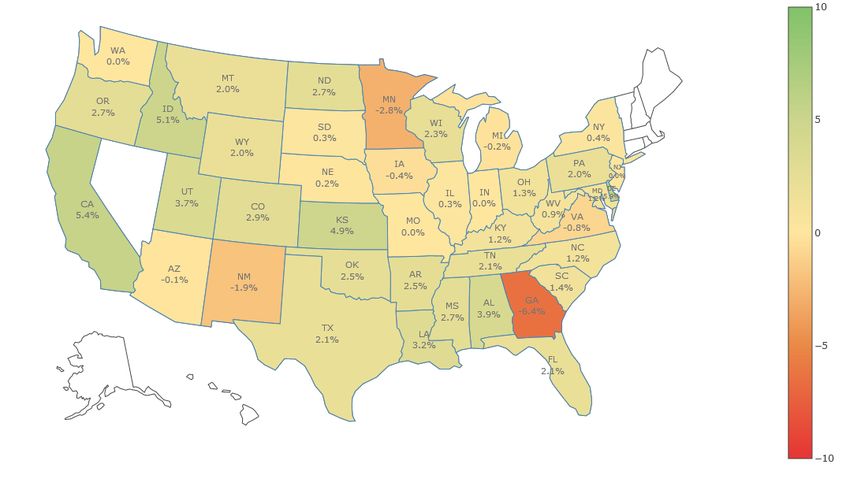
NONPERFORMING ASSETS
Nonperforming assets represented Nonperforming Assets
0.92% of the System’s loans and
OPO at 9/30/19, as compared with ($ billions)
0.83% at 12/31/18. 1.73 2.04 2.02 2.28 2.55
0.02 0.03 0.02 0.04 0.13
Nonaccrual loans represented 0.29 0.34 0.29 0.27 0.29
0.74% of the System’s loans at Accruing - 90 Days or
9/30/19, as compared with 0.69% More Past Due
at 12/31/18. Restructured Loans
1.32 1.59 1.66 1.88 2.05
Credit risk of certain loans is Nonaccrual Loans
reduced by off-farm income sources
and crop insurance.
Other Property Owned
0.10 0.08 0.05 0.08 0.08
55.8% of nonaccruals were current
as to principal and interest payment 2015 2016 2017 2018 9/30/2019
at 9/30/19, as compared with
65.3% at 12/31/18. Nonperforming Assets as a Percentage of Loans & OPO
0.73% 0.82% 0.78% 0.83% 0.92%
5%
4% Nonaccrual Loans (as a % of Total Loans)
At 9/30/2019
3%
0.74%
2%
1%
0%
Part of the Farm Credit System 5
FARM CREDIT SYSTEM LIQUIDITY
System Banks are authorized to hold highly rated investments in an amount not to exceed 35% of the Bank’s
average loans outstanding for the quarter.
Investments are generally classified as available-for-sale and carried at fair value.
FCA regulations define eligible investments: ratings, maturities, percent of portfolio.
Ineligible investments must be reported to the FCA within 15 calendar days.
As of 9/30/19, FCS liquidity position = 177 days
FCS Investments Available-For-Sale
(Fair Value at 9/30/19 by contractual maturity)
Due in 1 year Due after 1 year Due after 5 Due after 10 Weighted
($ millions) Total
or less - 5 years years - 10 years years Avg. Yield
Commercial paper, CDs, bankers’
acceptances, and other securities 6,263 372 240 0 6,875 2.47%
US Treasury securities 5,597 10,397 2,773 0 18,767 2.08%
US agency securities 141 1,404 1,081 317 2,943 2.38%
Mortgage-backed securities* 8 2,350 4,047 20,196 26,601 2.53%
Asset-backed securities 53 2,144 479 1,283 3,959 2.78%
Total fair value $12,062 $16,667 $8,620 $21,796 $59,145 2.39%
Total amortized cost $12,058 $16,565 $8,439 $21,603 $58,665
*Agency collateralized ($25,160), Agency whole-loan pass through ($1,296), Private
label-FHA/VA ($145)
Part of the Farm Credit System 6
NET INCOME
Net Interest Spread* ($ billions)
$4.848 $5.189 $5.332
declined to 2.02% at $4.688
9/30/19 from 2.13% at
9/30/18. $4.055
Net Interest Margin** was
2.41% at 9/30/19 four
basis points decrease from
9/30/18.
2015 2016 2017 2018 9/30/2019 ***
For the Year Ended
*Net Interest Spread = average rate on total earning assets – average rate on interest bearing liabilities
**Net Interest Margin = net interest income / average earnings assets
*** YTD
Part of the Farm Credit System 7
SYSTEM CAPITAL
                                                                 Regulatory Capital Requirements
                                                                           (at September 30, 2019)
                                          CET 1 Capital              Tier 1 Capital              Total Capital               Tier 1 Leverage              Permanent Capital

     Minimum Requirement                        4.5%                      6.0%                       8.0%                         4.0%                           7.0%

     Minimum Requirement w/
                                                7.0%                      8.5%                      10.5%                         5.0%                             --
     Conservation Buffer

     Banks                                9.8% - 18.6%               15.1% - 19.0%              16.1% - 19.1%                  5.5% - 7.6%                  15.2% - 19.0%
     Associations                         12.1% - 38.3%              12.1% - 38.3%              13.5% - 39.5%                 10.4% - 35.7%                 13.2% - 38.8%

                                                                           System Capital
                                                                            (at December 31st)
                                 ($ billions)

                                                                                                                       $62.36
                                                                            $55.38        $58.44
                                                              $52.31
                                                 $48.83

                                                  2015         2016          2017          2018                       9/30/19

               Capital-to-asset Ratio            16.1%        16.4%         16.8%         16.7%                        17.6%

Note: Systemwide Debt Securities are the general unsecured joint and several obligations of the Banks and are not the direct obligations of the Associations. The System combined
capital reflects Association capital which may not be available to support principal or interest payments on Systemwide Debt Securities. The amounts of combined Bank capital,
combined Association capital and the Insurance Fund are reflected on page F-24 in the Q3 2019 Information Statement of the Farm Credit System.

                                                                             Part of the Farm Credit System                                                                     8
INSURANCE CORPORATION & FUND
Farm Credit System Insurance Corporation
– Created in 1988 through an amendment to the Farm Credit Act
– Primary responsibility is managing the Farm Credit Insurance Fund
– Secured a $10B liquidity line to be used in exigent market circumstances that threaten
our ability to pay maturing obligations.
Farm Credit Insurance Fund
– Primarily to insure the timely payment of principal and interest on Systemwide Debt
Securities (provides additional protection for investors)
– Funded by premiums assessed on System Banks, which may be passed on to the
Associations
– Insurance Fund target is 2% of aggregate outstanding insured debt (primarily
Systemwide Debt Securities outstanding)
– Insurance Fund invested only in U.S. Government guaranteed securities
– Assets of $5.1 billion in the Insurance Fund (at 9/30/19)
– Insurance Fund has never been used for the payment of principal or interest on
Systemwide Debt Securities.
Part of the Farm Credit System 9
TOTAL CAPITAL AND ALLOWANCE FOR LOAN LOSSES
Measure of risk bearing
capacity
Total risk funds as a percentage
($ billions) 64.1
of loans = 23.2% (as of 9/30/19)
60.2 Additional paid-in-
(additional paid-in-capital + allowance 56.9
3.7 capital
+ Insurance Fund + surplus + preferred 53.8
stock + capital stock + participation 50.1 3.7 1.8
3.7 Allowance for Loan
certificates) 1.7 5.1
1.4 1.6 Losses
1.3 1.5 5.0
Surplus continues to grow due 1.3 4.5 4.8 Restricted Capital-
to net income earned and 4.0 Insurance Fund
retained
Surplus
48.3 Preferred Stock, Capital
44.7
41.6 41.9 Stock and Participation
39.0
Certificates
4.5 4.8 4.9 5.1 5.2
2015 2016 2017 2018 9/30/19
Total Risk Funds as a Percentage of Loans
21.2% 21.5% 21.9% 22.0% 23.2%
Part of the Farm Credit System 10THIRD PARTY CAPITAL OUTSTANDING (as of 9/30/2019)
Issue Date Amount Dividend Rate and Security Type
Preferred Stock
AgFirst June 2007 49.25 3M LIBOR plus 1.13% non‐cumulative perpetual, payable quarterly Redeemable on 6/15/17, and each
five year anniversary thereafter
AgriBank Oct. 2013 250 6.875% non-cumulative perpetual, payable quarterly. Beginning 01/01/24, Redeemable on 01/01/24, and any
dividends will accrue at an annual rate of 3M LIBOR + 4.225% dividend payment date thereafter
CoBank April 2016 375 6.25% non‐cumulative perpetual, payable semi-annually. Beginning Redeemable on 10/1/26 and any
10/1/26, dividends will accrue quarterly at the annual rate of 3M LIBOR dividend payment date thereafter
+4.660%
Nov. 2014 300 6.20% non‐cumulative perpetual, payable quarterly. Beginning 1/1/25, Redeemable on 1/1/25 and any
dividends will accrue at the annual rate 3M LIBOR + 3.744% dividend payment date thereafter
April 2013 200 6.125% non‐cumulative perpetual, payable quarterly Redeemable on 7/1/18 and any
dividend payment date thereafter
Oct. 2012 400 6.25% non‐cumulative perpetual, payable quarterly. Beginning 10/1/22, dividends Redeemable on 10/1/22 and any
will accrue at an annual rate of 3M LIBOR +4.557% dividend payment date thereafter
Jan. 2012 225 3M LIBOR plus 1.18% non‐cumulative perpetual, payable quarterly Redeemable on 7/10/12, and each
five year anniversary thereafter
Texas June 2018 100 6.20% non-cumulative perpetual payable quarterly. Beginning 6/15/28, Redeemable on 6/15/28 and any
dividends will accrue at annual rate of 3M LIBOR plus 3.223% dividend payment date thereafter
July 2013 300 6.75% non-cumulative perpetual payable quarterly. Beginning 9/15/23, Redeemable on 9/15/23 and any
dividends will accrue at annual rate of 3M LIBOR plus 4.01% dividend payment date thereafter
Aug. 2010 300 10.0% non‐cumulative subordinated, perpetual payable semi‐annually Redeemable after the dividend
payment date in 6/20/20
Compeer May 2013 100 6.75% non-cumulative perpetual payable quarterly. Beginning 8/15/23, Redeemable on 8/15/23 and any
Financial dividends will accrue at an annual rate of 3M LIBOR plus 4.58% dividend payment date thereafter
AgTexas March 2017 20 5.00% cumulative perpetual payable semi-annually Redeemable on March 24, 2022
Farm Credit and thereafter
Services
Part of the Farm Credit System 11FARM CREDIT RATINGS
Fitch Moody's S&P
Farm Credit System
Long-term AAA Aaa AA+
Short-term F1+ P-1 A-1+
Outlook Stable Stable Stable
BCA (baseline credit assessment) a1
SACP (stand-alone credit profile) aa
AgFirst
Issuer ratings - LT AA- Aa3
Noncumulative preferred BBB Baa1
Agribank
Issuer ratings - LT AA- Aa3 AA-
Noncumulative preferred BBB Baa1 BBB+
CoBank
Issuer ratings - LT AA- AA-
Noncumulative preferred BBB BBB+
Farm Credit Bank of Texas
Issuer ratings - LT AA- Aa3
Noncumulative preferred BBB Baa1
Part of the Farm Credit System 12GEOGRAPHIC DIVERSIFICATION
Farm Credit System Loan Portfolio
(percent of total loan volume at 12/31/18)
Farm Credit System lends in all STATE % STATE %
50 states, the Commonwealth
of Puerto Rico and U.S. California 11.00 North Dakota 2.20
territories Texas 6.91 Florida 2.13
Iowa 5.36 Colorado 1.97
Loan portfolio has broad
geographic diversification Illinois 4.99 Arkansas 1.80
Minnesota 4.52 Tennessee 1.78
Highest concentration is 11% Nebraska 3.86 Kentucky 1.77
Ohio 3.59 Virginia 1.76
Geographic diversification Kansas 3.15 Idaho 1.58
minimizes overall effects of
local agricultural events Wisconsin 3.06 Oregon 1.26
Indiana 2.96 Oklahoma 1.26
Michigan 2.70 Pennsylvania 1.25
Missouri 2.67 Alabama 1.23
South Dakota 2.66 Mississippi 1.16
New York 2.53 Maryland 0.93
North Carolina 2.48 South Carolina 0.86
Georgia 2.38 All other states 10.01
Washington 2.23 100.00
Source: Farm Credit System Annual Information Statement - 2018
Part of the Farm Credit System 13AGRICULTURAL DIVERSIFICATION
Farm Credit System Loan Portfolio
Broad diversification within the (at 12/31/18)
Farm Credit System loan portfolio General Farms, Biofuels
primarily livestock primarily ethanol
2% 1%
Agricultural Export Finance Horticulture Other
Highest concentration is 16% 2% 1% 3%
Hogs Cash Grains
2% (includes corn, wheat and
Diversification minimizes Rural Communication soybeans)
2% 16%
concentration risk
Poultry and Eggs
3%
Agricultural Services and Fish
3%
Cotton
1% Cattle
General Farms, primarily crop 9%
4%
Other Livestock
1%
Farm Supplies and Marketing
5% Rural Power
7%
Rural Water/Waste Water
1%
Field Crops
(includes sugar beets, potatoes
and vegetables) Food Products
5% (includes meat, dairy and
bakery products)
Tree fruits, nuts and grapes 7%
6% Dairy Farms
Forestry 7%
6% Rural home loans, farm
landlords and part-time farms
6%
Source: Based on loans described in the Farm Credit System Annual Information Statement – 2018
Part of the Farm Credit System 14LOANS BY DOLLAR SIZE
Farm Credit System Loan Portfolio
(at 12/31/18)
Farm Credit System lends to Amount
qualified borrowers of all Range Outstanding % of Portfolio # of Borrowers % of Portfolio
sizes
($ thousands) ($ millions) (# of borrowers)
$1 -- $249 32,241 12 414,896 76
87% borrowers between
$1,000 and $499,000 $250 -- $499 21,568 8 61,570 11
$500 -- $999 25,236 9 36,117 7
$1,000 -- $4,999 57,954 22 29,785 5
$5,000 -- $24,999 41,493 15 4,224FINANCIAL SUMMARY (as of 9/30/19)
(In billions) 9/30/19 12/31/18 12/31/17 12/31/16 12/31/15
Total assets $354.0 $349.0 $329.5 $319.9 $303.5
Total loans $276.1 $273.4 $259.9 $249.8 $235.9
Cash and investments $67.1 $66.5 $60.7 $61.6 $59.4
Net income $4.1* $5.3 $5.2 $4.8 $4.7
System combined capital
$62.4 $58.4 $55.4 $52.3 $48.8
Farm Credit Insurance
$5.1 $5.0 $4.8 $4.5 $4.0
Fund
Capital to assets ratio 17.6% 16.7% 16.8% 16.4% 16.1%
Nonaccrual loans as a
0.74 % 0.69 % 0.64% 0.64% 0.56%
percentage of total loans
Total risk funds as a
23.2% 22.0% 21.9% 21.5% 21.2%
percentage of total loans
*For the nine months ended September 30, 2019
Part of the Farm Credit System 16DEBT SECURITIES OVERVIEW
Issued by the 4 System Banks on a joint and several basis
Aaa/P-1 rating by Moody’s, AAA/F1+ by Fitch and AA+/A-1+ rating by S&P on Systemwide Debt
Securities
Interest is generally exempt from state, local and municipal income taxes
20% BIS (Bank for International Settlements) risk-weighting (Basel II, June 2006; Basel III, July 2013)
Name diversification in fixed income portfolios
Supported by Selling Group of 30 investment firms
A broad range of investors purchase Systemwide Debt Securities
Part of the Farm Credit System 17FARM CREDIT DEBT (as of 12/31/19)
Discount Notes Floating Rate Callables Bullets
Maturity 1 – 365 days 1 – 30 years
Issued Daily Daily and/or as needed
Settlement Cash/regular 5 – 7 business days
Typical Maturity
O/N – 30 days 1 – 3 years 1 – 5 years 1 – 5 years
Range
LIBOR, SOFR, American,
Indices/Call Prime, T-Bills, Bermudan,
N/A Fed Funds N/A
Feature European
(monthly, quarterly,
(3mo or longer lockouts)
daily)
Avg. Issuance size N/A $275.5 MM $107.9 MM $95.1 MM
(YTD)
Outstanding $19.1 B $117.2 B $77.9 B $79.1 B
$206.9 B (total)
YTD Issuance $70.2 B $62.8 B $24.4 B
$144.4 B (o/n)
Distribution 10 Member Core Group 30 Member Selling Group (Auction/Negotiated)
Method
Bloomberg FFCB
Part of the Farm Credit System 18DISCOUNT NOTES (as of 12/31/19)
Maturity Range Outstanding 2019 YTD Issuance WAM YTD Issuance
1 to 365 days $19.1 B $62.5 B (excludes o/n maturities)
30 days (includes o/n)
$144.4 B (o/n maturities)
Generally issued daily
– Sizes and maturities posted to the window at 4pm ET
– Priced next morning
– Investor orders receive priority
– Remaining DNs are allocated on a first come first served basis
Reverse inquiries considered
Distributed through 10 member core group, available to entire selling group with re-allowance
Reported Orders*
(January 1, 2019 – December 31, 2019)
Insurance Discount Notes Issuance
Corporations
Companies 3%
1% Maturity
2019 YTD (%) 2018 (%)
(days)
Other
21%
O/N-30 76 (70 o/n) 76 (73 o/n)
State & Local
31-60 12 6
Govt. Investment
3% Managers > 60 13 17
72%
*Excludes overnights. Please note columns above may total over 100% due to rounding.
Part of the Farm Credit System 19FLOATING RATE BONDS (as of 12/31/19)
Typical Maturity Outstanding YTD Issuance Indices (YTD Issuance)
1 to 3 years $117.2 B $70.2 B 1ML 3ML SOFR PRIME Fed Funds T-Bills
65% 1% 11% 8% 8% 6%
Issuance practices are responsive to market conditions
1 to 2 year Floating Rate Bonds are typically auctioned
2+ years Floating Rate Bonds are typically posted
Issuance
(January 1, 2019 – December 31, 2019)
Recent Issuance (December)
$millions
FRNs Fed Funds Coupon
900 Structure Trade Date Size ($ MM) Index
1M LIBOR (Spread)
800
3M LIBOR
700 3-Year 12/3/2019 467 Fed Funds 36
6M LIBOR
600
Prime 3-Year 12/3/2019 500 SOFR 32
500
3M TBill 1.75-Year 12/4/2019 550 1M LIBOR 10
400
SOFR
300 2-Year 12/4/2019 325 Prime -296
200 1-Year 12/6/2019 250 1M LIBOR -2
100
2-Year 12/10/2019 540 1M LIBOR 11
0
0 1 2 3 4 5 2-Year 12/23/2019 100 T-Bill 26
Years
Part of the Farm Credit System 20FIXED RATE NON-CALLABLE BONDS (as of 12/31/19)
Typical Maturity Outstanding YTD Issuance Average Issuance Size (YTD)
1 to 5 years $79.1 B $24.4 B $95.1 MM
Offerings vary in size and maturity
Auctioned as needed
Reopen outstanding issues based on funding needs
May be swapped back to floating
Issuance
(January 1, 2019 – December 31, 2019)
$ millions
Recent Issuance (December)
Bullets
700
Structure Trade Date Size ($ MM) Coupon (%)
600
500 7-Year 12/3/2019 50 1.780
400 2.5-Year 12/4/2019 350 1.630
300 10-Year 12/11/2019 35 2.060
200 15-Year 12/11/2019 10 2.420
100
2-Year 12/20/2019 345 1.625
0
1-Year 12/26/2019 275 1.625
0 5 10 15 20 25 30 35
Years
Part of the Farm Credit System 21FIXED RATE CALLABLE BONDS (as of 12/31/19)
Average Issuance Size
Typical Maturity Outstanding YTD Issuance Possible Call Feature
(YTD)
1 to 5 years $77.9 B $62.8 B $107.9 MM American, Bermudan, European
Offerings vary in size and maturity
Auctioned as needed
Reopen outstanding issues when possible
Predominantly American calls
Issuance
(January 1, 2019 – December 31, 2019) Recent Issuance (December)
$ millions
Structure Trade Date Size ($ MM) Coupon (%)
600
Callables
1.5Y NC 3M 12/4/2019 325 1.640
500
8Y NC 1Y 12/4/2019 315 2.400
400
1Y NC 6M 12/16/2019 400 1.650
300
3Y NC 3M 12/18/2019 145 1.830
200
2Y NC 1Y 1X 12/23/2019 25 1.65
100
15Y NC 3Y 12/27/2019 50 2.820
0
Years 15 20Y NC 1Y 12/27/2019 50 3.030
0 5 10 20 25
Part of the Farm Credit System 22SYSTEMWIDE DEBT SECURITIES OUTSTANDING
($ billions) $281.8 $293.6
$265.3
$257.9
0.2 0.3 0.3
$242.2 0.3
Other*
$224.8 0.4
0.4
108.6 117.2 Floating-Rate Bonds
99.2
95.8
86.3
75.2 Fixed-Rate Non Callable
Bonds
Fixed-Rate Callable Bonds
67.1 71.1 79.1
60.4 68.0 Designated Bonds
57.5
Discount Notes
56.5 58.8 59.7 72.2 79.0 77.9
8.2 5.0 4.5
1.0
27.0 31.3 29.6 25.6 22.8 19.1
12/31/14 12/31/15 12/31/16 12/31/17 12/31/18 12/31/19
Please note columns may not sum to total due to rounding *Includes Linked Deposits and Retail Bonds
Part of the Farm Credit System 23APPENDIX – U.S. AGRICULTURE
American agriculture and its related industries The global population is expected to increase to
provide 11 percent of U.S. employment 9.7 billion by 2050 (www.un.org)
Majority of U.S. farms are operated by families – Approximately 20% of total volume of U.S.
individuals, family partnerships or family agricultural production is exported*
corporation
95% of the world’s consumers live outside of the U.S. exports account for more than 30% of gross
United States agricultural cash income
*US exports 70% of cotton, 70% of tree nuts, 50% of wheat, 50% of rice, 50% of soybeans
2018 U.S. ag exports total $143 billion Export destinations Major Ag Commodities
Soybeans, Cotton, Coarse Grain**, Pork, Dairy, Wheat,
China Hay
11.4%
Prepared Food, Fresh Vegetables, Fresh Fruit, Snack
14.4% China Canada Foods, Non-Alcoholic Beverages, Beef & Beef Products,
43.5% Canada Pork & Pork Products
Mexico Corn, Soybeans, Pork & Pork Products, Dairy Products,
13.0% Mexico Beef & Beef Products, Poultry Meat, Wheat
Japan
Corn, Pork & Pork Products, Beef and Beef Products,
Japan
8.9% 8.8% EU Soybeans, Wheat
Other EU Tree Nuts, Soybeans, Wine & Beer, Prepared Foods
Source: www.ers.usda.gov **excludes corn
Part of the Farm Credit System 24APPENDIX – U.S. AGRICULTURE
$ Billions Agricultural Trade Balance 139
per fiscal year
160
140
Trade Balance
USDA forecast for 2019 120
Exports
ag trade balance remains Imports
positive 100 132
80
Slowing global GDP 60
growth may temper
demand 40
20
0
30.0
Top U.S. agricultural export destinations
25.0 $U.S. value by fiscal year
20.0
China
$ Billions
15.0 Canada
Mexico
10.0
Japan
5.0 European Union-28
0.0
2013 2014 2015 2016 2017 2018 2019F 2020F
Source: USDA Outlook for U.S. Agricultural Trade 11/25/19
Part of the Farm Credit System 25APPENDIX – U.S. AGRICULTURE
Production and Demand Dollars per bushel 2016/17 2017/18 2018/2019F 2019/2020F
Wheat $3.89 $4.72 $5.16 $4.55
Trade uncertainties
continue to impact the Corn $3.36 $3.36 $3.60 $3.85
distribution of large grain
supplies. Soybeans $9.47 $9.33 $8.50 $9.85
Global grain stocks remain Dollars per cwt. 2017 2018 2019F 2020F
steady but stocks-to-use,
in particular, coarse grains Cattle $121.52 $117.12 $117.00 $117.00
are declining.
Hogs $50.48 $45.93 $48.00 $55.00
Broilers $93.50 $97.80 $88.50 $89.00
Milk $17.63 $16.26 $18.60 $19.40
Million MTs
3,000 Grain Production and Use 35%
2,500 30%
25%
2,000 World Production
20%
1,500 US Production
15%
1,000 US Stock-to-Use
10%
World Stock-to-use
500 5%
0 0%
1991 1996 2001 2006 2011 2016 2019F
Source: USDA WASDE 12/10/19
Part of the Farm Credit System 26APPENDIX – U.S. AGRICULTURE
140 Net Cash Income
Emergency Payments
2019 Forecasts 120 Commodity/Conservation programs
Net Cash Income
100 Net Cash Income less government payments
$ Billions
80
After peaking in 2012, Net Cash 60
Income dipped, but is now 40
forecasted to increase in 2019 20
driven by Market Facilitation 0
Payments.
Debt-to-Asset ratio has increased
since 2012, but is expected to Debt-to-Asset Ratio
25%
remain flat in 2019 and slightly 10 Year Average
30 Year Average
above the 30-year average. 20%
15%
Working capital accumulated in high 10%
income years now being drawn on
5% Debt-to-Asset Ratio
to pay normal business expenses.
0%
Working Capital to Gross Revenues Ratio
50%
40%
30%
20%
10%
0%
2009 2010 2011 2012 2013 2014 2015 2016 2017 2018 2019F
Source: USDA U.S. Farm Income Data 11/27/2019
Part of the Farm Credit System 27APPENDIX – U.S. AGRICULTURE
Cropland values vary
widely across the U.S.
Farm Credit generally
uses benchmarking to
evaluate loans (not sale
price)
1.2% YoY increase in
average cropland value
(2019 vs. 2018)
Average U.S. Cropland 2009 2010 2011 2012 2013 2014 2015 2016 2017 2018 2019
Value per Acre $2,640 $2,700 $2,980 $3,350 $3,810 $4,090 $4,100 $4,040 $4,030 $4,050 $4,100
Source: USDA Land Values, 2019 Summary, August 2019
Part of the Farm Credit System 28APPENDIX – U.S. AGRICULTURE
Farm Bill Projected 2018 Farm Bill Allocations
(over 10 years)
0.4%
The Agriculture Improvement Act of 2018 became
7%
law on 12/20/18
7%
The new Farm Bill:
9%
Maintains a strong crop insurance program
with improvements to Price Loss Coverage
and Agricultural Risk Coverage options
77%
Improves the safety net for dairy producers
Maintains strong USDA Rural Development
programs
Nutrition, $664B
Farm Bill negotiated every 5 years Crop Insurance, $78B
Conservation, $60B
Commodity Programs, $61B
Other, $3.5B
Source: Congressional Budget Office 12/17/2018
Part of the Farm Credit System 29DISCLAIMER
This overview is provided for general information purposes only. It is not an offer to sell
or a solicitation of an offer to buy any Systemwide Debt Securities. Debt Securities are
offered only in jurisdictions where permissible by offering documents available through
our Selling Group. Systemwide Debt Securities may not be eligible for sale in certain
jurisdictions or to certain persons and may not be suitable for all types of investors. All
statements made in this overview are qualified in their entirety by the information in the
most recent Federal Farm Credit Banks Consolidated Systemwide Bonds and Discount
Notes Offering Circular, including the financial and other Systemwide information
incorporated therein, and other offering documents. Copies of offering documents can be
obtained, if permitted by applicable law through Selling Group members or through the
Funding Corporation’s website at www.farmcreditfunding.com.
Any forward-looking statements in this presentation are based on current expectations
and are subject to uncertainty and changes in circumstances. Actual results may differ
materially from expectations due to a number of risks and uncertainties. More
information about these risks and uncertainties is contained in the System’s most recent
Annual and Quarterly Information Statements. The System undertakes no duty to update
or revise any forward-looking statements, whether as a result of new information, future
events or otherwise.
Part of the Farm Credit System 30NEW NATIONAL MESSAGING CAMPAIGN
The “One Mission. Many Voices.” national messaging campaign brings Farm
Credit’s mission to life through the many voices of its customers, directors,
employees, and others. Please visit www.farmcreditvoices.com to learn more.
Part of the Farm Credit System 31You can also read