PENNSYLVANIA - PA Game ...
←
→
Page content transcription
If your browser does not render page correctly, please read the page content below
PENNSYLVANIA
                     2019 Grouse and Woodcock Status Report

Prepared by:        Lisa M. Williams, Wildlife Biologist 2 (Grouse and Webless
                    Migratory Game Birds Specialist)
                    Pennsylvania Game Commission
                    Bureau of Wildlife Management, Game Bird Section
                    liswilliam@pa.gov

RUFFED GROUSE

Hunter Cooperator Survey
For the fall and winter hunting survey, avid grouse hunters (i.e. cooperators) were sent
survey forms in October 2017. Forty-four percent of 595 Cooperators submitted hunt
information. Useable replies were received from 206 of 262 responding cooperators; the
remaining 56 submitted ‘did not hunt’ responses. Grouse Cooperators submitted data on
1,456 hunts, representing 4,135 hours of active grouse hunting. Grouse hunters averaged
20 hours hunted, 18 grouse flushed, and 0.87 grouse bagged during the 2017-2018
hunting season. Daily effort was greatest during the October (95.7 hours/available day)
and November (83.7 hours/available day), followed by the December segment (71.3
hours/available day). December participation increased dramatically (up 96% compared
to 2016) with the loss of the post-Christmas “Late Season” in 2017. The November portion
of the season accounted for 52% of the statewide cooperator harvest, followed equally
by December (24%) and October segments (24%).

Statewide, cooperators hunted 4,135 hours and recorded 3,641 flushes for an average
rate of 0.88 flushes per hour. This flush rate of 0.88 represents a 6% decrease compared
to the previous season and is the lowest flush rate observed in 53 years of population
monitoring (G&W Fig 1; G&W Table 1). It is 36% below the long term (52-year) average
of 1.37 flushes per hour. Compared with the previous year, all regions exhibited
decreased flush rates except the NW which ticked up (5%) slightly. All regions are greatly
below their respective 35-year long-term averages (Northwest -41%; Northcentral -22%;
Northeast -38%; Southwest -51%; Southcentral -66%; Southeast -32%) (G&W Table 2).
Even compared to 10-year short-term averages, all regions except the Southeast are
currently very depressed (Northwest -41%; Northcentral -24%; Northeast -22%;
Southwest -25%; Southcentral -44%; Southeast -6%) (G&W Table 2).

Without the relatively high annual abundance in the Northwest and Northcentral regions
the statewide flush rate falls precipitously lower. In these regions, the mix of northern
hardwoods and oak forests provides optimum nutrition, while active forest management
within a largely forested landscape provides abundant habitat. Unfortunately, it is
becoming evident that after years of high West Nile Virus (WNV) prevalence, these
regions cannot be counted on to produce an abundance of grouse, which drops the
statewide average below 1 bird/hour to a record-low 0.88 flushes/hour in 2017-18 license
year. In other areas of the state, the Southcentral and Northeast regions retain relatively
large-scale forested landscapes with suitable forest types, yet they seem to be under-
                                                                                         1
producing grouse. Aggressive and focused grouse habitat management and continued investigation into non-habitat factors contributing to declines must be prioritized if we are to protect dwindling grouse populations and a grouse hunting tradition. Summer Sighting Survey For the 2018 summer sighting survey, 45 Pennsylvania Game Commission foresters and surveyors recorded grouse seen while working in the woods during 1,507 observer days (June and July data only; August not yet available). Observers averaged seeing 3 broods/100 days and 21.8 total grouse/100 days. Productivity in 2018 was 3.6 chicks/hen for 26 unique broods observed in June and 1.8 chicks/hen for 5 unique broods observed in July. It is unlikely that August sightings will improve these data relative to past years, making the hunting season forecast for 2018-19 quite guarded. Nesting and brooding weather in 2018 was quite wet, with record-high rainfall occurring in much of Pennsylvania during June, July and August. Annual weather patterns are expected to influence annual production, but even when examined over the long term, the summer grouse sighting population index reveals worrisome declines. With 26 individual broods observed, June 2018 brood sightings were down 2% while total grouse sightings were up 25% from 2017. In July, total grouse observations were relatively stable since 2017 (down a modest 5%), but the number of broods seen was down by 42% compared to 2017. Repeat observations, when foresters were working together, are always an issue and serve to somewhat inflate brood observations. Only 31 of 45 brood observations in June and July represented unique sightings. August sightings have not yet been analyzed, but it is unlikely that those observations will bring the 2018 production season up to satisfactory levels. Until the early 2000s, June and July brood observations tracked well together, with July observations serving as a rough index of survival. Analysis of Summer Grouse Sighting brood observations reveals a statistically significant (P
guarded. Statewide, incubation and brooding weather was extremely wet. June and July
2018 brood observations are below both 36-year long-term average and 10-year short-
term average (June broods down 38% from 10-yr average; July down 71%). Total grouse
observations are also well-below the 10-year short-term average (June total grouse down
33% from short-term average; July observations down 49%).

Habitat Restoration
Restoration of significant acreage of early-succession habitat (ESH) remains the central
goal of Pennsylvania’s Ruffed Grouse Management Plan, which outlines best methods to
increase populations to 1980’s levels. That Plan identified a PGC goal of creating 8,000
acres of young forest habitat per year on SGL. Currently, the SGL system has very little
young forest (roughly 7% of PGC acreage is less than 20 years old), and a significant
amount of old forest (62% of Pennsylvania forests are older than 80 years). This is not an
optimum distribution of age classes to meet Grouse and Woodcock Plan goals, which
were labeled as “too ambitious” when written.

To achieve a more balanced distribution of age classes on SGL forests, the agency now
recognizes that harvests must be increased to about 13,500 acres per year. This is a
significant increase from harvesting levels of the last 20+ years when average timber
harvests hovered around 6,000 acres per year. It is also more ambitious than the Grouse
and Woodcock Management Plan prescriptions. In recognition of this, and even with the
challenging weather conditions and volatile timber markets of 2018, the PGC forestry
program has increased outputs and are now over 12,000 acres harvested in 2018 (G&W
Fig 2).

Plans are in motion to grow outputs even more toward the 13,500-acre annual goal. To
accelerate our outputs, the PGC hired 14 additional seasonal forestry staff in early 2018
and has revived our summer intern program, hiring an additional 14 summer interns to
assist with forestry efforts. Our goal is to achieve the target of 17 percent of forests in the
0 to 20-year age class within the next 50 years.

During 2018, prescribed fire was used to manage 8,592 acres, including 200 acres on
properties enrolled in the Hunter Access Program. Nearly half of the acreage burned was
in low quality upland oak restoration projects. Much of the forestry work highlighted above
will provide ample opportunity for large-scale use of prescribed fire into the future.

Integration with other early-succession initiatives, and with SGL planning, remains an
important element of these efforts. Non-commercial habitat creation is increasingly
being used on SGL (G&W Fig 2). Much of this habitat management was made possible
by an extra $500,000 that was allocated to PGC forestry for “restoration” work, in part
as an agency response to dramatic grouse declines in the Commonwealth. Practices
included understory cutting, thinning, and mowing projects to set the stage for healthy
forest regeneration and provide for future large-scale timber sales. NFWF grant-
supported projects directed at young forest restoration also contributed significant
funding and resulted in increased annual output. These activities included large-scale
regeneration harvests to set back succession where the timber was not of merchantable
size or quality.
                                                                                             3
Active and focused grouse-specific management, as called for in the Ruffed Grouse
Management Plan, is necessary to improve grouse populations. For best effect, habitat
restoration projects should be sited near grouse production areas to provide high-quality
habitat for dispersing juveniles. As populations respond, habitat efforts should be
expanded outward in an ‘expanding bullseye’ fashion. Every effort should be made to
ensure that dispersing juveniles have appropriate habitat available. To guide internal
and external habitat restoration, a Grouse Priority Area Siting Tool (G-PAST) has been
developed by PGC. This GIS-based analysis and mapping tool combines known
landscape factors that are protective against West Nile Virus (i.e. elevation, slope, soil
permeability due to impacts on mosquito breeding pools) and information on nearby
grouse source populations (known grouse presence within 2-5 miles). Timber stand
information is also incorporated so that foresters can see where recent harvests have
occurred and identify sites in need of active management. The tool will officially be
rolled out to PGC Foresters and other staff beginning in September 2019.
In addition, the PGC Private Lands Program is soon launching a grouse initiative among
our Hunter Access Cooperators. Funds have been allocated and targeted mailings will
begin this fall to recruit Access Cooperators to consider more active forest and shrubland
management on their properties. Responding landowners will be prioritized by acreage
and grouse priority (using the G-PAST tool). Prioritized sites will receive biologist
consultation and management plan development, with an emphasis on ruffed grouse.
Targeted grouse habitat efforts in the Northeast and Southcentral regions, in particular,
may help these areas live up to their grouse production potential. The Southeast region
has an area of high-WNV survival (based on hunter-harvested blood serology). This area
should also be the focus of grouse-enhanced management to encourage expansion of
that robust population.
Harvest
PGC Game Take Survey results, which compile statewide hunter harvest and
participation, revealed a historic low of 8,717 grouse harvested during 94,230 cumulative
days afield by 24,144 hunters in 2018. This represents a single-year decline 56% in
harvested birds, 32% in days afield, and 26% in number of grouse hunters. This was the
second year of Post-Christmas grouse season closure. When comparing Regular Season
participation and success between 2017 and 2018, Game Take Survey indicates that
Harvest/Day also decreased by 33%. Participation and hunter success will continue to be
monitored as part of the evaluation of the new approach to season setting.
Research and Management
Implementation of the PGC’s Ruffed Grouse Management Plan is well underway, with
significant progress made on 23 of 26 management objectives (88%) to date. The 2020
plan will summarize the current state of ruffed grouse populations in Pennsylvania and
provides guidance on research and management priorities through 2030.
4Research
The 4-year pattern in antibody prevalence continues to suggest that fewer antibody-
positive survivors are represented in the harvested population, as a proportion of total,
during severe WNV years, and antibody-positive survivors occur as a higher percentage
of the harvested population in areas of high-quality and highly-abundant habitat. Hunter-
harvested blood sampling in 2015-17 revealed that 13% of harvested birds in 2015-16
had West Nile Virus+ antibodies, 24% of harvested grouse had WNV+ antibodies in 2016-
17, just 4% exhibited WNV antibodies during the severe WNV year of 2017, and
preliminary 2018 data indicates less than 10% of sampled grouse had WNV+ antibodies.
These WNV-positive birds represent WNV survivors in the fall population. Additional
years of serology sampling will shed more light on this issue.
Intriguing findings also suggest that forest type and/or habitat quality may be impacting
the resilience of populations, with northern regions (northern hardwoods/mixed oak)
forest types exhibiting higher WNV antibody prevalence (i.e. exposed survivors) than
southern regions (oak-hickory forest types). Furthermore, the northern hardwoods
regions exhibit rapid population recovery after WNV losses and higher incidence of
survivorship (G&W Figure 3). Southern regions exhibit relatively low proportions of WNV
survivors and show only weak population recovery after bad WNV years, followed by
continued declines (G&W Figure 3). Ongoing research into mosquito/WNV cycling in
woodland habitats may help reveal management options either in terms of where to focus
habitat restoration or in direct control of mosquito production areas.
Management
Given the ongoing declines in grouse population indices, a new harvest management
framework was implemented in 2018 for setting seasons and bag limit recommendations.
This responsive harvest framework will dictate season setting in future years by triggering
the expansion or contraction of the post-Christmas grouse season segment. While
harvest management alone will not reverse these trends, limiting direct (harvest) and
indirect (disturbance-induced) late-winter mortality of grouse through restricted or closed
winter hunting seasons may be an important conservation tool. Reducing late winter
harvest may allow for carry-over of more birds into the spring breeding population.
Under the Responsive Harvest Framework, the length of the post-Christmas grouse
season will vary between Closed, 1-week, or 4 weeks, based on grouse population
indices of abundance and productivity. If and when differences in population indices guide
the recommendation toward different season recommendations, then WNV severity
indices will be used to make a final season length recommendation. Under this
framework, Pennsylvania is split into two management zones. [Refer to the 2017 PA State
Report for additional details on the framework.]
Population Restoration
Primary objectives of population restoration are covered under Habitat Restoration
above. No active translocation activities are planned at this time. To assist in assessing
the need for in-state translocations, a genetic analysis of PA grouse was conducted in
2018. Objectives were to assess genetic diversity in the statewide population to
5investigate any regional variation and identify any potential genetic components to WNV
survival. The pilot effort focused on assessing genetic diversity in the statewide
population. Findings indicated low genetic diversity in PA grouse. Additional
investigation into this critical conservation question may be conducted, pending funding
availability.
Season Dates
2019: Oct. 19–Nov. 29, Dec 16-24; (no post-Christmas season); (2-bird daily bag
limit, 6-bird possession limit). As with other small game, closed intervals occur
during the regular firearms deer season.
AMERICAN WOODCOCK
Population Status
2018 federal Singing Ground Surveys were conducted on 32 routes in
Pennsylvania. 2018 results were 1.17 males per route in Pennsylvania and 2.24
males per route in the Eastern Region. These values are slight decreases from
2016 results. Despite recent stability, the 10-year trend in both Pennsylvania and
the Eastern Region indicate ongoing declines.
For the USFWS Parts Collection Survey, 51 Pennsylvania hunters submitted 275
wings from birds harvested in Pennsylvania in 2017. The PA recruitment index
was 1.3 juvenile per adult hen (a slight increase above previous year), while the
index for the EMR was 1.34 juveniles per adult female. The PA value is up 30%
compared to prior year, while the EMR was comparable to prior year (down 6%).
Both values remain below their respective long-term averages. It is important to
note that these values are obtained from wings harvested in PA, but there is no
way to tell if these birds were produced in PA. Thus, recruitment figures should
be interpreted with caution.
Restoration
A central objective of Pennsylvania’s 2008-2017 Woodcock Management Plan is
restoring populations to 1970’s levels by increasing the amount of young forest
habitat on Pennsylvania’s landscape. Efforts to increase young forest habitat
have included incorporating young forest management into comprehensive
management plans for individual SGLs and coordinating with the 6 PGC regional
diversity biologists who provide technical assistance to private landowners on
practices to benefit special concern species. Game Commission acreage
summaries are included in the habitat narrative and figures presented previously
for grouse habitat (G&W Figure 2). Portions of the PGC non-commercial work, in
particular, are directed to moist sites that have potential to support woodcock.
Habitat restoration is also being accomplished through collaboration with Wildlife
Management Institute (WMI), the Appalachian Mountains Woodcock Initiative,
the Golden-Winged Warbler Initiative, US Fish and Wildlife, PA Department of
Conservation and Natural Resources and other agencies.
6Harvest
Estimates from the 2018 USFWS Harvest Information Program (HIP) revealed a
precipitous drop in hunter participation relative to previous years. Pennsylvania
fell from 1st to 8th in the number of active woodcock hunters among the 17 states
in the Eastern Management Region, with 1,500 active hunters in 2018-19 (down
71% from prior year). Pennsylvania fell to 7th among Eastern Management
Region states in woodcock hunter effort (6,300 days afield; a 70% decrease from
prior year). Estimated woodcock harvest fell from 2nd in the EMR to 6TH, with
4,000 birds (down 51% from 2016). This is likely due to low grouse hunting effort,
since many hunters target both birds during same hunts, and perhaps due to the
loss of more-casual hunters from active participation. This is supported by the
increased harvest per hunter figure observed in 2018, at 2.7 birds/hunter – a
69% increase over previous year.
The annual woodcock hunter cooperator survey was conducted to assess long
term woodcock population trends in areas of good habitat and provide insight on
the timing of migration for this species. Based on 2018 data from 461 woodcock
hunts and 1,119 hours of active hunting, Pennsylvania Woodcock Cooperators
experienced 1,179 flushes, for a statewide average of 1.05 flushes/hour. This
flush rate is 30% above 2017 flush rate and is on par with the most recent 10-
year short term average of 1.06 flushes/hour (G&W Figure 4).
Research and Management
We continue to follow the Woodcock Management Plan, with implementation
occurring on 90% (18 of 20) strategies. To evaluate the effectiveness of our
early-succession habitat management efforts, singing male woodcock surveys
are conducted at Appalachian Mountains Young Forest Initiative Demonstration
Areas, SGLs emphasizing woodcock management, long term monitoring sites
and other high-priority habitat sites. These surveys, monitoring local-level
population response to habitat work, supplement the landscape-level USFWS
Woodcock Singing Ground Survey routes. Where possible, data is collected prior
to habitat treatments to provide baseline information for assessing treatment
effects in future years.
In Spring 2019, PGC staff and volunteers conducted surveys at 39 habitat
management areas to assess population response to management. Average
singing male index among all surveyed sites was 6.4 singing males per route, a
decline of 13% 2017 and 35% from 2016. Though weather and the timing of
migration affects spring surveys, managed sites still supported more than five
times the number of singing males that occur on random USFWS Singing
Ground routes. (G&W Figure 5).
This demonstrates the dramatic benefits of habitat improvement. We will
continue monitoring treatment sites, as field staffing allows, to assess trends over
time. This information has been used by WMI in performance auditing and in
7developing partnerships with funding agencies to manage new sites – thus, this
type of Management Response monitoring should be prioritized, and adequate
staffing allocated.
Season Dates
2019: Oct. 19–Nov. 29, Dec 16-24; closed Sundays (3-bird daily bag limit).
Figure G & W 1. Average annual grouse cooperator hunting season flushes/hour and
summer grouse sightings, Pennsylvania, 1981-2018.
Pennsylvania Grouse Flush Rates, 1981 - 2018
2
1.8
1.6
1.4
1.2
1
0.8
0.6
0.4
0.2
0
Flush/Hr Grouse/Day
8Figure G & W 2. Pennsylvania State Game Lands acreage harvested, 2008-2018.
PA Game Commission
Forest Habitat Acres Impacted
12,000
10,000
8,000
6,000
4,000
2,000
0
2008 2009 2010 2011 2012 2013 2014 2015 2016 2017 2018
Non- Commercial Acres Commercial acres total
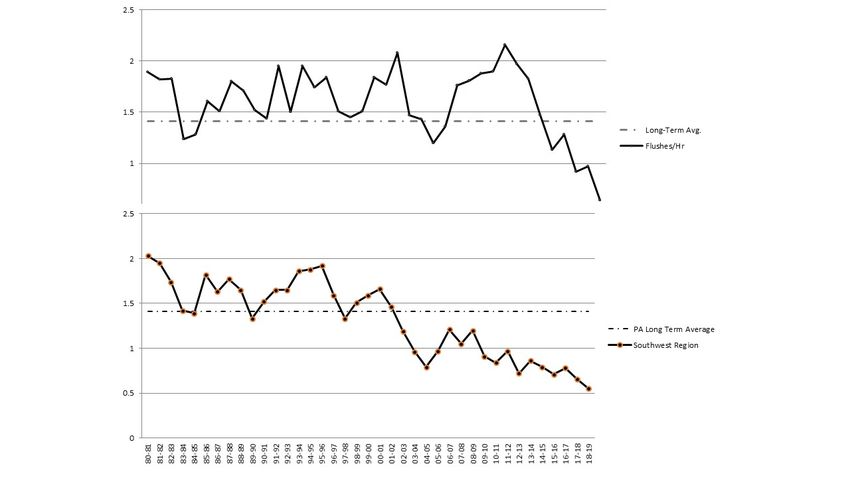
9Figure G&W 3: Grouse population trends in PA, showing robust recovery between WNV peak
years in a region with high-quality and abundant habitat (NW region) and weak recovery in a
region with less-abundant, fragmented habitat (SW region).
10Figure 4 G & W: Average annual woodcock cooperator hunting season flushes/hour in
Pennsylvania, 1984-2018.
Pennsylvania Woodcock Flush Rates, 1984-2018
2.5
2
1.5
1
0.5
0
Flushes / hr. Long Term Average
11Figure 5 G & W: Woodcock abundance (as indexed by number of singing male
woodcock/10 stops) on sites receiving targeted management (n = 39 sites) versus sites
left largely unmanaged (n = 33-36 random USFWS Singing Ground Routes*),
Pennsylvania.
12.0
10.0
8.0
PA Mgt Site Average:
6.0
USFWS SGS Average (PA)
4.0
2.0
0.0
2011 2012 2013 2014 2015 2016 2017 2018 2019
12Table 1 G&W: Statewide grouse cooperator hunting season flushes rates (grouse
flushes/hour) Pennsylvania, 1965-2018.
Season Rate Season Rate Season Rate Season Rate Season Rate
65-66 1.62 75-76 1.19 85-86 1.56 95-96 1.74 05-06 1.07
66-67 1.48 76-77 1.04 86-87 1.50 96-97 1.37 06-07 1.41
67-68 1.66 77-78 1.33 87-88 1.72 97-98 1.39 07-08 1.25
68-69 1.61 78-79 1.37 88-89 1.44 98-99 1.27 08-09 1.42
69-70 1.53 79-80 1.53 89-90 1.37 99-00 1.49 09-10 1.40
70-71 1.43 80-81 1.69 90-91 1.42 00-01 1.39 10-11 1.32
71-72 1.42 81-82 1.66 91-92 1.56 01-02 1.51 11-12 1.32
72-73 1.27 82-83 1.52 92-93 1.42 02-03 1.17 12-13 1.14
73-74 1.23 83-84 1.23 93-94 1.65 03-04 1.05 13-14 1.21
74-75 1.24 84-85 1.24 94-95 1.73 04-05 0.95 14-15 0.94
15-16 1.02
16-17 0.94
17-18 0.88
18-19 0.70
Table G & W 2. Long-term, 10-year, and current grouse flush rates by PGC region.
Long-term avg. 10-yr avg. 2018-19
Region
flushes / hr. flushes / hr. flushes / hr.
NW 1.61 1.55 0.64
NC 1.50 1.52 1.01
NE 1.13 0.88 0.53
SW 1.34 0.84 0.55
SC 1.17 0.66 0.50
SE 0.84 0.60 0.27
13You can also read