"Avoid" to Suryoday Small Finance Bank - 'Stress appears higher; aggressively priced'
←
→
Page content transcription
If your browser does not render page correctly, please read the page content below

“Avoid” to
Suryoday Small Finance Bank
‘Stress appears higher; aggressively priced’
16th Mar. 2021

Salient features of the IPO:
                                                                            Recommendation                              Avoid
•   Suryoday Small Finance Bank Limited (SSFB) started operations as
                                                                     Price Band                              Rs303 - Rs305 per share
    SFB on Jan 23’ 2017.
                                                                            Face Value                           Rs10 per share
•   Prior to commencement of operations as a SFB, SSFB operated as an
    NBFC – MFI carrying out microfinance operations.                  Fresh Issue Size                            Rs2,485.8 mn
                                                                            Share for Fresh Issue                 8.15mn shares
•   SSFB has a network of 554 banking outlets across 13 states and UT in
    country providing services to 1.44 mn customers                      OFS Issue Size                           Rs3,337.6 mn

Valuation: At higher price band of Rs305, the issue is valued at P/BV of Total Issue Size                         Rs5,823.4 mn
2.0x (on post issue BVPS).                                               Bidding Date                     Mar 17' 2021 - Mar 19' 2021
                                                                            MCAP at Higher Price
Below are few key observations of the issue: (continued in next page)       Band
                                                                                                                 Rs32,369.9 mn

•   SSFB commenced operations as an SFB on Jan 23’ 2017 pursuant to                                         Axis Capital Limited, ICICI
    receipt of RBI’s final approval. Prior to commencement of operations Book Running Lead              Securities Limited, IIFL Securities
    as a SFB, the company was operated as an NBFC – MFI carrying out Manager                              Limited, SBI Capital Markets
    micro-finance operations.                                                                                        Limited
                                                                            Registrar                   Kfin Technologies Private Limited
•   Public issue is brought mainly to comply the RBI’s regulation to list
    SFB within three years of from reaching the net worth of Rs5,000 mn. Industry                                    Banking
    SSFB is required to be listed by Nov 29’ 2020 but due to bank request,
    the RBI gave six months extension to May 2020 for listing.
                                                                               Retail application money at higher cut-off price per lot
•   Micro loan categories as inclusive finance constituted 70.4% of gross
    loan portfolio in 9MFY21. SSFB disburses micro loans under the joint    Number of shares per lot                      49
    lending group model (JLG) to customers in unbanked and                  Application Money                    Rs14,945 per lot
    underbanked predominately in urban and semi-urban locations.
    Ticket size of unsecured micro loan under JLG ranges between
    Rs10,000 and Rs52,500 predominately extended to woman                   Allocation Detail
    customers. Average tenure of loan is up to two years and bank
    earned interest between 20.5% - 25.5% per annum on these loans.         Qualified Institutional
                                                                                                                        50%
                                                                            Buyers (QIB)
•   The bank is gradually diversifying the loan portfolio across other
    secured categories. Over the past years, SSFB started disbursing Non-Institutional
                                                                                                                        15%
    affordable   housing loans,        secured   business   loans   to Investors (NII)
    SME/MSME/Corporates, CV loans and unsecured business loans to
    micro/small enterprises and self-employed individuals.             Retail Individual Investors
                                                                                                                        35%
                                                                            (RIIs)
•   CV loans comprised 9.4%, affordable housing loan at 6.3% and
    secured business loans at 3.6% of the gross loan portfolio as on
    9MFY21.                                                                 Shareholding Pattern
                                                                                                              Pre-Issue         Post Issue
•   Coming to distribution front, SSFB has a network of 554 banking
    outlets across 13 states and UT in country providing services to 1.44   Promoter & promoter group           30.3%               28.0%
    mn customers. Business is largely skewed towards four states namely     Public                             69.7%             72.0%
    Maharashtra, Karnataka, Tamil Nadu and Odisha due to high               Total                              100.0%            100.0%
    presence of banking outlets in the respective states.
•   Owing to micro loans to unbanked region and weaker section, SSFB's                                Source: Choice Broking Research, RHP
    average "priority sector" loans, as a percentage of average net
    banking credit (ANBC) was 114.1% as on Dec 31’ 2021.                    Analyst
•   Gross advances portfolio stood at Rs39,082 mn in 9MFY21 which           Satish Kumar
    grew at a CAGR of 35% since FY18. The bank is aggressively making                                       (022-67079999; Ext:913,
    disbursement in CVs and affordable housing segment, the share of        Deskphone
                                                                                                               Mob:9167120440
    whose rose to 9.4% in 9MFY21 (0.5% in FY18) and 6.3% (1.3% in
    FY18).                                                                  Email                        satish.kumar@choiceindia.com

                                                                                                                                1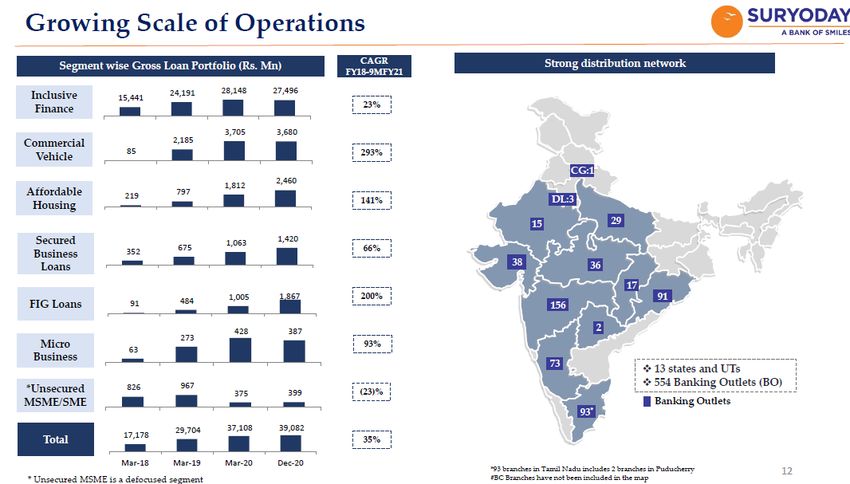
Continued……

 •   Average yield on CVs ranges between 10.5% - 19% and affordable housing at 9.7%-16%, which is significantly
     lower than micro loan.
 •   Average NIM stood at ~11% mainly due to higher share of unsecured micro loan. As the bank strategized to
     increase share of secured book, NIM is likely to decline in coming fiscals.
 •   Deposits improved significantly to Rs33,438 mn in 9MFY21 from Rs7,495.2 mn, though credit-to-deposits ratio
     stood at 113%. CASA share at 13.3% remained low compared to peers. To fund business growth, SSFB is focusing
     on retail customers and include senior citizens, upper middle-class individuals, self-employed and salaried
     individuals and HNIs in states Maharashtra, Tamil Nadu and Karnataka where the bank has distribution presence.
 •   SSFB performance remained strong during FY19-FY20 with average NIM of ~12%, RoE of 12% and robust
     profitability. However, during 9MFY21, bank performance has deteriorated as pandemic led lockdown and
     economic crises impacted weaker section of society severely. What makes us more concerned is proforma
     GNPA at 9.3%, SSFB’s pool of bad loans is the highest among listed peers. While the collection efficiency
     improved to above 100% (inclusive finance at 112.5% in Dec), re-surge of Covid cases in key business states
     such as Maharashtra and Karnataka to weigh on revival and further weaken assets quality.
 •   At higher price band of Rs305, demanding valuation of Rs32,370 mn is valued at P/BV of 2x post issue BVPS
     which appears expensive given weak assets quality outlook, concentrated business to some states, low CASA
     share and small business size. Asked valuation is in line with peers include Equitas/Ujjivan SFB but these banks
     are significantly large in business size and has superior fundamentals than SFFB. Post issue, RoE is unlikely to
     improve to double digit or FY20 level (RoE:11.4% in FY20) anytime soon. Further, SFFB is well capitalized with
     CAR at 41.2% despite this, the company comes with fresh issue of Rs2,486 mn.
 Considering all these parameters, we assign ‘Avoid’ rating to issue

Companies                                CMP       6M      12M                P/BV     NIM    GNPA     NNPA Proforma Proforma
                                                                  M Cap
(Rs mn)                                 (Rs/s)     R%       R%                 (x)      (%)    (%)      (%) GNPA (%) NNPA (%)
Suryoday Small Finane Bank               305        -        -   32,369.9      2.0     8.5%   0.8%     0.3%   9.3%
Equitas Small Finance Bank                59        -        -   67,142.0      2.0     8.5%   2.3%     0.7%   2.2%     0.7%
Ujjivan Small Finance Bank                34       1%     -17.0% 66,130.4      2.1     9.7%   1.0%     0.1%   4.8%     2.1%

AU Small Finance Bank                   1,255    76.0%    30.0% 3,85,285.0     7.1     5.4%    1.0%     0.2%      3.1%          1.3%

City Union Bank                          170     19.4%     -4.4% 1,25,528.2    2.2     4.2%    2.9%     1.5%                    3.4%

CreditAccess Grameen                     713      -2.2%   -13.0% 1,10,515.0    3.0     8.7%    0.9%       -       6.1%

Companies                                CAR      RoE       RoA       C/I       C/D    CASA   PAT   Net    Gross
                                                                                                                             Deposits
(Rs mn)                                  (%)       (%)      (%)      (%)        (%)     (%)  TTM Worth Advances
Suryoday Small Finane Bank *            41.2%    4.6%      1.1%     55.4%     113.1%   13.3%  732 15,951 39,082                33,438
Equitas Small Finance Bank              21.6%    11.2%     1.4%      60%       110%     25%  3,660 32,800 1,73,730            1,58,620
Ujjivan Small Finance Bank               27%     -1.8%     -0.3%     58%       117%     18%  -550 30,790 1,36,380             1,16,170
AU Small Finance Bank                    19%     20.8%     2.4%      49%       112%     22% 11,240 54,030 3,32,220            2,97,080
City Union Bank                          17%      6.8%     0.7%      41%        83%     27%  3,860 56,674 3,65,037            4,32,883
CreditAccess Grameen                     31%      2.8%     0.8%      44%          -       -  1,030 37,020 1,23,210
* - Annualized PAT, RoE, ROA are post issue (annualized, PAT), post issue net worth includes impact of pre-ipo
placements

                                                                                                 Source: Choice Broking Research, RHP
                                                                                                   © CHOICE INSTITUTIONAL RESEARCH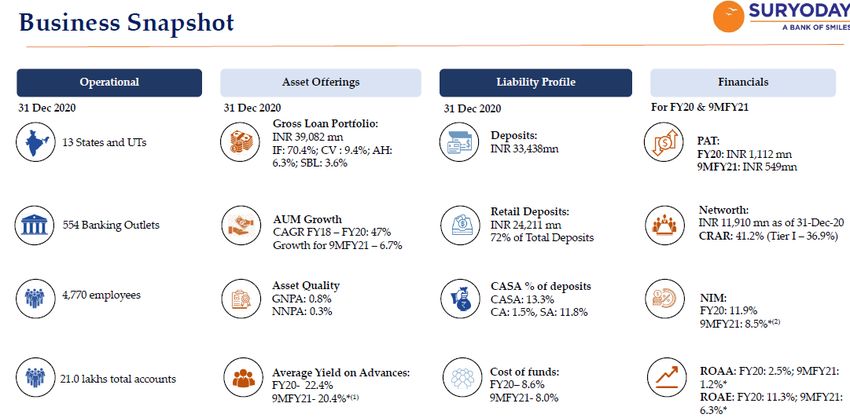
About the issue:
 •    Suryoday Small Finance Bank Limited (SSFB) is coming with initial public offer (IPO) of Rs5,823.4 mn.
 •    The issue comprises fresh issue of 8.15 mn shares and offer for sale (OFS) of 10.9 mn shares.
 •    Price band for issue is fixed at Rs303-Rs305.
 •    At the higher price band of Rs305, fresh issue size is stood at Rs2,485.8 mn while OFS size derives at Rs3,337.6 mn.
 •    Issue will open for subscription on Mar 17’ 2021 and close on Mar 19’ 2021
 •    Not more than 50% of the net offer shall be available for allocation on a proportional basis to a qualified institutional
      investors (QIIs).
 •    Further not less than 15% shall be available for allocation on a proportional to non-institutional investors (NIIs) and
      not less than 35% of net offer shall be available for allocation to Retail Institutional Investors (RIIs).
 •    OFS includes stake sell by private equity players. OFS comprises 4.4 mn shares by IFC, 2.0 mn shares by GAJA Capital
      fund 2.02 mn, 1.9 mn shares by DWM Mauritius, 0.75 mn shares by HDFC Holdings, 1.5 mn shares by IDFC First Bank,
      0.1 mn by Americorp Ventures, 0.2 mn by Kotak Life Insurance and 0.1 mn by Gaja Capital India AIF.
 •    Due to post issue equity dilution, promoters’ stake will reduce to 28% from 30.3%.
 •    Average cost of purchase for major selling shareholder namely IFC is Rs58.8.
 •    SSFB did pre-IPO placement of 5.2 mn shares at Rs291.75 per share. SBI Life Insurance, Axis Capital, Kiran Vyapar
      participated in the pre-IPO placement. Thereby, the size of fresh issue has been reduced by 5.2 mn shares pursuant to
      pre-IPO placement.
 •    Meanwhile SSFL’s board on Mar 2’ 2021 increased the fresh issue size by 1.76 mn equity shares.
 •    0.5 mn shares are reserved for employees. Furthermore, employee will get 10% discount for bidding in the
      employee reservation portion.
 Fresh issue proceed will be utilized to augment bank’s Tier-I capital base to meet bank’s future capital requirements

Indicative IPO process time line:

                                                                   Unblocking of
                           Offer Closes on
                                                                   ASBA Account
                            19-Mar-2021
                                                                   24-Mar-2021

     Offer Opens on                             Finalization of                                                 Commencement
      17-Mar-2021                               Basis of                             Credit to Demat            of Trading
                                                Allotment                            Accounts                   30-Mar-2021
                                                24-Mar-2021                          25-Mar-2021
Company introduction:
Suryoday Small Finance Bank (SSFB) incorporated as Suryoday Micro Finance Private Limited at Chennai, Tamil Nadu on Nov
10, 2008. The bank has been serving the customers over a decade in the unbanked and under banked segments in India and
promoting financial inclusion. Pursuant to receipt of RBI’s final approval, SSFB has started operations as a SFB on Jan 23’
2017. Prior to commencement of operations as an SFB, SSFB operated as an NBFC – MFI carrying out microfinance
operations and operated the joint liability group-lending model for providing collateral-free, small ticket-size loans to
economically active women belonging to weaker sections. SSFB commenced microfinance operations in 2009 and have
expanded operations across 13 states and union territories as of Dec 31’ 2020. With 554 banking outlets including 153
unbanked rural centres, the bank provides services to 1.44 mn customers. SSFB has greater presence in unban and semi-
urban locations and as of Dec 31’ 2020, 37.1%, 27. 8% and 28.8% of gross advances were from metropolitan, urban and
semi-urban areas respectively.
Source: Choice Broking Research, RHPBusiness Overview:
SSFB provides a number of credit products such as commercial vehicle loans, affordable housing loans, micro business loans,
unsecured micro and small enterprise and small and medium enterprise loans, secured business loans, financial intermediary
group loans and other loans. Gross loan portfolio grew at a CAGR of 39% to Rs39,082.3 mn in Dec 31’ 2020 from Rs17,177.8
mn in FY18. Loan portfolio is dominated by inclusive finance which accounted for 70.4% of gross loan portfolio followed by
CV book (9.4% of loans), affordable housing (6.3% of loans) and balance is covered by secured business loans, FIG loans,
micro business and unsecured MSME/SME.
On liability front, deposits grew at CAGR of 72% to Rs33,438.4 mn from Rs7,495.2 mn in FY18. Retail deposits constituted
72.4% of total deposits and CASA share stood at 13.3% as of Dec 31’ 2020. SSFB reported PAT of Rs1,112 mn in FY20 as
compared to Rs904 mn inFY19 and Rs114.9 mn in FY18. Owing to high yielding micro book, NIM margin stood at 11.9% in
FY20 and 8.5% in 9MFY21. Credit to deposits ratio sustained over 100% indicating the bank is fulfilling some portion of credit
growth with borrowings. Cost-to-income ratio improved to 47.1% in FY20 as compared to 64.4% in FY18. In 9MFY21, C/I
stood at 55.4%. The bank is well capitalized with CAR stood at 41.2% as of 9MFY21.
As per the RHP, the bank’s focus will be to grow customer base by providing quality customer service. SSFB will continue to
focus on the use of technology, explore partnerships with fintech companies, undertake data analytics to better understand
the requirements of customers, improve operational efficiency and further reduce costs. As SFFB grows operations, it
strategized to look to selectively expand network of banking outlets across newer geographies and also penetrate further
into existing markets. Further it also intends to engage with BC partners and payment banks to leverage their network to
help expand and increase market share.
Key Financials (Rs mn)
Particulars FY18 FY19 FY20 9MFY21
Net Interest Income 1,658.3 3,403.7 4,909.1 3,532.8
Net Interest Margin 10.4% 12.8% 11.9% 8.5%
Total Income 2,038.7 4,073.0 5,783.6 4,182.0
Growth (%) 99.8% 42.0%
Pre-Prov. Operating Profit 725.0 2,165.5 3,062.4 1,865.7
Adjusted PAT 114.9 904.0 1,112.0 548.7
Growth (%) 686.6% 23.0%
Advances 15,686.8 26,795.8 35,319.4 37,822.6
Deposits 7,495.2 15,934.3 28,487.2 33,438.4
RoA 0.5% 3.1% 2.4% 1.1%
RoE 2.1% 12.7% 11.4% 4.6%
GNPA 3.5% 1.8% 2.8% 0.8%
CAR (Basel III) 43.4% 40.2% 35.4% 41.2%
BVPS 50.7 83.0 100.5 150.3
P/BV (x) 6.0 3.7 3.0 2.0
Source: Choice Broking Research, RHPCompetitive strengths:
• Customer centric approach with a focus on financial inclusion
• Diversified assets portfolio with a focus on retail operations
• Fast evolving granular deposits franchise
• Leveraging emerging technologies to enhance digital footprint
• Strong credit processes and robust risk management framework
• Track record of strong financial performance and cost-efficient operations
• Multiple distribution channels
Business strategy:
• Expand assets portfolio while focusing on secured lending
• Strengthen retail liability franchise
• Expand geographic presence and penetrate further into existing
geographies
Risk and concerns:
• Significant rise in proforma slippages due to Covid led economic
slowdown
• Business skewed to some states like Maharashtra, Karnataka and
Tamil Nadu
• Weak assets quality outlook
• Increased competition in banking industry
© CHOICE INSTITUTIONAL RESEARCHFinancial statements:
Rs mn
Profit And Loss Statement Financial Ratios
Particulars FY18 FY19 FY20 9MFY21 Particulars FY18 FY19 FY20 9MFY21
Interest Earned 2,868.8 5,301.1 7,666.9 6,243.5
Return / Profitability Ratios (%)
Growth (%) 84.8% 44.6%
Net interest margin (NIM) 10.4% 12.8% 11.9% 8.5%
Interest Expended 1,210.5 1,897.3 2,757.8 2,710.7
Growth (%) 56.7% 45.4% Yield on advances 16.4% 23.2% 22.4% 20.4%
Yield on investments 7.2% 6.9% 7.2% 6.9%
Net Interest Income 1,658.3 3,403.7 4,909.1 3,532.8
EPS (Diluted) (Rs) 1.08 8.52 10.48 5.17
Net Interest Margin 10.4% 12.8% 11.9% 8.5% RoA 0.5% 3.1% 2.4% 1.1%
Other Income 380.4 669.2 874.5 649.2 RoE 2.1% 12.7% 11.4% 4.6%
% of Interest Income 13.3% 12.6% 11.4% 10.4%
Cost of Deposits 3.3% 7.1% 8.2% 7.6%
Total Income 2,038.7 4,073.0 5,783.6 4,182.0
Growth (%) 99.8% 42.0%
Operating ratios (%)
Operating & Other expenses 1,313.8 1,907.4 2,721.2 2,316.4 Credit to Deposit (C/D) 209.3% 168.2% 124.0% 113.1%
Pre-Prov. Operating Profit 725.0 2,165.5 3,062.4 1,865.7 Cost-to-income (C/I) 64.4% 46.8% 47.1% 55.4%
Provisions and contigencies 546.6 738.3 1,518.6 1,165.1 CASA (share) 11.0% 11.2% 11.4% 13.3%
P&C % of Advances 3.5% 2.8% 4.3% 3.1% Investment / Deposit (I/D) 41.5% 41.7% 28.4% 45.2%
Operating Profit before Tax 178.4 1,427.2 1,543.8 700.6 Non interest income / Total
Growth (%) 700.2% 8.2% 18.7% 16.4% 15.1% 15.5%
income
Pre-tax Margin % 8.7% 35.0% 26.7% 16.8%
Capitalization Ratios (%)
Tax 63.4 523.3 431.8 151.9
% of PBT 35.6% 36.7% 27.0% 27.0% CET 40.2% 38.7% 34.3% 36.9%
Reported PAT 114.9 904.0 1,112.0 548.7 Tier-1 40.2% 38.7% 34.3% 36.9%
Net Profit Margin % 5.6% 22.2% 19.2% 13.1% Tier-2 3.2% 1.6% 1.1% 4.2%
Extrodinary Income CAR (Basel III) 43.4% 40.2% 35.4% 41.2%
Adjusted PAT 114.9 904.0 1,112.0 548.7 Equity / Assets 25.0% 23.4% 19.9% 18.8%
Growth (%) 686.6% 23.0%
Loans / Assets 72.8% 71.2% 65.8% 59.6%
Balance Sheet
Investments / Assets 14.4% 17.7% 15.1% 23.8%
Particulars FY18 FY19 FY20 9MFY21 Asset Quality ratios (%)
Cash and balance with Reserve GNPA 3.5% 1.8% 2.8% 0.8%
308.2 483.0 605.3 889.0
Bank of India…….. NNPA 1.9% 0.4% 0.6% 0.3%
Balances with banks and money Coverage Ratio 47.5% 75.7% 79.6% 57.7%
1,763.4 2,280.6 7,770.7 7,442.6
at call and short notice Per Share Data (Rs)
Investments 3,113.4 6,643.9 8,082.0 15,114.4
EPS (Diluted) 1.1 8.5 10.5 6.9
Advances 15,686.8 26,795.8 35,319.4 37,822.6
Fixed assets 135.4 189.8 387.3 433.6 BVPS 50.7 83.0 100.5 150.3
Other assets 552.4 1,218.9 1,480.5 1,801.9 Valuation ratios (x)
TOTAL ASSETS 21,559.6 37,612.0 53,645.2 63,504.1 P/E (x) 281.7 35.8 29.1 44.2
P/BV (x) 6.0 3.7 3.0 2.0
Capital 675.0 815.8 865.9 891.9 Growth ratios (%)
Reserves and Surplus 4,709.9 7,987.8 9,796.4 11,017.8 Advances 70.8% 31.8%
Deposits 7,495.2 15,934.3 28,487.2 33,438.4
Deposits 112.6% 78.8%
Borrowings 7,178.3 11,242.3 12,646.2 14,870.8
Other liabilities and provisions 1,501.3 1,631.9 1,849.6 3,285.3 Net interest income 105.3% 44.2%
TOTAL CAPITAL AND Interest Earned 84.8% 44.6%
21,559.6 37,612.0 53,645.2 63,504.1
LIABILITIES…...…… PAT 686.6% 23.0%
Source: Choice Broking Research, RHP
© CHOICE INSTITUTIONAL RESEARCHEquity Research Team
Name Designation Email id
Sundar Sanmukhanis Head of Research - Fundamental sanmukhanis@choiceindia.com
Satish Kumar Research Analyst satish.kumar@choiceindia.com
Rajnath Yadav Research Analyst rajnath.yadav@choiceindia.com
Ankit Pareek Research Associate ankit.pareek@choiceindia.com
Yug Tibrewal Research Intern yug.tibrewal@choiceindia.com
Disclaimer
es
This is solely for information of clients of Choice Broking and does not construe to be an investment advice. It is also not intended as an offer or solicitation
for the purchase and sale of any financial instruments. Any action taken by you on the basis of the information contained herein is your responsibility alone
and Choice Broking its subsidiaries or its employees or associates will not be liable in any manner for the consequences of such action taken by you. We have
exercised due diligence in checking the correctness and authenticity of the information contained in this recommendation, but Choice Broking or any of its
subsidiaries or associates or employees shall not be in any way responsible for any loss or damage that may arise to any person from any inadvertent error in
the information contained in this recommendation or any action taken on basis of this information. This report is based on the fundamental analysis with a
view to forecast future price. The Research analysts for this report certifies that all of the views expressed in this report accurately reflect his or her personal
views about the subject company or companies and its or their securities, and no part of his or her compensation was, is or will be, directly or indirectly
related to specific recommendations or views expressed in this report. Choice Broking has based this document on information obtained from sources it
believes to be reliable but which it has not independently verified; Choice Broking makes no guarantee, representation or warranty and accepts no
responsibility or liability as to its accuracy or completeness. The opinions contained within the report are based upon publicly available information at the
time of publication and are subject to change without notice. The information and any disclosures provided herein are in summary form and have been
prepared for informational purposes. The recommendations and suggested price levels are intended purely for stock market investment purposes. The
recommendations are valid for the day of the report and will remain valid till the target period. The information and any disclosures provided herein may be
considered confidential. Any use, distribution, modification, copying, forwarding or disclosure by any person is strictly prohibited. The information and any
disclosures provided herein do not constitute a solicitation or offer to purchase or sell any security or other financial product or instrument. The current
performance may be unaudited. Past performance does not guarantee future returns. There can be no assurance that investments will achieve any targeted
rates of return, and there is no guarantee against the loss of your entire investment.
POTENTIAL CONFLICT OF INTEREST DISCLOSURE (as on date of report) Disclosure of interest statement – • Analyst interest of the stock /Instrument(s): - No. •
Firm interest of the stock / Instrument (s): - No.
CONNECT US Choice Equity Broking Pvt. Ltd.
Choice House, Shree Shakambhari Corporate Park, Plt No: -156-158,
Any kind of queries on RESEARCH, J.B. Nagar, Andheri (East), Mumbai - 400 099.
You can contact us on: 022 - 6707 9999 +91-022-6707 9999
+91-022-6707 9959
www.choiceindia.com
© CHOICE INSTITUTIONAL RESEARCH
9You can also read