Changing Dynamics of Rani-Chapori River Island of Brahmaputra - sersc
←
→
Page content transcription
If your browser does not render page correctly, please read the page content below
International Journal of Advanced Science and Technology
                                                                Vol. 29, No. 5, (2020), pp. 2253 - 2267

Changing Dynamics of Rani-Chapori River Island of Brahmaputra
                        River, Assam
          Pranab Dutta1, Syed Muzaffar Saba Anjum2, *Kasturi Borkotoky3,
                      *Syeda Fahima Shahnaz Sultana4, Sujata Medhi5
          1,3,4,5
                  Research Scholar, Geography Department, Gauhati University
                               2
                                 Ex-Student, Gauhati University
                     1
                       dutta.pra111@gmail.com, 2 ms6768@gmail.com
       3
         kasturi@gauhati.ac.in,4shehnu014@gmail.com, 5sujata@gauhati.ac.in

                                          Abstract
   The fluvial processes carried on by the river Brahmaputra have resulted in the creation
of a number of river islands and sand bars which are of much ecological significance.
Rani Chapori is such an island created and affected by the river. The study indicated the
importance of bankline migration and sediment composition of the river island upon the
morphology and stability of the island. Using the sieving instrument and pipetting method,
the sand texture was analysed and using remote sensing data and related software, the
bankline shift was found out. The results revealed that the morphology of the river island
has continuously undergone changes as a result of the fluvial actions of the river and the
sediment characteristics too played a role in it. The size of the river island in 2016
increased by about 9.86% in comparison to 2005 and decreased by 8.24% in comparison
to 1961, while the perimeter has decreased by 0.13% in 2016 as compared to 2005 and
about 10.98% with respect to 1961. The total bankline shift of the north bank in the
adjoining areas of the island in the period 1961-2016 was 2.8095 km towards the right as
a result of erosion while the left side shift was 0.453 km due to deposition. The right-side
shift of the south bank due to deposition was 0.67 km while the left side shift was 0.41 km
due to erosion. The unstable morphology of a river island affects the life that thrives on the
land and thereby, the ecosystem which makes it utmost necessary for the policymakers and
conservationists to shift their immediate focus to help preserve such river islands.

  Keywords: Bankline erosion, Bankline shift, Morphology, River Island, Sediment.

1. Introduction
   Rivers are dynamic entities [1] and they shape the very landscape in which we live.
Most of the big rivers of the world like the Brahmaputra are having been characterized by
multitudes of bars (chapori) and islands (char), many a time giving charland topography
[2]. Sand bars and river islands, the most dynamic fluvio-geomorphic landforms, are
characteristics of a braided river and are delineated by many fluvio-geomorphic conditions.
The braiding nature of the Brahmaputra river mostly occurs through channel shifting due
to bank erosion and formation of bars and islands in the form of mid channel bars, side
bars or point bars [3]. The Rani-Chapori river island is the first char one could find at the
downstream of Saraighat bridge, the narrowest point of the river Brahmaputra. Despite
being situated close to the city, presently agricultural and allied activities are the only
economic activities on this river island. The changes in the hydrologic and
sedimentological actions have caused increased braiding of the river in and around this
charland and as such, many problems have cropped up which needs a proper investigation
to understand the significant geomorphic situations. The charl and environment, both
physical and human, are governed by channel dynamics and the people living in these river
islands have to cope with the changing bankline due to erosional and depositional activities
of the river. The study, therefore, focuses on the understanding of the fluvio-geomorphic

   ISSN: 2005-4238 IJAST                                                                         2253
   Copyright ⓒ 2020 SERSC
International Journal of Advanced Science and Technology
Vol. 29, No. 5, (2020), pp. 2253 - 2267
characteristics of the Rani-Chapori river island to get a better picture of how the aspects of
river dynamics and the migration of banklines are important for the formation of volatile
geomorphic patterns and to formulate strategies for resolving the problems of the island
and for sustainable utilization of the resources.
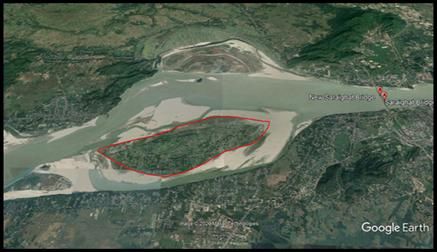
2. Study area
The Rani-Chapori river island, situated in the Brahmaputra river reach in the Kamrup
district of Assam, covers an area of 7.6 sq.km and is confined within 26°08 ʹ59ʺN to
26°10ʹ02ʺN latitudes and 91034ʹ52ʺE to 91038ʹ19ʺE longitudes. Geological history
indicates that the landform of Rani-Chapori is depositional in origin and results from the
long-term cumulative fluvial action of the Brahmaputra river and its tributaries. Due to the
alluvial characteristics and being a depository island, the Rani-Chapori river island is
predominantly residual in nature. The island is composed of granite and gneissic rocks
with the topmost layer of soil consisting of alluvium, sand, silt and clay. The island is leaf-
shaped with a gentle southern slope and comparatively steep northern slope; both the
slopes become gradual up to the river bank. The altitude of the area decreases as one
moves from east to west within the island with the average being 48.6 m. Thus, low-lying
areas, smooth terrains, gentle slopes, swamps, marshes and forest area forms peculiar relief
of this region. The famous Deeporbeel bird sanctuary lies 4 km south-east of the river
island and as a result, lot of migratory birds could also be seen on the island at the time of
winter. Apart from the river Brahmaputra, the drainage facilities available in and around
the Rani-Chapori river island are the rivers Bharalu, Basistha, Silsakobeel, Chalabeel,
Deeporbeel and also low marshy areas that act as impounding reservoirs during the rainy
season. As the entire Brahmaputra valley falls under the monsoon regime of south-east
Asia [4], the area of Rani-Chapori has been experiencing sub-tropical humid condition
with wet summer monsoon and dry winters.
Sualkuchi
Rani Chapori
Dharapur
Figure 1. Map of the Study Area
ISSN: 2005-4238 IJAST 2254
Copyright ⓒ 2020 SERSC
International Journal of Advanced Science and Technology
                                                                Vol. 29, No. 5, (2020), pp. 2253 - 2267

3. Database and Methodology
3.1.Database

   Both primary and secondary data are used for this study. Primary data have been
collected directly from the field through field observations, both, during dry and post-
monsoon periods. Sand samples have been collected from different sites to analyse
sediment behaviour. Secondary data includes collection of published data from the
Statistical Handbook of Assam, 2014 and Geological Survey of India topographical maps
and satellite imageries.

3.2. Methodology

   The methodology is based on the deductive and empirical-analytical method of
investigation. The various steps of the study are mainly categorized into three stages. Pre-
Field work includes referring to previous literature, relevant books, journals, published
papers, souvenirs, map etc. Delineation of basin area and base maps on different geo-
environmental aspects on the basis of topographical sheets of SOI with 1:50,000 scale and
satellite imageries of various years and objective oriented schedule cum questionnaire were
prepared with special focus on geo-environmental properties. Field work includes
collection of sand samples from different sites of the study area to examine the grain size
of the river island. The household survey was carried out with the prepared schedule cum
questionnaire and the seasonal changing pattern of the hydrological characteristics of the
river was noticed from field observations in different seasons. Post-Field Work includes
anassessment of different morphometric techniques of the river island. The sand texture
was analysed with the help of sieving instrument, pipetting method and related graphical
tools for its representation. Finally, the collected data have been analysed through different
statistical techniques and the software used include Microsoft word, Excel, ARC GIS,
Google Earth, etc.

4. Results and Discussion
4.1.Morphological changes

   The shape of Rani-Chapori river island has been changing continuously ever since its
formation. Generally, the channel bars are not stationary and their shape and size are
modified by flow [5]. In the year 1961 the Rani-Chapori river island was a group of six
small islands with an area of 8.5 sq.km and a perimeter of 14.1 km. The shape was more or
less irregular with the longest length being 6.3 km. The area in 1993 increased to 8.9
sq.km. The major change between 1961 and 1993 is that the former had a group of six
small islands which became one single and large island in 1993. The shape of the island
had become lenticular with one extreme point in the north-east and the other extreme point
in the south-west direction. There has been an increase in area of the island by 4.70 %
since 1961 but a decrease in the perimeter by about 0.4 km. However, in 2005, heavy
erosion could be noticed in the eastern part of the island on both northern and southern
parts and as a result, the eastern part became narrower. The total area of the Rani-Chapori
river island in 2005 was 7.1 sq.km with a decrease of 20.22 % from the year 1993. The
perimeter of the island also decreased by 9 % from 13,700m in 1993 to 12,568m in 2005.
In terms of area, there was no significant change in the period 2012 to 2016. The area of
the river island has increased by 9.86% in 2016 as compared to 2005 while the perimeter
has decreased by 0.13%. For the time period 1961-2016, a decrease in area was seen in
2005 which was followed by a gradual increase in the subsequent years. But, the perimeter
of the river island has been continuously decreasing since 1961; the perimeter in 2016

   ISSN: 2005-4238 IJAST                                                                         2255
   Copyright ⓒ 2020 SERSC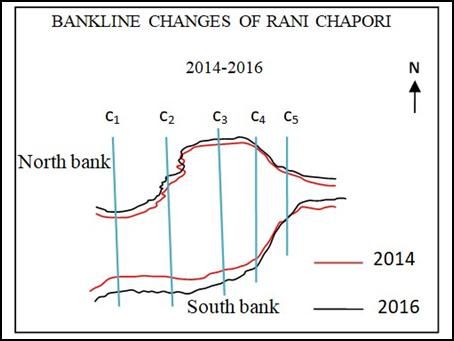
International Journal of Advanced Science and Technology
                                                                Vol. 29, No. 5, (2020), pp. 2253 - 2267

having been reduced by 10.98% of 1961. Since 2005 till present, there has been continuous
overall aggradation in the river island. Although there have been continuous erosional and
depositional activities going on in the river island, the rate of deposition is higher than the
rate of erosion since 2005.
              Table 1. Change in Area and Perimeter of the Sandbar

     Year         Area in       % change of       Perimeter                      % change in
                 (sq.km)            area           (meter)                        perimeter
    1961            8.5                -           14,100                              -
    1993            8.9             4.70           13,700                           -2.91
    2005            7.1            -20.22          12,568                           -9.00
    2012            7.6             7.04           13,568                            7.33
    2014            7.6              -             13,568                              -
    2016            7.8           2.63             12,552                           -8.05
Source: SOI Toposheet 1:50,000, Satellite Image, Google Earth.

       Figure 2. Shape of river island, 1961           Figure 3. Shape of river island, 1993

      Figure 4. Shape of river island, 2005            Figure 5. Shape of river island, 2012

   ISSN: 2005-4238 IJAST                                                                         2256
   Copyright ⓒ 2020 SERSC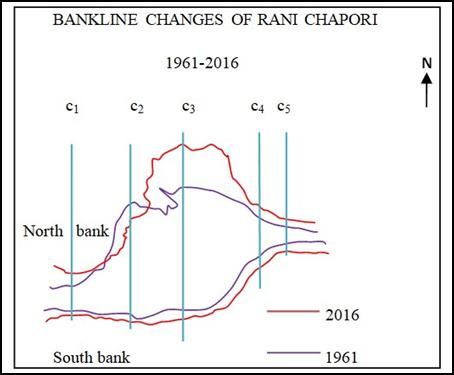
International Journal of Advanced Science and Technology
                                                               Vol. 29, No. 5, (2020), pp. 2253 - 2267

           Figure 6. Shape of river island, 2014           Figure 7. Shape of river island, 2016

4.2. Sediment Composition of the Sandbar

   Riverine areas covered by the volatile flow of waters in the charland areas have always
been characterized by sand, silt and clay deposits in addition to other kinds of debris
carried by the streams at their different points and places [6]. Sedimentation plays an
important role in the formation of alluvial landforms like river islands and sand bars. The
sediment-soil composition of Rani-Chapori is mostly composed of varying proportions of
fine sand, silt with the occasional presence of minor amounts of clay. According to the
sedimentological research carried out on the surface soil at different locations of the river
island, around 95% of the sediments fall under the size category of 0.35mm to 0.125 mm
and relative (phi φ) size of 1.5φ to 3.0φ. The colour of the soil ranges between grey to
whitish grey. The nature of the soil is fine to medium sized, graded sand covered often
mixed with clay nearer to banks.

Figure 8. sediment size distribution of sample          Figure 9. sediment size distribution of
                    site 1                                           sample site 2

         Source: based on appendix 1                          Source: based on appendix 2

   ISSN: 2005-4238 IJAST                                                                        2257
   Copyright ⓒ 2020 SERSC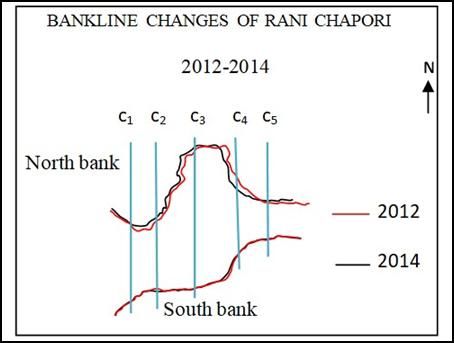
International Journal of Advanced Science and Technology
                                                                Vol. 29, No. 5, (2020), pp. 2253 - 2267

    Figure 10. sediment size distribution              Figure 11. sediment size distribution of
               of sample site 3                                     sample site 4

   Source: based on appendix 3                         Source: based on appendix 4

                                                       Figure 13. sediment size distribution of
    Figure 12. sediment size distribution                           sample site 6
               of sample site 5
                                                       Source: based on appendix 6
   Source: based on appendix 5

4.3. Erosional and Depositional Pattern around the Sandbar

   Riverbank erosion and deposition is a natural phenomenon of a river and is a significant
problem worldwide associated with land loss whereas deposition is the product of erosion
itself. Land loss as a consequence of riverbank erosion not only threatens the existence of
infrastructures or agricultural lands near to the riverbank but also poses a threat to aquatic
habitats and causes sedimentation downstream due to the generation of fine-grained
sediments [7]. In India, most of the hydrological challenges are owed to the high sediment
load of the rivers which ultimately results in riverbed aggradations, bank erosion and
channel widening [8]. However, riverbank erosion in the Brahmaputra river is mainly
caused due to high flood discharge of the river, bed slope, soil composition and bed and
bank materials. The severity of the bankline change in the adjoining areas of Rani-chapori
river island is worth mentioning. The bankline of the Brahmaputra river for most of the
part is extremely unstable characterized by highly variable shifting. The average shifts of
bankline for both, north and south banks for the period 1961 to 2016 of the adjoining areas
of Rani-chapori river island is shown in the table 2 and 3

   ISSN: 2005-4238 IJAST                                                                         2258
   Copyright ⓒ 2020 SERSC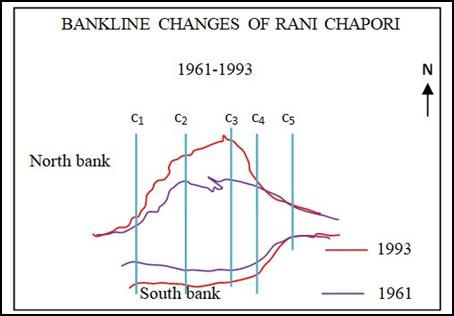
International Journal of Advanced Science and Technology
                                                                  Vol. 29, No. 5, (2020), pp. 2253 - 2267

                    Table 2. Average Shift of Banklines(1961-2016)

 Bankline         Year of        Right side        Cause of            Left side         Cause of
 location         Change            shift            shift                shift            shift
                                 (average                              (average
                                  shift in                              shift in
                                   kms.)                                 kms.)
                1961-2016           1.4                                   0.4
                1961-1993            0.882                                 -
   North                                            Erosion                             Deposition
                2005-2012            0.475                               0.01
                2012-2014            0.0375                              0.02
                2014-2016            0.015                              0.023
                1961-2016             0.32                               0.10
                1961-1993              -                                 0.15
   South                                          Deposition                              Erosion
                2005-2012             0.01                               0.15
                2012-2014             0.02                               0.01
                2014-2016             0.32                                 -
Source: Based on Toposheet, Satellite image and Google Earth maps

               Table 3. Total Average Shift of Banklines (1961-2016)

    Bankline                Average shift in kms.            Remarks
    location          Right side shift        Left side
                                                shift
  North Bank                2.8095             0.453            2.8095kms = due to erosion
                                                              0.453 kms = due to deposition
  South Bank                 0.67               0.41            0.41     kms = due to erosion
                                                              0.67     kms = due to deposition
Source: Based on Table 2
   From the above tables, it is clear that the total average shift of the bankline in the north
bank of the study area during 1961-2016 is 2.8095 km due to erosional activities while the
river causes deposition along this bank to a total average of 0.453 km. On the other hand,
the total average change on the south bank is estimated to be 0.67 km due to deposition
and 0.41 km mainly due to degradation. Thus, there occurs heavy erosional activities on
the north bank of the river. However, there is not much change in the south bank channel
migration with occasional erosion and deposition, mainly due to the embankment
constructed by the government and timely maintenance by the local people. A study by
Bordoloi (1995), indicates that the recession of the bankline of the Brahmaputra river is
attributed to the following factors- ( i ) fluctuation of water level of the river, (ii) rate of
scour and deposition occurring on the river during the flood, (iii) the lateral migration of
the channel, (iv) the number and position of major channel being active during the flood
stages, (v) nature of cohesiveness and variability in the composition of the bank material ,
(vi) the intensity of bank slumping, (vii) the lack of resistance of soils of the area to

   ISSN: 2005-4238 IJAST                                                                           2259
   Copyright ⓒ 2020 SERSC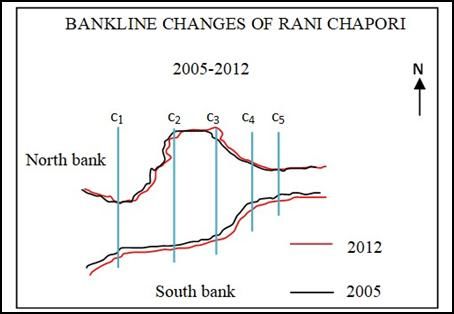
International Journal of Advanced Science and Technology
                                                                 Vol. 29, No. 5, (2020), pp. 2253 - 2267

erosion by the river, (viii) the low lying nature of the area dominated by the swamps, beels,
and abundant courses of river and (ix) formation and movement of large bedforms.

                           Table 4. Bankline Change (1961-1993)

            NORTH BANK                             SOUTH BANK
CrossSection Change in     Remark         Cross       Change in                           Remark
    Site         kms.                    Section          kms.
                (w.e.f.                    Site         (w.e.f.
                1961)                                    1961)
     C1           0.2      Erosion         C1              0.1                            Erosion
     C2           1.6      Erosion         C2              0.2                            Erosion
     C3           2.5      Erosion         C3              0.2                            Erosion
     C4           0.1      Erosion         C4               0                                -
     C5          0.01      Erosion         C5              0.1                            Erosion
Source:Measured from Toposheet No. 78 N/12 and satellite imagery

                           Table 5. Bankline Change (2005-2012)

              NORTH BANK                                          SOUTH BANK

   Cross        Change in         Remark             Cross          Change in            Remark
  Section         kms.                              Section           kms.
    Site         (w.e.f.                              Site           (w.e.f.
                  2005)                                               2005)
     C1            0.1            Erosion              C1              0.1               Erosion
     C2              0.6          Erosion              C2               0.01           Deposition

     C3              1.1          Erosion              C3                0.2             Erosion
     C4             0.01         Deposition            C4                 0                   -

     C5              0.1          Erosion              C5                 0                   -

Source:Measured from Google Earth map of 2005 & 2012

                           Table 6. Bankline Change (2012-2014)

           NORTH BANK                             SOUTH BANK
   Cross    Change in     Remark         Cross      Change in  Remark
  Section      kms.                     Section        kms.
    Site      (w.e.f.                     Site        (w.e.f.
               2012)                                  2012)
    C1          0.02     Deposition        C1         0.001    Erosion
    C2          0.04       Erosion         C2          0.01    Erosion
    C3          0.03       Erosion         C3            -        -
    C4          0.06       Erosion         C4          0.02   Deposition
    C5          0.02       Erosion         C5            -        -
Source: Measured from Google Earth map of 2012 & 2014

   ISSN: 2005-4238 IJAST                                                                          2260
   Copyright ⓒ 2020 SERSC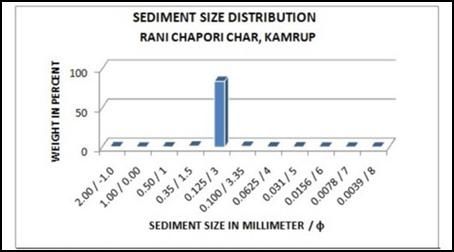
International Journal of Advanced Science and Technology
                                                                 Vol. 29, No. 5, (2020), pp. 2253 - 2267

                           Table 7. Bankline Change (2014-2016)

           NORTH BANK                              SOUTH BANK
  Cross      Change in     Remark         Cross     Change in                             Remark
 Section        kms.                     Section       kms.
   Site        (w.e.f.                     Site       (w.e.f.
               2014)                                  2014)
    C1          0.03     Deposition        C1          0.02                               Erosion
    C2          0.02       Erosion         C2          0.02                               Erosion
    C3          0.01       Erosion         C3          0.02                               Erosion
    C4          0.02     Deposition        C4          0.01                               Erosion
    C5          0.02     Deposition        C5          0.01                               Erosion
Source: Measured from Google Earth map of 2014 & 2016

                           Table 8. Bank line change (1961-2016)

               NORTH BANK                                          SOUTH BANK
  Cross           Change in         Remark          Cross              Change in             Remark
Section Site         kms.                         Section Site            kms.
                 (w.e.f. 1961)                                        (w.e.f. 1961)
    C1                1.4           Erosion              C1                0.4               Erosion
    C2                0.4          Deposition            C2                 0.2              Erosion
    C3                2.8           Erosion              C3                 0.5              Erosion
    C4                1.1           Erosion              C4                 0.2              Erosion
    C5                0.3           Erosion              C5                 0.3              Erosion
Source:Measured from Toposheet No. 78 N/12 & Google Earth map 2016

    Figure 14. Bankline change (1961-2016)                Figure 15. Bankline change (1961-1993)

   ISSN: 2005-4238 IJAST                                                                          2261
   Copyright ⓒ 2020 SERSC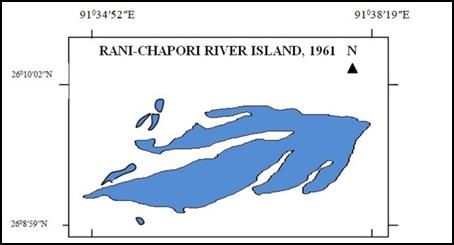
International Journal of Advanced Science and Technology
                                                                 Vol. 29, No. 5, (2020), pp. 2253 - 2267

   Figure 16. Bankline change (2005-2012)           Figure 17. Bankline change (2012-2014)

                            Figure 18. Bankline change (2014-2016)

   The nature of the bank materials acts as important functional factor for shifting of the
bankline of an alluvial river. The banks of the Brahmaputra including the Rani-Chapori
river island and the adjoining areas are mostly composed of fine sand which being lose
enough are easily eroded by the high velocity of flowing waters during the monsoon
season. The eroded bank materials along with the materials carried down by the river from
other sources are deposited at different places downstream. Therefore, erosion and
consequent deposition go on together unabatedly and ultimately a large area is covered by
a constellation of sand bars, river islands, etc. Thus, they help in most cases the shifting of
river banks.

5. Conclusion
   The study indicated that the river Brahmaputra has been playing an active role in the
shaping of the Rani-Chapori river island through continuous erosional and depositional
processes, the rate of the latter being higher. The bankline shift in the adjoining areas of the
river island has greatly affected the morphology of the island which ultimately affects the
natural and cultural environments of the island. Though much deposition has occurred and
the size of the island has increased as compared to 2005, the same cannot be predicted to

   ISSN: 2005-4238 IJAST                                                                          2262
   Copyright ⓒ 2020 SERSC
International Journal of Advanced Science and Technology
Vol. 29, No. 5, (2020), pp. 2253 - 2267
continue in the future as the river Brahmaputra is very dynamic. The sediment
characteristics along with the morphological stability of the river island are very important
for sustaining lives on it. The State, therefore, has to adopt measures to protect the island
and try to promote the Rani-Chapori river island since it is nearer to the city centre.
Appendices
Appendix No. 1
SIEVE SIEVE EQUIVALEN WEIGH WEIGH CUMULATIV
NO. HOLE T φ T (in gm) T (in %) E WEIGHT
SIZE (in PERCENT
mm)
10 2.00 -1.0 0 0 0
18 1.00 0.00 0 0 0
35 0.50 1.0 20.82 21.034 21.034
45 0.35 1.5 8.98 9.072 30.106
120 0.125 3 68.40 69.104 99.21
150 0.100 3.35 0.40 0.404 99.614
PIPETTIN 0.0625 4 0.14 0.141 99.755
G 0.031 5 0.15 0.151 99.906
METHOD 0.0156 6 0.05 0.050 99.956
0.0078 7 0.02 0.020 99.976
0.0039 8 0.02 0.020 99.996
Source: Based on sediment sample 1 collected from the field location 26°09ʹ56ʺN &
91°38ʹ12ʺE
Appendix No. 2
SIEVE NO. SIEVE EQUIVALENT WEIGHT WEIGHT CUMULATIVE
HOLE φ (in gm) (in %) WEIGHT
SIZE (in PERCENT
mm)
10 2.00 -1.0 5.77 6.105 6.105
18 1.00 0.00 0.24 0.253 6.358
35 0.50 1.0 0.62 0.656 7.014
45 0.35 1.5 3.54 3.745 10.759
120 0.125 3 82.89 87.70 98.459
150 0.100 3.35 1.25 1.322 99.781
PIPETTING 0.0625 4 0.06 0.063 99.844
METHOD 0.031 5 0.06 0.063 99.907
0.0156 6 0.05 0.052 99.959
0.0078 7 0.02 0.021 99.980
0.0039 8 0.01 0.012 99.992
Source: Based on sediment sample 2 collected from the field location 26°09ʹ45ʺN &
91°37ʹ26ʺE
ISSN: 2005-4238 IJAST 2263
Copyright ⓒ 2020 SERSCInternational Journal of Advanced Science and Technology
Vol. 29, No. 5, (2020), pp. 2253 - 2267
Appendix No.3
SIEVE NO. SIEVE EQUIVALENT WEIGHT WEIGHT CUMULATIVE
HOLE φ (in gm) (in%) WEIGHT
SIZE PERCENT
(in mm)
10 2.00 -1.0 0.39 0.44 0.44
18 1.00 0.00 0.02 0.02 0.46
35 0.50 1.0 0.26 0.29 0.75
45 0.35 1.5 1.17 1.34 2.09
120 0.125 3 84.23 96.54 98.63
150 0.100 3.35 1.04 1.19 99.82
PIPETTING 0.0625 4 0.06 0.06 99.88
METHOD 0.031 5 0.06 0.06 99.94
0.0156 6 0.01 0.01 99.95
0.0078 7 0.02 0.02 99.97
0.0039 8 0.03 0.03 100
Source: Based on sediment sample 3 collected from the field location 26°09ʹ58ʺN &
91°36ʹ53ʺE
Appendix No. 4
SIEVE NO. SIEVE EQUIVALENT WEIGHT WEIGHT CUMULATIVE
HOLE φ (in gm) (in %) WEIGHT
SIZE (in PERCENT
mm)
10 2.00 -1.0 0.08 0.084 0.084
18 1.00 0.00 0.04 0.042 0.126
35 0.50 1.0 0.15 0.16 0.286
45 0.35 1.5 0.89 0.931 1.217
120 0.125 3 93.43 97.70 98.917
150 0.100 3.35 0.72 0.75 99.667
PIPETTING 0.0625 4 0.1 0.105 99.772
METHOD 0.031 5 0.04 0.042 99.81
0.0156 6 0.01 0.01 99.82
0.0078 7 0.14 0.146 99.97
0.0039 8 0.03 0.03 100
Source: Based on sediment sample 4 collected from the field location 26°09ʹ58ʺN &
91°36ʹ35ʺE
Appendix No. 5
SIEVE NO. SIEVE EQUIVALENT WEIGHT WEIGHT CUMULATIVE
HOLE φ (in gm) (in %) WEIGHT
SIZE (in PERCENT
mm)
10 2.00 -1.0 0.12 0.19 0.19
18 1.00 0.00 0.00 0.00 0.19
35 0.50 1.0 0.06 0.09 0.28
45 0.35 1.5 0.06 0.09 0.37
ISSN: 2005-4238 IJAST 2264
Copyright ⓒ 2020 SERSCInternational Journal of Advanced Science and Technology
Vol. 29, No. 5, (2020), pp. 2253 - 2267
120 0.125 3 46.09 71.46 71.83
150 0.100 3.35 17.87 27.71 99.54
PIPETTING 0.0625 4 0.17 0.26 99.80
METHOD 0.031 5 0.08 0.18 99.92
0.0156 6 0.01 0.02 99.94
0.0078 7 0.02 0.03 99.97
0.0039 8 0.02 0.03 100
Source: Based on sediment sample 5 collected from the field location 26°09ʹ15ʺN &
91°35ʹ29ʺE
Appendix No. 6
SIEVE NO. SIEVE EQUIVALENT WEIGHT WEIGHT CUMULATIVE
HOLE φ (in gm) (in %) WEIGHT
SIZE (in PERCENT
mm)
10 2.00 -1.0 0.39 0.44 0.44
18 1.00 0.00 0.02 0.02 0.46
35 0.50 1.0 0.26 0.29 0.75
45 0.35 1.5 1.17 1.34 2.09
120 0.125 3 84.23 96.54 98.63
150 0.100 3.35 1.04 1.19 99.82
PIPETTING 0.0625 4 0.06 0.06 99.88
METHOD 0.031 5 0.06 0.06 99.94
0.0156 6 0.01 0.01 99.95
0.0078 7 0.02 0.02 99.97
0.0039 8 0.03 0.03 100
Source: Based on sediment sample 6 collected from the field location 26°09ʹ16ʺN &
91°34ʹ57ʺE
Acknowledgements
At the very onset, we would like to express our sincere gratitude to everyone involved
directly or indirectly with this research work. Without their continuous inspiration and
assistance, this research would have been futile. I would also sincerely like to thank our
respective guides and research scholars who helped us with their insights on this topic and
on how to carry out the research.
References
6.1. Book
[1]D. Knighton, “Fluvial Forms and Processes”, Sheffield (1984).
6.2. Unpublished Thesis
[2] N. Deka, “Fluvio- Geomorphic Characteristics of the Chars of Baghbor and its
Adjoining Area in the Brahmaputra River, Assam”, an unpublished M.phil dissertation,
Gauhati University (2005).
[3] A. Khanom, “Charland morphology and human occupance in selected chars of
Goalpara District, Assam”, an unpublished M.phil Dissertation, Gauhati University (2010).
ISSN: 2005-4238 IJAST 2265
Copyright ⓒ 2020 SERSCInternational Journal of Advanced Science and Technology
Vol. 29, No. 5, (2020), pp. 2253 - 2267
[6] N. Deka, “Fluvio- Geomorphic Characteristics of the Chars of Baghbor and its
Adjoining Area in the Brahmaputra River, Assam”, unpublished M.Phil dissertation,
Gauhati University (2005).
6.3. Journal Article
[4] D. C. Goswami, “Brahmaputra River, Assam, India: Physiography Basin Denudation
and Channel Aggradations”, Water Resources Research, Vol. 21, no.7, (1985), pp. 959-
978.
[5] D. C. Goswami, “Perspectives on Braided River Channels”, Geographical Horizon,
Vol. 1, (1989), pp. 18-20.
[7] S. E. Darby, and C. R. Throne, “Bank Stability Algorithm for Numerical Modelling of
Channel Width Adjustment”, University of Nottingham, (1995), University Park,
Nottingham, UK.
[8] P. Thakur, C. Laha, and S. P. Aggarwal, “River bank erosion hazard study of river
Ganga, upstream of Farakka Barrage using Remote Sensing and GIS”, Natural Hazards,
vol. 61, (2012), pp. 967-987.
Authors
Pranab Dutta,is a doctoral student in the Department of
Geography, Gauhati University, Assam, India. He has
successfully completed his master’s degree in Geography with
specialization in fluvial geomorphology. He is currently working
on watershed management.
Syed Muzaffar Saba Anjum,has successfully completed his
master’s degree in Geography from Gauhati University. His
specialization was in fluvial geomorphology.
Kasturi Borkotoky, is a doctoral student in the Department of
Geography, Gauhati University, Assam, India. She has
successfully completed her master’s degree in Geography with
specialization in fluvial geomorphology. She has also completed
M.Phil. degree in Geography on the topic “Analysis of suspended
variation in the upper reach of Brahmaputra river, Assam”.She is
presently working on riverine landscape study of Noa Dihing
river basin.
ISSN: 2005-4238 IJAST 2266
Copyright ⓒ 2020 SERSCInternational Journal of Advanced Science and Technology
Vol. 29, No. 5, (2020), pp. 2253 - 2267
Syeda Fahima Shahnaz Sultana, is a doctoral student in the
Department of Geography, Gauhati University, Assam, India. She
has successfully completed her master’s degree in Geography
from Aligarh Muslim University. Her area of interest is cultural
geography.
Sujata Medhi,is a doctoral student in the Department of
Geography, Gauhati University, Assam, India. She has
successfully completed her master’s degree in Geography with
specialization in Geoinformatics. She is currently working on
biodiversity loss and their impacts.
ISSN: 2005-4238 IJAST 2267
Copyright ⓒ 2020 SERSCYou can also read