Investigation of Groundwater Potential Using Remote Sensing and Geographical Information System (GIS) Techniques in Fakai Local Government of ...
←
→
Page content transcription
If your browser does not render page correctly, please read the page content below
International Journal of Current Science Research and Review
ISSN: 2581-8341
Volume 04 Issue 05 May 2021
DOI: 10.47191/ijcsrr/V4-i5-05, Impact Factor: 5.825
IJCSRR @ 2021                                                                                                     www.ijcsrr.org

        Investigation of Groundwater Potential Using Remote Sensing and
          Geographical Information System (GIS) Techniques in Fakai
                    Local Government of Kebbi State, Nigeria
                                           Mukhtar M.1, Umar A. B.2, Kaoje M. B.3
                                   1
                                    Science Department, College of Agriculture Zuru, Kebbi State
            2,3
                  Department of Physics, Kebbi State University of Science and Technology Aliero, Kebbi State, Nigeria

ABSTRACT: Groundwater is one of the most precious natural resource which supports human health, economic development and
ecological diversity. Remote sensing and Geographical Information System (GIS) Techniques have been effectively used for the
investigation of the potentiality of groundwater resource in Fakai local government area. The dataset for this research work are
Landsat 8 Operational land imager (OLI), ASTER DEM, Topographical map and Geological map from which the essential criteria
were obtained. The study used Weighted Linear Combination approach which involves mathematical weighing and ranking of the
criteria. Multi-criteria evaluation was carried out on all the criteria using the Weighted Linear Combination approach in ArcGIS
10.4. Spatial analysis was carried out on the derived result using the Suitability Index (SI) value created from pairwise comparison
analysis. The suitability map for groundwater recharge in the study area was hence produced using the suitability index. The result
shows four classes for the study area. The classes include highly suitable, moderately suitable, less suitable and least suitable. Thus,
the area most suitable for groundwater are found most towards the northern part, around the center and some regions in the northern
part of the study area this serves as an indicator that most of the study area has good potential for groundwater recharge.

KEYWORDS: Groundwater, Remote Sensing, GIS, Satellite Image, Imaging

INTRODUCTION
The investigation of groundwater potential using remote sensing and Geographical Information System is indeed a non-contact
scientific means of obtaining information on the suitability nature of groundwater resources in a particular area. This idea invariably
simplifies the application of other geophysical methods in groundwater exploration.
Groundwater is described as water found beneath the surface of the earth in underground streams and aquifers (Anomoharan, 2011).
Groundwater is one of the most natural resource that supports human health and ecological diversity (Vidhya and Vinay, 2018).
Laurence and Ojo (2012) noted that, groundwater is most generally free from odour, colour and has very low dissolved solid. It is
also not usually affected by natural factors such as drought. Groundwater resources are dynamic in nature as they grow with the
expansion of irrigation activities, industrialization, urbanization etc. (Das, 2008).
Remote sensing and GIS provide important data and tools for groundwater exploration (Jawad and Yahya, 2013). The application
of these tools has opened new paths in water resources studies. Remote sensing provides multi-spectral, multi-temporal and multi-
sensor data of the earth’s surface (Choudhhury et al., 2003). One of the greatest advantages of using remote sensing and GIS for
hydrological investigation and monitoring is its ability to generate information in spatial and temporal domain, which is very crucial
for successful analysis, prediction and validation (Sarma and Saraf, 2002). However, its ability for covering large and inaccessible
areas within short time becomes a very handy tool in accessing, monitoring and conserving groundwater resources.
Apart from the urban centers which has pipe borne water in Kebbi State, most rural communities depend on surface and groundwater.
Even in the cities and urban centers, many communities depend on shallow hand dug wells which are mostly private owned. The
prevailing drying up of boreholes, particularly during the dry season has become one of the major problems affecting the provision
of water in Fakai local government area. This then compelled most communities to revert to old system of acquiring drinking from
ponds, cut out streams and domestic wells which lead to re-occurrence of water borne diseases due to the contamination by wind,
animals and other factors. However, the lack of availability of water source in the study area had made the modern irrigation farming
extremely difficult.

358 *Corresponding Author: Mukhtar M.                                                             Volume 04 Issue 05 May 2021
                                                                                                       Available at: ijcsrr.org
                                                                                                             Page No.-358-366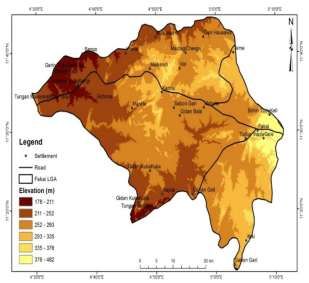
International Journal of Current Science Research and Review
ISSN: 2581-8341
Volume 04 Issue 05 May 2021
DOI: 10.47191/ijcsrr/V4-i5-05, Impact Factor: 5.825
IJCSRR @ 2021                                                                                                        www.ijcsrr.org

Drilling of unproductive boreholes over the years has been a matter of concern to the inhabitants of most rural communities in Fakai
local government area and most importantly to donor agencies and water managers in the country, thus, the need for the exploration
and exploitation of the weathered and fractured aquifers in the study area is necessary to identify potential sources for groundwater
and this could only be achieved by a combination of detailed geological, hydrological and integrated geophysical studies.

STUDY AREA
Fakai local government lies within longitude 50 7′ 0′′ E and latitude 110 30′ 0′′ N in southwestern part of Kebbi state, Nigeria. It covers
an area of about 2247 square kilometers. It is bounded in the south by Marafa and Kamtu, in the north by Bula Maimi and Maidanga,
in the west by Hawal and Rafin Gora and in the east by Mahuta and Garin Hausawa. The study area has a combination of high, low
and undulating terrain. The elevation ranges from 178 – 482m above sea level. The northeastern part of the area has a relatively
high elevation which gradually reduces towards the southeastern part of the area. This terrain is mostly rocky. Hence, there is greater
potential for groundwater recharge which is washed down from higher planes to lower areas.

                                                   Figure I: Map of the Study Area

MATERIALS AND METHODS
This study was accomplished by the use of the followings: ENVI 5.3, ArcGIS 10.4, Microsoft Excel 2013, Microsoft Word 2013,
Garmin handheld GPS receiver among others. The ENVI 5.3 and ArcGIS 10.4 were used for the image classification and GIS
analysis. The Microsoft Excel was used to input the field data while Microsoft Word was used for the report writing. The Garmin
handheld GPS receiver was used to collect coordinates on the field.
The method adopted for this work is basically in two phases in order to arrive at the suitability map. The factors influencing
suitability were first determined and secondly, multi criteria evaluation (MCE) was carried out in a GIS environment. In the MCE,
Weighted Linear Combination (WLC) approach which involves the ranking of each contributing factor was used. The datasets for
this work are those whose spatial references can be determined. These datasets are: geology map, geomorphology map, topographic
map, Landsat 8 OLI image, ASTER image and boundary of the study area.

Table I: Data and Data Sources
  S/N DATA TYPE                                SOURCES                                  RELEVANCE

   1.     LandSat 8 OLI (30m resolution)       Global Land Cover Facility (GLCF)        Land-use classification and lineament of the
                                                                                        study area
   2      ASTER DEM (30m Resolution)           Global Land Cover Facility (GLCF)        Geomorphology of the study area

359 *Corresponding Author: Mukhtar M.                                                               Volume 04 Issue 05 May 2021
                                                                                                         Available at: ijcsrr.org
                                                                                                               Page No.-358-366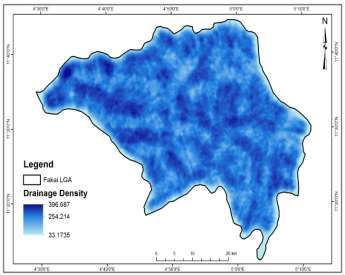
International Journal of Current Science Research and Review
ISSN: 2581-8341
Volume 04 Issue 05 May 2021
DOI: 10.47191/ijcsrr/V4-i5-05, Impact Factor: 5.825
IJCSRR @ 2021                                                                                                   www.ijcsrr.org

   3.     Topographical Map (1:50,000)       Office of the Surveyor General of      Drainage network and elevation of the study
                                             the Federation (OSGOF)                 area
   4.     Geological Map (1:250,000)         Nigerian     Geological      Survey    Identifying existing geology in the study
                                             Agency                                 area

DATA PROCESSING
Image Processing
The satellite images acquired for this work are Landsat 8 OLI scenes covering the study areas. Remotely-sensed spectral information
was obtained from LandSat8 OLI image, the area of study was subset with the boundary of the study area from a full scene covering
part of the Northwest Nigeria. The images were geometrically corrected in ENVI 5.3 environment to conform to the WGS 1984
UTM Zone 31 for spatial referencing compatibility with other data sets that will be used within a GIS environment. Radiometric
correction was also performed on the images to enhance visualization of features. A false colour composite (543) was produced
using bands which corresponds to the near infrared, red and green bands of the Landsat 8 OLI. Supervised classification using the
maximum likelihood algorithms was performed by creating a training sample of land use features such as water body, settlement,
cultivation, bare surface, rock outcrop and shrub land. The land use land cover map of the study was produced from the supervised
classification.
Lineament Extraction
The original false colour composite of Landsat 8 OLI subset image was corrected for atmospheric influence on the image. The
atmospheric correction was carried out on the image using the FLASH operation in ENVI 5.3 which converts the raw radiance and
DN data from imaging spectrometer and rescaled it to reflectance data. Therefore, all spectra are shifted to nearly the same albedo.
The resultant spectra can be compared with the reflectance spectra of the laboratory or filed spectra, directly. The panchromatic and
cirrus cloud (band 9) bands have not been used in this study. Image enhancement was performed to extract lineaments that would
not have been apparent from the images. Digital spatial operations were carried out on LandSat8 OLI image covering the area,
contrast, edge enhancement filters were applied to the image to enhance the visual quality. The image was subsequently exported
to ArcGIS 10.4, the lineaments seen on the image were digitized to produce a lineament map. Lineament density map was produced
from digitized lineaments using the line density operation in spatial analyst tool.
ASTER DEM Processing
 The ASTER satellite scenes covering the study areas were acquired for this study. The area of study was subset with the boundary
of the study area from the mosaic scenes covering the study area. The images were geometrically corrected in ENVI 5.3 environment
to conform to the WGS 1984 UTM Zone 31 for spatial referencing compatibility with other data sets that will be used within a GIS
environment. Radiometric correction was also performed on the images to enhance visualization of features. The subset image was
then exported to ArcGIS environment and the TIN generated with the spatial analyst tool in ArcGIS to produce the geomorphology
of the study area.
Processing of Analogue Datasets
The topographic and geology maps were scanned using A0 Scanner and georeferenced to WGS 1984 UTM Zone 31 for spatial
referencing compatibility with other data sets that will be used within a GIS environment. The maps were subset using the boundary
of the study area. A geodatabase was created for all maps and on-screen digitizing was carried out on all the maps to extract the
geology types, contours and drainage layer of the study area. The drainage layer was captured with their specific stream order.
Drainage density map was produced from digitized drainage using the line density operation in spatial analyst tool. The contour
lines were interpolated to create Digital Elevation Model while the layers of digitized geology types were converted to raster. The
slope was created from the DEM of the study area.
Data Analysis
The study used Weighted Linear Combination approach which involves mathematical weighing and ranking of the criteria. First,
the raster layer for Digital Elevation Model (DEM) was reclassified. Slope and Geomorphology were reclassified into five classes.
The same process was applied on the geology and land use raster layer. Drainage and lineament density maps were also reclassified
360 *Corresponding Author: Mukhtar M.                                                           Volume 04 Issue 05 May 2021
                                                                                                     Available at: ijcsrr.org
                                                                                                           Page No.-358-366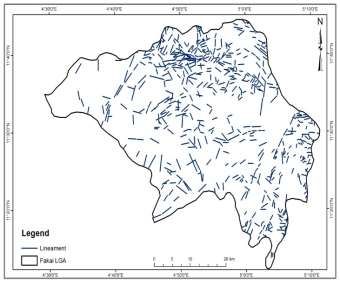
International Journal of Current Science Research and Review
ISSN: 2581-8341
Volume 04 Issue 05 May 2021
DOI: 10.47191/ijcsrr/V4-i5-05, Impact Factor: 5.825
IJCSRR @ 2021                                                                                                   www.ijcsrr.org

and ranked accordingly. Multi-criteria evaluation was carried out on all the criteria using the Weighted Linear Combination approach
in ArcGIS 10.4. Spatial analysis was carried out on the derived result using the Suitability Index (SI) value created from pairwise
comparison analysis. The suitability map for groundwater recharge in the study area was produced using the suitability index.

RESULT AND DISCUSSION
The results of the analysis performed on the different datasets discussed in methodology are presented below. Each dataset result,
its implications and suitability for groundwater recharge in the study area is critically analyzed and discussed extensively.
Drainage of the Study Area
Drainage pattern is one of the most important indicators of hydrogeological features, because drainage pattern, texture and density
are controlled in a fundamental way by the underlying lithology (Erhan et al., 2005). As drainage is an important physical factor
that greatly contributes to the groundwater recharge, the drainage density was used to evaluate the groundwater recharge availability
in the study area. Drainage of the study area is observed to be clustered and scattered across the study area. The drainage ranged
from 33.17 to 396.69 (figure 4). The areas with high drainage density have a greater potential for groundwater recharge occurrence
while areas with low drainage density have less potential for groundwater recharge.

                                            Figure II: Drainage map of the Study Area

                                          Figure III: Drainage Density of the Study Area

361 *Corresponding Author: Mukhtar M.                                                           Volume 04 Issue 05 May 2021
                                                                                                     Available at: ijcsrr.org
                                                                                                           Page No.-358-366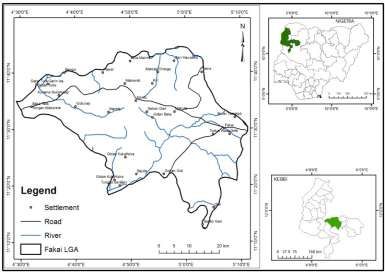
International Journal of Current Science Research and Review
ISSN: 2581-8341
Volume 04 Issue 05 May 2021
DOI: 10.47191/ijcsrr/V4-i5-05, Impact Factor: 5.825
IJCSRR @ 2021                                                                                                     www.ijcsrr.org

Lineament of the Study Area
Lineaments give a clue to movement and storage of groundwater and therefore are important guides for groundwater exploration
(Erhan et al., 2005). Lineament is one of the important physical parameters used in groundwater recharge; they act as
accommodation zones for water supply. Hence, the lineament density was used to evaluate suitable areas for the occurrence of
groundwater in the study area. Most of the lineaments are observed more clustered in the northern part while a few clustering
observed at southern part of the study area (figure IV). The lineament density ranged from 0 to 212 with most of the study area
having high density while very high density was observed towards the northern part (figure V). The areas having high lineament
density have greater potential for groundwater recharge occurrence while those having low lineament density have lesser potential
for groundwater recharge occurrence.

                                              Figure IV: Lineament of the Study Area

                                           Figure V: Lineament density of the Study Area

Topography of the Study Area
Topographic data is a vital element in determining the water table elevations (Erhan et al., 2005). The topography of an area plays
a very significant role in the groundwater recharge in a particular area. Since water responds to slope, a hilly area will discharge its
water and sediments to lower elevation areas. The study area has a combination of high, low and undulating terrain. The elevation
362 *Corresponding Author: Mukhtar M.                                                             Volume 04 Issue 05 May 2021
                                                                                                       Available at: ijcsrr.org
                                                                                                             Page No.-358-366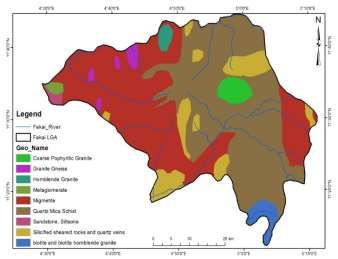
International Journal of Current Science Research and Review
ISSN: 2581-8341
Volume 04 Issue 05 May 2021
DOI: 10.47191/ijcsrr/V4-i5-05, Impact Factor: 5.825
IJCSRR @ 2021                                                                                                   www.ijcsrr.org

ranges from 178 – 482m above sea level. The northwestern part of the area has a relatively high elevation which gradually reduces
towards the southeastern part of the area (figure 6). This terrain is mostly rocky. Hence, there is greater potential for groundwater
recharge which is washed down from higher planes to lower areas.

                                            Figure VI: Topography of the Study Area

Geology of the Study Area
The geology is the most important factor in determining the occurrence of groundwater recharge because of the association to
particular rock type or group of rocks. Groundwater recharge is primary associated with quartz mica schist and sandstones siltstones.
The analysis shows that there are nine types of geology namely coarse pophyritic granite, granite gneiss, hornblende granite,
metaconglumerate, migmatite, quartz mica schist, sandstone, siltstone, silicified sheared rocks and quartz veins and biotite and
biotite hornblende granite, in the study area (figure VII). The migmatite is most dominant geology while sandstone and siltstone is
the least dominant in the study area. The migmatite/granite gneiss has least potential for groundwater recharge occurrence while
because of its hard resistant physical characteristics to weathering while the quartz micas schist/sandstone, siltstone have greater
potential for groundwater recharge because they are more likely to be weathered and fractured creating accommodation zones for
ground water accumulation.

                                              Figure VII: Geology of the Study Area

363 *Corresponding Author: Mukhtar M.                                                           Volume 04 Issue 05 May 2021
                                                                                                     Available at: ijcsrr.org
                                                                                                           Page No.-358-366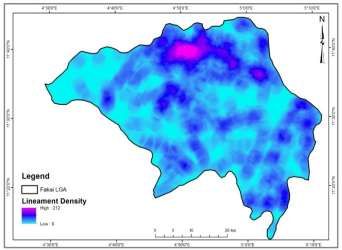
International Journal of Current Science Research and Review
ISSN: 2581-8341
Volume 04 Issue 05 May 2021
DOI: 10.47191/ijcsrr/V4-i5-05, Impact Factor: 5.825
IJCSRR @ 2021 www.ijcsrr.org
Geomorphology of the Study Area
The geomorphology provides information on the terrain existing in the area which is also an important factor in determining
groundwater recharge occurrence in the study area. The TIN created was used to evaluate the geomorphology of the study area. The
result of the analysis indicates that the geomorphology ranged from 176 to 482m in the study area (figure VIII). The lower
geomorphology was most dominant in the study area while high geomorphology was sparsely scattered in the study. The areas with
high geomorphology have higher potential for groundwater recharge occurrence while those with low geomorphology range have
less potential for groundwater recharge occurrence.
Figure VIII: Geomorphology of the Study Area
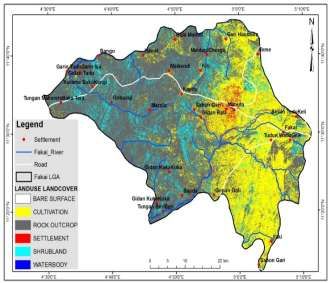
Land Use and Land Cover of the Study Area
Landuse and landcover are terrain characteristics that have significant impact on the spatial distribution of groundwater recharge.
Therefore, landuse and landcover classification was carried out to ascertain the natural terrain characteristics of the study area and
its contribution to groundwater recharge occurrence. The land use land cover identified five features namely waterbody, scrub land,
cultivation, bare surface, settlement and rock outcrop (figure IX). The rock outcrop was the dominant land use class covering a
significant area of the study area. The cultivation was next prominent land use class spatially distributed around the study area. The
least dominant feature in the study area was the bare surface occupying a very small area followed by the settlement. In determining
the site suitability occurrence, waterbody was rated most suitable for groundwater recharge.
Figure IX: Land Use Land Cover of the Study Area
*
364 Corresponding Author: Mukhtar M. Volume 04 Issue 05 May 2021
Available at: ijcsrr.org
Page No.-358-366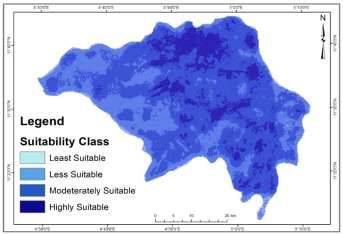
International Journal of Current Science Research and Review
ISSN: 2581-8341
Volume 04 Issue 05 May 2021
DOI: 10.47191/ijcsrr/V4-i5-05, Impact Factor: 5.825
IJCSRR @ 2021                                                                                                     www.ijcsrr.org

Suitability Areas of Groundwater Recharge in the Study Area
In the groundwater recharge suitability map, the result shows four classes for the study area. These classes include highly suitable,
moderately suitable, less suitable and least suitable (figure X). The highly moderately suitable areas are those areas with the highest
potential for groundwater recharge occurrence and these represent 14%. The area termed as moderately suitable are areas with
potential occurrence of groundwater recharge but its suitability is limited because of one or more criteria. These areas occupy most
of the study area representing 56.3%. The areas termed as less suitable for groundwater recharge occurrence but its accessibility and
quantity is severely limited by 2 or more criteria. These areas occupy 27.5% of the study area and the least suitable area occupy
about 2%. Thus, the area most suitable for groundwater recharge are found most towards the northern part, around the center and
some regions in the northern part of the study. This indicates that the study area has some good potential for groundwater recharge.

                                  Figure X: Groundwater Recharge Suitability of the Study Area

CONCLUSION
The research focused on the potentially and usefulness of remote and geographic information system in groundwater recharge
around Fakai local government area of Kebbi State. Analysis of several layers of data characterized by different geologic and
geodynamic settings allowed a shortlisting of a series of criterions useful to recognize the areas suitable for groundwater recharge
occurrence.
Groundwater recharge is an important process for sustainable management for both domestic consumption and industrial use. Hence,
this study aims at providing information on groundwater recharge site sustainability in Fakai local government area (LGA) of Kebbi
State. Spatial data such as geology, geomorphology, topography, Landsat 8 Operational Land Imager (OLI) and ASTER DEM were
analyzed and information generated from the image was integrated into GIS geodatabase. The spatial data were reclassified base on
their suitability for groundwater recharge, a suitability index was generated and suitability map produced. The result shows that
about 14% of the study area is highly suitable, 56.3% moderately suitable, 27.5% is less suitable while only 2% is least suitable for
groundwater recharge. Settlements including Maidagi, Chesgu and Kiri can be found within the highly suitable, Goburaji and Gidan
Bala within the moderately suitable, Gonan and Goli within the less suitable and Ifaki in the least suitable area.
Finally, the integration of integration of results from remote sensing techniques with field, geological and other ancillary confirmed
the value brought by the remote sensing application of groundwater recharge.

RECOMMENDATIONS
The study recommends that geophysical survey should be further carried in places of moderate to high potential regions to examine
the quantity of water.

REFERENCES
   1. Anomoharan, O. (2011), Determination of groundwater potential in Asaba, Nigeria Using Surface Geoelectric Sounding.
      International Journal of Physical Sciences, 6(33), 7651-7658.

365 *Corresponding Author: Mukhtar M.                                                             Volume 04 Issue 05 May 2021
                                                                                                       Available at: ijcsrr.org
                                                                                                             Page No.-358-366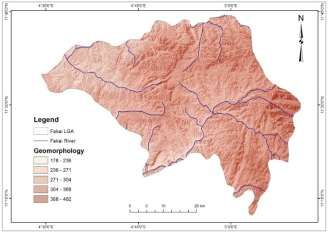
International Journal of Current Science Research and Review
ISSN: 2581-8341
Volume 04 Issue 05 May 2021
DOI: 10.47191/ijcsrr/V4-i5-05, Impact Factor: 5.825
IJCSRR @ 2021                                                                                           www.ijcsrr.org

    2.   ArcGIS, (2006), GIS Software, Version 9.2, Environmental System Research Institte (ESRI), New York.
    3.   Chowdhary, V.M., Rao, N. H. & Sarma, P. B. (2003), GIS based decision support system for groundwater assasment in
         irrigation project area. Agricultral water Management
    4.   Das, D. 2008), GIS Application in hydrological Studies, Department of Environmental Science,University of Kalyani,
         India.
    5.   Erhan, S. · Aysen, D. &· Mehmet, O. (2005), An Integration of GIS and Remote Sensing in Groundwater Investigations:
         A case study in Burdur, Turkey, Hydrogeology Journal, 13,826–834.
    6.   Jawad, T. A. & Yahya, Y. A (2013), Application of GIS and Remote Sensing to Groundwater Exploration in Al-Wala
         Basin in Jordan. Journal of Water Resource and Protection, 5, 962-971.
    7.   Lawrence, A. O. & Ojo, T. A. (2012), The use of Combine Geophysical Survey Method for Groundwater Prospecting in a
         Typical Basement Complex Terrain: Case Study of Ado Ekiti, Southwest Nigeria. Research Journal in Engineering and
         Applied Sciences 1(16), 362-376.
    8.   Sarma, B. & Saraf, A. K. (2002), Study of Land use Groundwater Relationship Using an Intergrated Remote Sensing
         Approach. International Journal of the Physical Sciences, 6 (33), 7651-7656.
    9.   Vidhya, S. & Vinay, Y. K. (2018) Identification of Groundwater Potential Zones using GIS and Remote Sensing,
         International Journal of Pure and Applied Mathematics,119,(17), 3195-3210.

Cite this Article: Mukhtar M., Umar A. B., Kaoje M. B. (2021). Investigation of Groundwater Potential Using Remote Sensing
and Geographical Information System (GIS) Techniques in Fakai Local Government of Kebbi State, Nigeria. International
Journal of Current Science Research and Review, 4(5), 358-366

366 *Corresponding Author: Mukhtar M.                                                     Volume 04 Issue 05 May 2021
                                                                                               Available at: ijcsrr.org
                                                                                                     Page No.-358-366
You can also read