Q4 & FY20 RESULT UPDATE - May 2020 - cloudfront.net
←
→
Page content transcription
If your browser does not render page correctly, please read the page content below
Q4 & FY20 RESULT UPDATE
       May 2020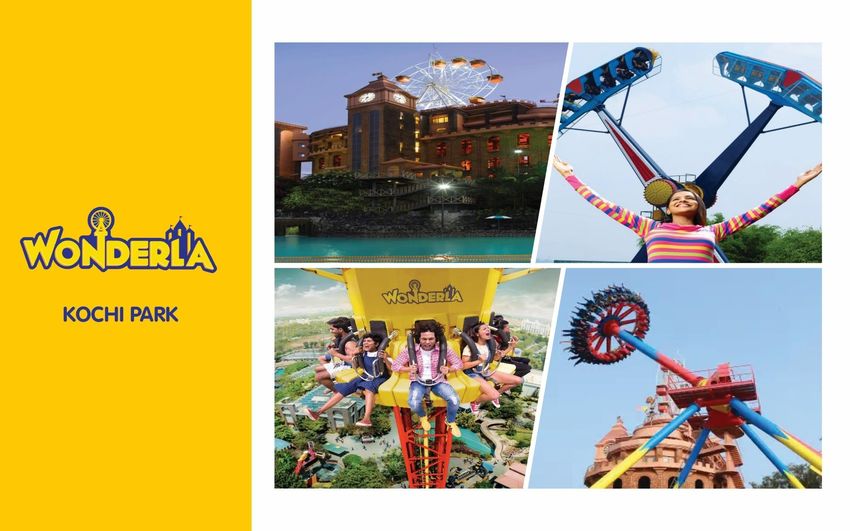
• Q4 FY20 RESULT HIGHLIGHTS
• Q4 FY20 PORTFOLIO UPDATE
   • AMUSEMENT PARK, BANGALORE
   • RESORT, BANGALORE
   • AMUSEMENT PARK, KOCHI
   • AMUSEMENT PARK, HYDERABAD
• FINANCIALS
• COMPANY OVERVIEW

                                 2
Q4 & FY20 RESULT HIGHLIGHTS

                                   Q4 FY20 YoY Analysis                                               In Rs Mn
              REVENUES              EBITDA & EBITDA MARGIN       CASH PAT, PAT & PAT MARGIN
                                   29.5%                           11.5%                    3.7%
     606.5
                                                        12%               168.7
                          424.2     178.7
                                                                                                   119.1
                                                                69.9
              30.1%                          71.6 %    50.7
                                                                                         15.6

    Q4 FY19              Q4 FY20   Q4 FY19            Q4 FY20     Q4 FY19                  Q4 FY20
                                                                PAT           Cash PAT          PAT Margin %

                                      FY20 YoY Analysis
              REVENUES              EBITDA & EBITDA MARGIN       CASH PAT, PAT & PAT MARGIN
                                    40.5%                          19.6%                    23.9%
    2,820.4                                            38.4%
                         2,708.7
                                                                                                   1,065.5
                                   1,143.4                                 949.3
                                                      1,041.1
                                                                                         647.8
                                                                554.1
               4%                              9%

     FY19                 FY20      FY19               FY20            FY19                  FY20
                                                                PAT           Cash PAT           PAT Margin %
                                                                                                                3
Q4 FY20 RESULT HIGHLIGHTS

FINANCIAL UPDATE

▪ Q4 FY20 revenue from operations impacted due to shutdown of Parks in March 2020 to prevent Covid -19 outbreak and resulted in
  30% reduction YoY from Rs 606.54 mn to Rs 424.2 mn driven by 31 % reduction in footfall.

▪ For Q4 FY20 , ticket revenue reduced by 31% YoY and non ticket revenue reduced by 29 % YoY
       • Bangalore Park witnessed a de-growth of 38% in footfall, Kochi Park reduction in footfall by 31% and Hyderabad Park reduction in
          footfall by 22%

▪ Q4 FY20 EBITDA reduced by 72 % YoY from Rs 178.7mn to Rs 50.73mn.

▪ EBITDA margin decreased from 29% in Q4 FY19 to 12% in Q4 FY20.

▪ Q4 FY20 PAT reduced by 78 % YoY from Rs 69.87mn to Rs.15.63 mn. PAT margin decreased from 11.5% in Q4 FY19 to 3.7% in Q4 FY20 .

▪ Q4 FY20 Cash PAT (PAT + depreciation) decreased by 29.4 % from Rs.168.67 mn to Rs. 119.13 mn.

▪ Exceptional item represents the reversal of provision for service tax and other local body taxes created by the Company during earlier years.
  The Company has opted for the Sabka Vishwas (Legacy Dispute) Resolution Scheme, 2019 (‘the Scheme’) initiated by the Government of India
  during September 2019. Accordingly, the payments made during the current year towards settlement of these pending litigations under the
  Scheme and the earlier payments made under protest have been adjusted against the provision. The resultant excess provision after the
  aforementioned adjustments has been reversed as income.

                                                                                                                                                  4
COVID-19 IMPACT
BUSINESS UPDATE
  •    In view of COVID outbreak, the management decided to temporarily shut down operations in the month of March 2020. The decision
       has been taken by the management in accordance with safety and precautionary instructions outlined by the State Government to
       prevent and contain the spread of COVID-19.

  •    Kochi park was closed from 11 March 2020, Bangalore Park, Resort and Hyderabad park were closed from 14 March & 15 March 2020
       respectively.

  •    Impairment of assets: The management has tested its Parks for impairment as at 31 March 2020. Each of the Parks has been
       considered as a separate Cash Generating Unit (‘CGU’). The recoverable value, which was determined by Value-In-Use Method was
       higher as compared to the carrying value of each of the Parks and accordingly no impairment was recorded as at 31 March 2020.

  Under these circumstances Wonderla remains going concern up to 12 months and further after financial statement issuance date based on
  the following considerations:
  1.    Historically, Wonderla has been a profitable organization generating substantial cash flows

  2.   Promoter and the Board have no intent on discontinuation of business

  3.   Liquidity and Financial Condition: The Company has adequate liquidity of about Rs. 123 Crore in Mutual Funds and Bank as on 31st
  March 2020 which will cover significant near-term obligations. Accordingly, Wonderla is strongly placed to overcome this dire situation.

  4. Managing Operating Expenses: Company has taken appropriate steps to control the operating expenses during lockdown period like
  reduction in Employee cost, Advertisement and Marketing cost at bare minimum and reduction in R & M and Other overheads.

                                                                                                                                             5
UPCOMING PROJECTS

 CHENNAI PROJECT: The Government of Tamil Nadu has agreed to give an exemption to the Company from levy of Entertainment
 Tax for period of 5 years from the commencement of operations or 1st October 2021 (whichever is earlier).. Subsequently we
 had also obtained NOCs from various departments as advised by the DTCP (Directorate of Town & Country Planning) and the
 project approval meeting was convened on 24th February 2020. We have received the following NOC’s from various
 departments:
       ➢        NOC from Fire Service Department
       ➢        NOC from State Pollution Control Board
       ➢        NOC from the Forest Department
       With these approvals in place the Company may start construction of the project once the Government Authorities lift
       the lockdown.

                                                                                                                              6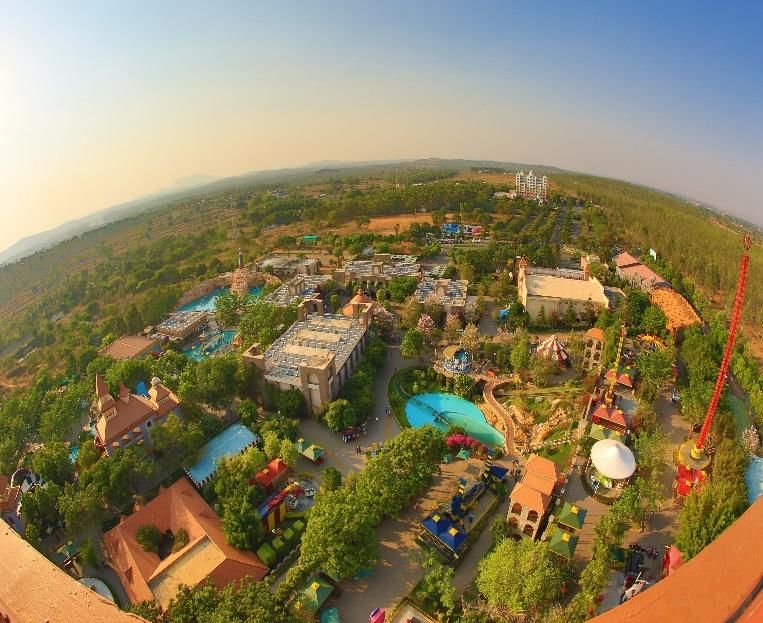
Q4 & FY20 REVENUE ANALYSIS

                                                                                                                                               In Rs Mn

                     SERVICES VS. PRODUCTS                                                         PORTFOLIO BREAKUP
         606.5             424.2           2,820.4            2,708.7           606.5                424.2           2,820.4         2,708.7
                                                                        4.9%                5.0%              4.1%              4.1%
 25.4%            25.9%            24.0%              23.9%                                                  26.8%
                                                                        27.8%               30.2%                               27.4%

                                                                        27.6%               27.7%             25.0%             27.7%
 74.6%            74.1%             76.0%              76.1%
                                                                        39.7%               37.1%            44.1%              40.8%

        Q4 FY19        Q4 FY20              FY19               FY20            Q4 FY19             Q4 FY20            FY19              FY20

                  Services                      Products                 Park - Bangalore     Park - Kochi   Park - Hyderabad   Resort - Bangalore

                      TICKET VS. NON-TICKET                                                   TOTAL FOOTFALLS (In ‘000)
         606.5             424.2       2,820.4             2,708.7
                                                                                                                     2,523.1        2,381.1
30.1%             30.6%            28.2%              28.3%

                                                                                            30.9 %                              5.6 %
 69.9%            69.4%            71.8%              71.7%                     585.9
                                                                                                     405.0

     Q4 FY19          Q4 FY20              FY19                FY20            Q4 FY19             Q4 FY20            FY19              FY20

                  Ticket                      Non-Ticket
                                                                                                                                                      7
Q4 & FY20 REVENUE ANALYSIS

                 AVG. REVENUE PER VISITOR (PARKS) (In Rs) *                                 AVG. TICKET REVENUE PER VISITOR (PARKS) (In Rs)

                                                 1,072              1,091
          984                 995
                                                                                                                                  803                 816
                                                                                          723                727
                    1.1 %                                  1.8 %                                  0.5 %                                   1.7%

        Q4 FY19              Q4 FY20             FY 19              FY 20             Q4 FY19             Q4 FY20             FY 19                   FY 20

         AVG. NON-TICKET REVENUE PER VISITOR (PARKS) (In Rs)                      BREAK-UP OF NON-TICKET REVENUE (PARKS + RESORT) (In Rs Mn) *

                                                                                  6.6%               7.1%              7.2%                   7.3%
                                                                                  16.3%              16.4%            14.5%                   14.5%
           261                 268               270                 275
                                                                                  34.7%              33.8%            35.9%                   34.8%
                     2.5 %                                2.1 %

                                                                                  42.4%              42.7%                42.4%               43.4%

        Q4 FY19              Q4 FY20             FY 19              FY 20                 Q4 FY19          Q4 FY20                FY 19               FY 20
* Includes sale of services, sales of products & other operating income.                   Restaurants         Products              Resort           Others

                                                                            Q3 FY15                                                                            8
9
PORTFOLIO UPDATE – AMUSEMENT PARK, BANGALORE

•       Launched in 2005 by the name ‘Wonderla’

•       Wonderla Bangalore is located off the Bangalore-Mysore highway, 28
        km from Central Bangalore

•       Situated on 81.75 acres of land with 61 land and water based
        attractions and other allied facilities

•       5 company-operated restaurants offering various cuisines

•       The park has won 13 awards since inception

•       Launched Wave Rider - A family ride imported from Italy, it has a cabin
        wherein the riders stand at both sides. Cabin rotates on a pivot giving
        the riders an experience of surfing through waves. The ride has a
        capacity of 12 persons at a time with a duration of 2 minutes per ride.
                                             Q4 FY20         Q4 FY19       YoY %   LOCATION                          BANGALORE
    Total Revenues (Rs Mn) *                     157.3          240.8       -35%   Total Land Available (In Acres)     81.7
    No of Visitors (In ‘000)                     137.1          219.3       -38%
                                                                                   Developed Land (In Acres)           39.2
    Avg. Revenue Per Visitor (Rs)             1,148.1         1,098.1        5%
                                                                                   Land Availability for Future
                                                FY 20           FY 19      YoY %                                       42.5
                                                                                   development (In Acres)
    Total Revenues (Rs Mn) *                  1,105.0         1,243.2       -11%
                                                                                   Total No of Rides                    62
    No of Visitors (In ‘000)                     901.5        1,057.1       -15%
    Avg. Revenue Per Visitor (Rs)             1,225.7         1,176.1        4%    No of Wet Rides                      21

* Includes sale of services, sales of products & other operating income.           No of Dry Rides                      41

                                                                                                                                 10
BANGALORE PARK – REVENUE & FOOTFALL ANALYSIS
AVG. TICKET REVENUE PER VISITOR (In Rs) AVG. NON-TICKET REVENUE PER VISITOR (In Rs)
898 934
824 848
300
292
3% 4.1 % 9.3 % 4.7 %
278
274
Q4 FY19 Q4 FY20 FY19 FY20 Q4 FY19 Q4 FY20 FY19 FY20
FOOTFALLS – WALK-IN Vs. GROUP / CHANNEL (‘000) FOOTFALLS – REGIONWISE BREAKUP (‘000)
219.3 137 1057 901.5 219.3 137 1057.1 901.5
4% 3% 4% 4%
27.4% 29.2% 3% 4% 3% 5%
36.5% 39.8% 13% 15% 11% 14%
74% 73% 77% 72%
63.5% 60.2% 72.6% 70.8%
6% 5% 5% 5%
Q4 FY19 Q4 FY20 FY19 FY20 Q4 FY19 Q4 FY20 FY19 FY20
Walk-in Group Kerala Karnataka Tamil Nadu Andhra Pradesh Others
11PORTFOLIO UPDATE – WONDERLA RESORT, BANGALORE
• Three Star leisure resort attached to the amusement park;
launched in March 2012
• The resort has 84 luxury rooms
• The resort also has 4 banquet halls / conference rooms, totalling
8,900 sq. ft. with a capacity to hold 800 guests and a well-equipped
board room
• Suitable for hosting wedding receptions, parties and other
corporate events and meetings
• Other amenities include a multi-cuisine restaurant, rest-o-bar, solar
heated swimming pool, recreation area, kids’ activity centre and a
well equipped gym
Q4 FY20 Q4 FY19 YoY % FY20 FY 19 YoY %
Total Revenues (Rs Mn) * 21.5 30.3 -29% Total Revenues (Rs Mn) * 111.9 116.7 -4%
Total No of Room Nights Total No of Room Nights
7,534 7,069 7% 30,059 29,701 -
Available (No.) to Guests Available (No.) to Guests
Occupancy % 33% 52% -36% Occupancy % 45% 45% -
Avg. Room Rental for the Avg. Room Rental for the
4,392 4,425 -1% 4,738 4,577 4%
period (Rs) period (Rs)
* Includes other operating income.
1213
PORTFOLIO UPDATE – AMUSEMENT PARK, KOCHI
•      Launched in 2000 by the name ‘Veegaland’ and operating under the
       name ‘Wonderla’ since April 2008
•      Situated on 93.17 acres of land, and currently occupying 28.75 acres
       for 56 land and water based attractions and other allied facilities
•      6 restaurants offering various cuisines, all are operated by the
       Company. The park has won 18 awards since inception
•      Launched 2 Rides: Fusion Slide - A water tube slide with a diameter
       of 1.4 meter, starts from a height of 9 meter. Two riders can enjoy at a
       time. Inflated tubes are used to carry riders through the slide.
       V R Coaster – This ride is an advanced version of roller coaster, located
       inside a castle themed building which goes up to a height of 6m
       & through 190m track with steep incline, curves and dips. Each rider is
       provided with virtual reality headsets to experience the movement
       through virtual environment along with movement of car through
       track and a synchronised themed video.
                                             Q4 FY20       Q4 FY19       YoY %     LOCATION                          KOCHI
    Total Revenues (Rs Mn) *                     117.6          167.4       -30%   Total Land Available (In Acres)   93.2
    No of Visitors (In ‘000)                     132.7          192.7       -31%   Developed Land (In Acres)         28.8
    Avg. Revenue Per Visitor (Rs)                886.3          868.8        2%
                                                                                   Land Availability for Future
                                                                                                                     64.4
                                                 FY20           FY 19      YoY %   development(In Acres)

    Total Revenues (Rs Mn) *                     750.8          705.7        6%    Total No of Rides                  56
    No of Visitors (In ‘000)                     775.8          757.0        2%    No of Wet Rides                    22
    Avg. Revenue Per Visitor (Rs)                967.7          932.2        4%    No of Dry Rides                    34
* Includes sale of services, sales of products & other operating income.

                                                                                                                             14
KOCHI PARK – REVENUE & FOOTFALL ANALYSIS
AVG. TICKET REVENUE PER VISITOR (In Rs) AVG. NON-TICKET REVENUE PER VISITOR (In Rs)
694 724
638 655
231 231 238 244
2.7 % 4.2 % 2.6 %
Q4 FY19 Q4 FY20 FY19 FY20 Q4 FY19 Q4 FY20 FY19 FY20
FOOTFALLS – WALK-IN Vs. GROUP / CHANNEL (‘000) FOOTFALLS – REGIONWISE BREAKUP (‘000)
192.7 132.7 757 775.8 192.7 132.7 757 775.8
3% 2% 3% 2%
1% 1%
46.9% 51.2% 22% 30%
60.8% 63.8% 27% 29%
1%
1% 1% 1%
67% 74% 67%
53.1% 48.8% 68%
39.2% 36.2%
Q4 FY19 Q4 FY20 FY19 FY20 Q4 FY19 Q4 FY20 FY19 FY20
Walk-in Group Kerala Karnataka Tamil Nadu Andhra Pradesh Others
15PORTFOLIO UPDATE – AMUSEMENT PARK, HYDERABAD
• Launched in April 2016 by the name ‘Wonderla’.
• Situated on 49.5 acres of land, and currently occupying 27.0 acres
for 46 land and water-based attractions and other allied facilities.
• 4 company operated restaurants offering various cuisines
• The Park has won 6 awards since inception
• Launched 2 rides: Funky Monkey - Drop Tower specially designed
for children . The ride takes to a maximum height of 4 meters, giving
a miniature experience of a free fall. The capacity of the ride is 6 kids
at a time with a duration of 4 minutes per ride.
Rocking Tug – A family ride imported from Italy; shaped like a ship,
it gives the riders a thrilling ship riding & sailing experience.
Q4 FY20 Q4 FY19 YoY % LOCATION HYDERABAD
Total Revenues (Rs Mn) * 128 168.6 -24% Total Land Available (In Acres) 49.5
No of Visitors (In ‘000) 135.3 174 -22% Developed Land (In Acres) 27.0
Avg. Revenue Per Visitor (Rs) 946 969 -2%
Land Availability for Future
22.5
FY20 FY 19 YoY % development(In Acres)
Total Revenues (Rs Mn) * 742.2 756 -2% Total No of Rides 44
No of Visitors (In ‘000) 703.7 709 -1% No of Wet Rides 18
Avg. Revenue Per Visitor (Rs) 1054.7 1066.2 -1% No of Dry Rides 26
* Includes sale of services, sales of products & other operating income.
17HYDERABAD PARK – REVENUE & FOOTFALL ANALYSIS
AVG. TICKET REVENUE PER VISITOR (In Rs) AVG. NON-TICKET REVENUE PER VISITOR (In Rs)
776 767
691 675
278 271 290 288
2.3 % 1.2 % 2.5 % 0.7 %
Q4 FY19 Q4 FY20 FY19 FY20
Q4 FY19 Q4 FY20 FY19 FY20
FOOTFALLS – WALK-IN Vs. GROUP / CHANNEL (‘000) FOOTFALLS – REGIONWISE BREAKUP (‘000)
174 135.3 709 703.7 174 135 709 704
5.4% 4.2% 4.8% 5.6%
57.4% 38.6% 41.9%
57.7%
94.6% 95.8% 95.2% 94.4%
61.4% 58.1%
42.3% 42.6%
Q4 FY19 Q4 FY20 FY19 FY20 Q4 FY19 Q4 FY20 FY19 FY20
Walk-in Group Telangana Others
18FINANCIALS – P&L STATEMENT
Particulars (Rs Mn) Q4 FY 20 Q4 FY 19 YoY % FY 20 FY 19 YoY %
Sale of Services 314.5 452.3 -30% 2,062.1 2,144.2 -4%
Sale of products 109.3 153.5 -29% 644.7 673.9 -4%
Other Operating Revenue 0.5 0.8 - 1.9 2.3 -
Revenue from Operations 424.2 606.5 -30% 2,708.7 2,820.4 -4%
Cost of materials consumed 23.6 30.9 -24% 131.4 130.7 1%
Purchase of stock-in-trade 22.2 32.5 -32% 158.6 166.2 -5%
Changes in inventories of stock-in-trade 4.7 6.2 -24% -3.6 2.6 -240%
Employee benefits expense 94.5 91.2 4% 404.1 381.1 6%
Other expenses 228.5 267.0 -14% 977.2 996.5 -2%
Total Expense 373.5 427.8 -13% 1,667.7 1,677.0 -1%
EBITDA 50.7 178.7 -72% 1,041.1 1,143.4 -9%
EBITDA Margin % 12.0% 29.5% -1750bps 38.4% 40.5% -211bps
Other Income 24.9 29.0 -14% 120.1 96.2 25%
Depreciation 103.5 98.8 5% 417.7 395.1 6%
Finance Cost 1.4 0.0 - 6.8 4.1 66%
PBT -29.3 108.8 - 736.7 840.4 -12%
Exceptional item 33.5 - - 189.2 - -
Tax Expense -11.4 39.0 - 278.0 286.2 -3%
PAT 15.6 69.9 -78% 647.8 554.1 17%
PAT Margin % 3.7% 11.5% -783bps 23.9% 19.6% 427bps
Earnings Per Share (EPS) 0.28 1.24 11.46 9.81
19FINANCIALS – BALANCE SHEET
As of As of As of As of
31 March 2020 31 March 2019 31 March 2020 31 March 2019
EQUITY AND LIABILITIES ASSETS
Equity Non-current assets:
Equity share capital 565.2 565.1 Property, plant and equipment 7,767.7 7,981.4
Other equity 8,024.1 7,620.2 Capital work-in-progress 358.2 334.6
8,589.3 8,185.3 Intangible assets 21.5 31.9
Liabilities Intangible assets under development 1.0 1.7
Non-current liabilities Right to use Assets 60.4 -
Loans 26.6 27.0
Financial liabilities
Other financial assets 0.6 0.6
Lease Liability 39.4
Income tax assets (net) 23.2 12.8
Provisions 26.4 14.0
Other non-current assets 51.9 52.3
Deferred tax liabilities (net) 813.1 698.7
8,311.0 8,442.2
878.9 712.7
Current assets
Current liabilities
Inventories 69.6 62.4
Financial liabilities Financial assets:
Borrowings - 9.9 Investments 700.4 500.9
Lease Liability 22.3 - Trade receivables 3.8 14.8
Trade payables 92.2 128.9 Cash and cash equivalents 37.7 27.9
Other financial liabilities 69.1 81.3 Other balances with banks 500.1 400.1
Other current liabilities 20.8 32.4 Loans 6.8 6.4
Provisions 132.1 584.9 Other financial assets 15.5 3.7
Income tax liabilities (net) 6.6 7.7 Other current assets 166.2 284.9
342.9 845.1 1,500.2 1,300.9
TOTAL EQUITY & LIABILITIES 9,811.2 9,743.1 TOTAL ASSETS 9,811.2 9,743.1
20COMPANY OVERVIEW – BOARD OF DIRECTORS & MANAGEMENT TEAM
• 20 years in the industry • 15+ years in the industry
ARUN KOCHOUSEPH
KOCHOUSEPH CHITTILAPPILLY • Founded V-Guard Industries Ltd., a publicly • Holds a masters degree in industrial
CHITTILAPPILLY
PROMOTER AND listed company since 2008 and is currently engineering
its Chairman PROMOTER AND
NON-EXECUTIVE DIRECTOR • Actively involved in day-to-day operations and
• Post Graduate Degree in Physics
WHOLE-TIME DIRECTOR management of Wonderla since 2003
GOPAL • 15+ years in the Industry
• 39+ years of total work • 26+ years of work experience PRIYA SARAH CHEERAN
GEORGE JOSEPH • Was involved in F&B
experience SRINIVASAN • Chairman of TVS Capital JOSEPH
JOINT MANAGING Operations and HR
• Director in Muthoot INDEPENDEN Funds & Independent Director NON-EXECUTIVE
DIRECTOR Finance Ltd.
department of Wonderla
T DIRECTOR in TVS & Sons Limited. DIRECTOR since 2005
• 43+ years of work experience
R LAKSHMINARAYANAN • 10+ years of work experience in Retail M RAMACHANDRAN
• Served as partner for 20 years with audit firm
NON-EXCUTIVE • Independent Director in Jyothi Laboratories CHAIRMAN & Deloitte Haskins & Sells LLP
DIRECTOR Limited INDEPENDENT DIRECTOR
• Member of ICAI & ICSI
• 20+ years of executive experience in development and
commercialization of hi-tech products that are software-driven,
ANJALI NAIR incorporating Design Thinking, Data Sciences, advanced
INDEPENDENT DIRECTOR algorithms and applied Artificial Intelligence.
• Working as COO SP Life Care Pvt Ltd
• 25 years of experience
SIVADAS M. • 28 years of experience SATHEESH SHESHADRI
• Worked in Finance & Accounts at Bangalore
PRESIDENT – • Bachelor’s Degree in CHIEF FINANCIAL International Airport, Dubai Transport Corporation
OPERATIONS Physics OFFICER (CFO)
• Chartered Accountant & SAP ERP certified
MAHESH M.B. • 22 years of experience
AJIKRISHNAN A. G. • 19 years of experience
AVP – • MBA in International
VP – PROJECTS • B.E, MBA
COMMERCIAL Business
21COMPANY OVERVIEW – UNDERSTANDING THE WONDERLA ADVANTAGE
KEY CONCERNS ON SCALABILITY WONDERLA ADVANTAGE
• In-House Design Capability for the Amusement Park
HIGHLY CAPITAL • In-House Ride Manufacturing Facility in Kochi
INTENSIVE BUSINESS • Manufactured / constructed 42 rides / attractions in-house
• Typical Capex for a New Park is ~Rs 2,500 mn – Rs 3,500 mn including Land cost
• Typical Target Audience is the Middle class which can spend Rs 4,000-5,000 per
AFFORDABILITY – trip for a Family
TICKET PRICES ARE HIGH • All three Parks have Land as well as Water rides under the same Ticket
• Average ticket prices in the range of Rs 800 – Rs 1200
• All three Operational Parks have large Land Parcels and have good connectivity
LAND AVAILABILITY, (Within 15-25 km from the city)
LOCATION & • Parks provide a thrilling & unforgettable experience to visitors from
CONNECTIVITY neighbouring states like Tamil Nadu and Andhra Pradesh while also being an
attractive tourist spot for pan India population
22COMPANY OVERVIEW – SUSTAINABLE COMPETITIVE ADVANTAGES
OVER A DECADE OF OPERATIONAL PROXIMITY TO CITY WITH AMPLE LAND
EXPERIENCE AND BRAND EQUITY AVAILABLE FOR FUTURE DEVELOPMENT
• 20+ yrs of successful operations of the parks has built
significant brand equity • Owns 93.17 acres in Kochi, 81.75 acres in Bangalore
• Mr. Kochouseph and Mr. Arun have over 20 yrs and and 49.50 acres in Hyderabad, within which further
15+ yrs of experience respectively in amusement expansion of existing parks can be undertaken
park industry • All the three parks - Kochi, Bangalore and
• Won several awards, including ‘best tourism Hyderabad - are situated in the proximity of the
destination’ and ‘highest number and variety of main city.
innovative rides’
STRONG CUSTOMER INSIGHTS -
IN-HOUSE MANUFACTURING FACILITY
CONSTANTLY INNOVATING NEW
AT WONDERLA KOCHI
ATTRACTIONS
• Benefits from certain cost efficiencies and improves
maintenance efficiency of rides • In-depth understanding of customer preference and
• Enables customisation and modification of rides needs helps while conceptualising new rides
purchased • Won the IAAPI excellence award for the highest
• Manufactured / constructed 42 rides / attractions in- number and variety of innovative rides four times
house
23COMPANY OVERVIEW – FUTURE GROWTH STRATEGY
• Currently in process of Construction of Project in Chennai as well as identifying potential
SCALABILITY – EXPANSION THROUGH SETTING
opportunities for setting up new parks in other key geographies
NEW AMUSEMENT PARKS • Board has recently approved setting up another park in Odisha
• Evaluate customer preferences to innovate attractions based on popular concepts
FOCUS ON IMPROVISING EXISTING PARKS TO
• Develop the undeveloped land at existing parks to increase operational capacity
IMPROVE FOOTFALLS • Efforts to cover tourists through portals developed for tour operators.
ENHANCED VISITOR • Wonderla Resort enables visitors to stay longer at the park & increases spend per head
EXPERIENCE THROUGH PARKS • Enhance visitor experience at other parks by integrating them with resorts
INTEGRATED WITH RESORTS • Introduced stay & paly scheme at Kochi park in association with a leading hotel
• Introduce new rides and attractions based on customer preferences and research done
EXPAND IN-HOUSE RIDE DESIGN
by visiting parks in other parts of the world
AND MANUFACTURING CAPABILITIES • Continue to invest in new manufacturing facilities at upcoming parks
EXPAND REVENUE STREAMS AND • Bolster revenues from entry tickets by offering value-added services
INNOVATING MARKETING INITIATIVES TO • Introduce character and theme based attractions and promote this through marketing
SUPPLEMENT INCOME FROM ENTRY FEES initiatives , ad campaigns using media as well as tour operators
24COMPANY OVERVIEW – GLOBAL RANKING AND RECOGNITION
Wonderla parks in Bangalore, Kochi and Hyderabad
were ranked at #3, #4 and #7 in India by Tripadvisor
Wonderla Bangalore ranked 8th Best and Wonderla
Kochi ranked 16th Best in Asia.
25FOR FURTHER QUERIES -
Mr. Satheesh Seshadri
Mehul Mehta/Nachiket Kale
CFO IR Consultant
Email – Dickenson World
satheesh.seshadri@wonderla.com Contact No : +91 9920940808
Email – wonderla@dickensonworld.com
Disclaimer
This presentation and the following discussion may contain “forward looking statements” by Wonderla Holidays
Limited (“Wonderla” or the Company) that are not historical in nature. These forward looking statements, which
may include statements relating to future results of operations, financial condition, business prospects, plans and
objectives, are based on the current beliefs, assumptions, expectations, estimates, and projections of the
management of Wonderla about the business, industry and markets in which Wonderla operates.
These statements are not guarantees of future performance, and are subject to known and unknown risks,
uncertainties, and other factors, some of which are beyond Wonderla’s control and difficult to predict, that could
cause actual results, performance or achievements to differ materially from those in the forward looking
statements. Such statements are not, and should not be construed, as a representation as to future performance
or achievements of Wonderla.
In particular, such statements should not be regarded as a projection of future performance of Wonderla. It should
be noted that the actual performance or achievements of Wonderla may vary significantly from such statements.
26You can also read