Full year results 2016 - Jeremy Darroch - Amazon S3

Page created by Glen Jones
 
CONTINUE READING
Full year results 2016 - Jeremy Darroch - Amazon S3
Full year results 2016
     Jeremy Darroch
          1
Full year results 2016 - Jeremy Darroch - Amazon S3
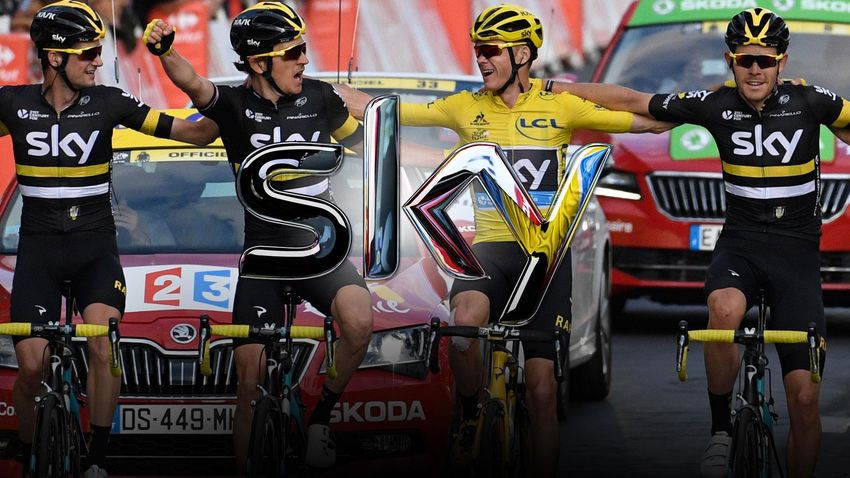
This document contains certain forward looking statements with respect to the Group’s financial condition, results of operations and business, and our strategy,
plans and objectives for the Group. These statements include, without limitation, those that express forecasts, expectations and projections, such as forecasts,
expectations and projections in relation to new products and services, the potential for growth of free-to-air and pay television, fixed line telephony, broadband and
bandwidth requirements, advertising growth, DTH and OTT customer growth, On Demand, NOW TV, Sky Go, Sky Go Extra, Sky+ HD, Sky Q, Sky Store, Sky Online, mobile,
Multiscreen and other services penetration, revenue, administration costs and other costs, advertising growth, churn, profit, cash flow, products and our broadband
network footprint, content, wholesale, marketing, synergies and integration, and capital expenditure.

These statements (and all other forward-looking statements contained in this document) are not guarantees of future performance and are subject to risks,
uncertainties and other factors, some of which are beyond the Group's control, are difficult to predict and could cause actual results to differ materially from those
expressed or implied or forecast in the forward-looking statements. These factors include, but are not limited to, the fact that the Group operates in a highly
competitive environment and faces competition from a broad range of organisations, the effects of laws and government regulation upon the Group's activities, the
fact that the Group’s business is based on a subscription model and its future success relies on building long-term relationships with its customers, its reliance on a
complex technical infrastructure which is subject to risk of failure, change and development, failure of key suppliers, the Group’s exposure to financial market risks, the
fact that the Group must protect its customer and corporate data and prevent breaches of security, risks inherent in the implementation of large-scale capital
expenditure projects, the fact that the Group relies on intellectual property and proprietary rights which may not be adequately protected under current laws or
which may be subject to unauthorised use and the fact that people at Sky are critical to the Group’s ability to meet the needs of its customers and achieve its goals
as a business.

Information on the significant risks and uncertainties is provided in the “Principal risks and uncertainties” section of Sky’s Annual Report for the full year ended 30
June 2015 (as updated in Sky’s results for the six months ended 31 December 2015). Copies of the Annual Report are available from the Sky plc web page at
www.sky.com/corporate and in hard copy from the Company Secretary, Sky plc, Grant Way, Isleworth, Middlesex TW7 5QD. All forward looking statements in this
document are based on information known to the Group on the date hereof. The Group undertakes no obligation publicly to update or revise any forward looking
statements, whether as a result of new information, future events or otherwise.

                                                                                     2
Full year results 2016 - Jeremy Darroch - Amazon S3
3
Full year results 2016 - Jeremy Darroch - Amazon S3
• Excellent set of results

• Strong performances in each market

• Delivered our strategy at pace and scale

• Extended our leadership in TV, innovation and service

• Operated efficiently

• Growing our capabilities
                                        4
Full year results 2016 - Jeremy Darroch - Amazon S3
2014/15                             2015/16   Growth

     Revenue                                                                                      £11,221m                         £11,965m       +7%

     Operating profit                                                                              £1,397m                             £1,558m   +12%

     Earning per share                                                                                56.0p                             63.1p    +13%

     Customers (‘000)                                                                                21,006                            21,814    +808

     Products (‘000)                                                                                 53,783                            57,055    +3,272
                                                                                                5
Financials are twelve months ended 30 June and 2015/16 includes the benefit of the 53rd week. Operating results are closing 30 June.
Full year results 2016 - Jeremy Darroch - Amazon S3
• Best content
 Consumer     • Best products and market leading innovation
proposition   • Best service

              • Mid to high single digit revenue growth
 Financial
              • Customer investment and business efficiency
  model       • Delivering profit growth ahead of revenue growth

              • No.1 brand
    Key
              • Deep customer insight
foundations   • Winning organisation and mindset

                    6
Full year results 2016 - Jeremy Darroch - Amazon S3
Results for 2015/16
    Andrew Griffith   International Rugby

         7
Full year results 2016 - Jeremy Darroch - Amazon S3
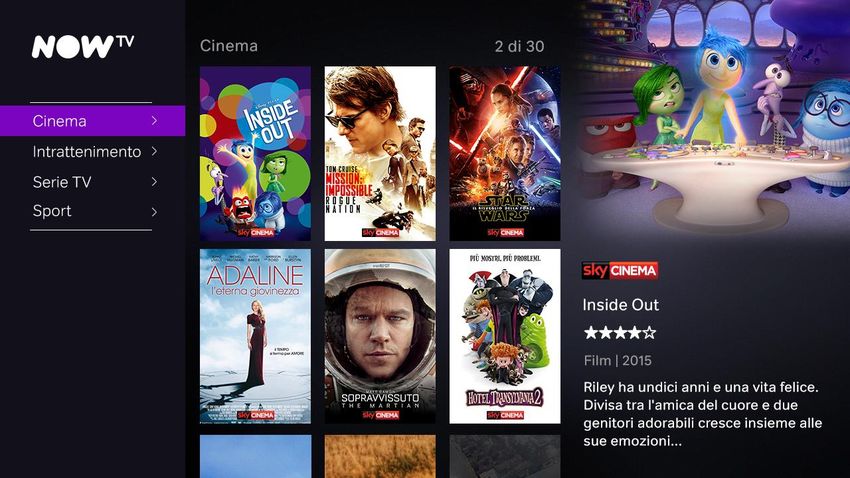
• One of the best Q4s for 5 years                                           Strong revenue growth
    – 93,000 new customers                                                                        £8,371m
                                                                                 Added
                                                                                >£1 billion
• Strong customer and product growth
    – Added c.450k new customers                                                        £7,820m

    – Added over two million new products
                                                                            £7,371m
• Excellent financial results
    – Revenue growth of 7%
    – Profit growth of 11%
                                                                             2014        2015      2016

Twelve months ended 30 June and includes benefit of 53rd week in 2016
                                                                        8
Full year results 2016 - Jeremy Darroch - Amazon S3
• 2nd fastest customer growth in 5 years                                                                        First ever full year profit
                                                                                                                                                              c€40m

• Europe’s fastest growing pay TV market
                                                                                                                                                                €5m

• First ever full year profit

• More profitable in 16/17
                                                                                                                (€71m)

                                                                                                                  2014                  2015                    2016
                                                                                                                                    Profit       “Underlying”

Twelve months ended 30 June and includes benefit of 53rd week in 2016. Underlying in 2016 adjusts for the connected home investment of €34 million on hardware and ATL spend.
                                                                                               9
Full year results 2016 - Jeremy Darroch - Amazon S3
• Best customer growth for 5 years                                                                               Growing revenue in Italy

• Added customers in last three quarters                                                                                                                 €775m

• Strong revenue growth, up 6% in Q4
                                                                                                            €663m
                                                                                                                                       €635m

• Exiting the year strongly

                                                                                                                Q1     Q2    Q3   Q4    Q1     Q2   Q3    Q4
                                                                                                                           2015                 2016

Revenue of €775m in Q4 2016 includes the benefit of 53rd week. Excluding this, Q4 revenue was €730m, up 6% year on year.
                                                                                               10
• UK                                              Churn performance for last 3 years
                                            14%
  – Increasing mix of broadband only
    customers                               12%

  – Price rise this quarter                 10%
  – Reduced offers available in retention
                                            8%

                                            6%
• Germany
                                            4%
  – Good performance at 9.9%
                                            2%

• Italy                                     0%
                                                       2014                2015               2016
  – Reduced level of discounts available
                                                          UK and Ireland    Germany   Italy

                                                  11
• Core part of growth strategy           Over 50% TV homes now connected

• Clear benefits
                                                            c.11m homes
    – Higher satisfaction
    – Lower churn
    – Consume more Sky content

• 2m customers connected in 15/16

• Growing further next year              2013                       2016

Quarter ended 30 June
                                    12
• Consumption up in every market

• Good quarter for Sky originals
 – Lucky Man and Gomorrah achieved best two audiences ever

• New records for Sky Box Sets
 – Over six millions households downloaded Game of Thrones
 – c.25% Sky Box Set customers watched Billions

• Record audience for Euro 2016 in Italy
                                                             Billions

                                            13
£m                                  2015              2016                  Change

                                                                                                          • Added over 3 million products and 800k products
     Subscription                       9,642             10,185             +543           +6%           • TV price rise in every market

                                                                                                          • Sky Store Buy & Keep up over 80%
     Transactional                        172                197              +25          +15%           • Over 2m NOW TV sports passes sold

     Programme and                                                                                        • Higher prices with wholesale partners
                                          550               642               +92          +17%
     Channel sales                                                                                        • Increasing volume of programming sales

                                                                                                          • Excellent growth in the Italian FTA and Adsmart
     Advertising                          712                778              +66           +9%           • First pan-European advertising deal with DHL

     Other                                145                163              +18          +12%

     Total                              11,221            11,965            +744            +7%

Twelve months ended 30 June and 2016 includes the 53rd week. Using constant currency exchange rate of €1.34: £1
                                                                                              14
+17%           +c.7%
                                                                            +15%
                                                             +9%

                                        +c.6%

                                     “Core” subscription   Advertising    Transactional   Programme and     Total
                                          business                                         channel sales

                                    Customer growth,            Connected home               Growing
     Key growth
                                    product mix, along     investment and innovation      investment in
       drivers                         with pricing                                          content
                                                                   15
Includes the benefit of 53rd week
Mid to high single digit revenue growth
                   Grow programming in line with revenues
Structured
approach to     Positive and growing contribution from comms
   costs
                   Drive hard on operating cost efficiency

  Operating profit growth ahead of revenue growth

         EPS growth ahead of EBIT growth
                            16
• Growing in line with revenues   Programming costs as a percentage of revenue

• Making choices                    44%                                                43%

• Secure most important rights
  for customers

                                   2008 2009 2010   2011   2012   2013   2014   2015   2016

                                          17
• Reducing SG&A costs as            SG&A as a % of revenue
  % of sales
                             43

• Since 2010                        40
                                           39
 – SG&A increased by c.10%                        38
                                                         37
 – Grown revenues by c.40%                                       36

• Equivalent to c£800m
  of saving
                             2011   2012   2013   2014   2015   2016

                              18
Contact centres   Supply chain        Network        Tech/Digital        Marketing      Back office

• New contact centre structures    • In-house broadband engineers      • Reduce routes to market
• Reduce inbound calls through     • Procurement rate savings          • Optimise advertising rates
  Digital e-care in Germany                                              and response
                                   • Combine News and Sports
• Launch of new Sky Service App      production and automate           • Shift media mix to more digital
• Rebuild e-care website             elements
                                                                       • Rationalise number of sites
• Automate sales and upgrades      • Further deprecation of standard
  and outbound calls                 definition STB population         • Spans and layers review

                                                  19
>£200m
                                                                Target of £200m

                                                        £106m

                           Q3 2015                      Q4 2015          Q1 2016         Q2 2016    Q3 2016   Q4 2016

                                                                       Delivered        In flight

Projected annualised run rate synergies by the end of 2016/17

                                                                                   20
c£400m

                                                                                                                       Next phase
                                                                                                                       initiatives
                                                                                              >£200m

                                                                                                                      Organic growth
                               £106m                                                                                    of existing
                                                                                                                        synergies

         Q3 2015                Q4 2015                Q1 2016   Q2 2016       Q3 2016             Q4 2016    2020
                                                                   Delivered           In flight

Projected annualised run rate synergies by the end of 2019/20
                                                                                  21
• Revenue up 7%

• Operating profit up 12%

• Profit after tax up 14%

• Operating free cash flow of £1.4 billion

• EPS up 13%
                                                                                    Point Break

Operating free cash flow excludes £135 million of campus redevelopment capex
                                                                               23
• Combination of EPS growth plus              Five year dividend growth
  dividend
                                                              33.5p
                                                   +44%
• Strong, reliable free cash flow
                                                    23.3p

• Consistent set of financial policies
 – No pension liabilities

• Growing and well covered dividend
                                                    2011      2016

                                         24
• Executed well on 15/16 plans

• Growing well in every territory

• Delivered expected benefits from transaction

• Operating and financial model is working

• Growing profits and returns for shareholders

                                                 International Cricket

                                       25
Looking forward
  Jeremy Darroch
       26
Pay TV broadcaster               Broader, consumer-led business
Sports and movies centric            Entertainment for everyone
High reliance on big bundle            Broad range of packages
     Exclusively DTH                    DTH, IPTV, OTT, Mobile
  Main TV in living room               Every screen, everywhere
      Sales focused                       Customer focused
    Efficiency projects                 Efficiency at the core
       Multiple KPIs                  Revenue and profit growth

                              27
Customers                                                              Products                       Revenue

                                           21.8m
                                                                                                        57.1m                             £12bn

                 +12.8m                                                               +43.2m                          +£7bn

                9.0m
                                                                                                                    £5bn

                                                                                   13.9m

               2008                        2016                                     2008                2016       2008                   2016

Products and customers as at 30 June and financials are 12 months to 30 June (2016 includes                     TV subscription revenue    Other revenue
the 53rd week). 2008 is UK and Ireland only and 2016 is UK, Ireland, Germany, Austria and Italy.
                                                                                                   28
2008              2009   2010         2011            2012       2013           2014   2015   2016
                                                         Operating profit growth        Revenue growth

                                                                                   29
Based on adjusted results in the UK and Ireland
65m prospects         22m customers to      Sustained efficiency
  across markets       offer more products         benefits

£2.6bn transactional   £10bn TV advertising      £15bn mobile
      market                 market                 market
                                30
2016/17
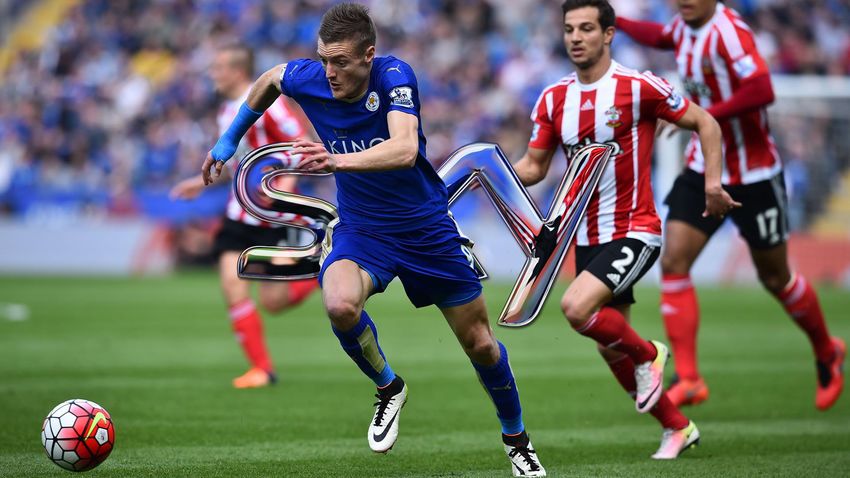
          Barclays Premier League

  31
Pay TV penetration and headroom
• Most developed market

• Blueprint for other territories

• Constantly improving the customer
  experience
                                                              13m
• Opening up new segments
                                                           56%
• Growing revenues strongly

                                      32
1.             2.            3.
 Leveraging    Driving broad   Launching
content and   based revenue     mobile
  products        growth
investments

                    33
• “Next generation premium TV service.”      Wired

• Re-inventing TV

• Best content anytime, anywhere

• Strong pipeline of innovation including
 – Ultra HD
 – Voice search
 – Split screen viewing

                                        34
• Pay lite sector

• First contract-free triple play
  offer in the UK

• Whole home solution

• Brand new NOW TV Smart box

• Gateway to family viewing

                                    35
• More matches than ever before

• Better picks

• Friday Night Football for first time

• 159 matches in Ireland including 3pm Saturday

• Ultra HD, in-game mobile clips, on demand coverage

                                         36
37
• A channel for everyone

• Broad mix and range of sport

• Family entertainment shows

• Available to all customers at no extra cost

• Doubles Sky Sports’ reach

• Further monetise sports rights
                                                38
• Revenues up 65% in past two years

• 3 million active users

• Introducing box sets in Buy and Keep

• UHD rentals launching on 13th August

                                         39
Best of TV                             Best of digital
   Highest quality content                                    Highly targetable,
                                                            over 1,000 attributes
     Established scale
        and reach                                         Multi-rotation campaigns
      Proven and transparent
          measurement                                 Access to data

   Quickly              Over 70% of               Adding                 Launching on
reaching scale       advertisers new to        more attributes            NOW TV and
                         TV or Sky                                     in Ireland in 2017
                                          40
41
Pay TV penetration and headroom
• Largest TV market in Europe

• Most affluent market

• Watching almost four hours every day

• Productive first two years
                                                33m
• Focus on increasing pay TV penetration
                                                               20%

                                      42
1.               2.                   3.                4.
   Developing       Broadening          Innovating to      Building new
 content for the   our range of        give more value    and additional
whole household    products and         to customers     revenue streams
                     services

                                  43
• Secured new Bundesliga deal to 2021
 – 572 live matches a season across all platforms
 – 93% of all live matches on Sky exclusively
 – New exclusive coverage Bundesliga 2

• Taking Sky Sports News free-to-air

• Creating a broader offer
 – ATP tennis, US PGA Tour, The Open

• Building new production facilities                Bundesliga

                                               44
45
• Brand new channel for all our customers

• New local productions and winning formats

• MasterChef: the world’s most successful cookery show
 – 24 one-hour episodes
 – Outstanding local judges including youngest Michelin
   star chef and a master sommelier
                                                            MasterChef

   Justin Leone   Ralf Zacherl   Sybille Schönberger
                                                       46
47
Sky+ free as
                   standard       Entertainment
                                      Pack

                    Sky Go
                     Extra
First streaming                                       Brand new
    service       Sky Go Extra   Box Sets launched                 Coming in
                                                      streaming   Summer 2017
                                                       service

                  On demand                            Sky+Pro
                   launched      New user interface
                                         48
Sky On Demand              Enhanced UI              WiFi
Thousands of titles        Regularly updated with   Built-in WiFi for easy
available on demand        software downloads       connection to the Internet

Record                                              Ultra HD ready
Record one program while                            For the most stunning TV
watching another at the                             experience, live and on demand
same time

Series                                              1TB HDD
Record and store entire                             Store up to 120 hours of
series at a touch of a                              recordings in HD quality
button

                                  49
Attracting new      Accessible price           Broad range of     Applying proven
pay-lite customers    point, immediate          devices available    segmentation
                     access, no contract                               strategy

                                           50
Huge growth in      More channels extends    Sky Sport News going
advertising revenue      the opportunity      free-to-air in December

                                51
• Coming in summer 2017

• Entering €1.5bn transactional market

• Mix of local and global movies

• Buy & Keep launching at same time

                                         52
Pay TV headroom and penetration
• Returned to customer growth in last
  3 quarters

• Best TV and broad distribution

• Established free-to-air position

• Leading and innovative content creator
                                                               18m
• Highest ever customer satisfaction                   29%

• Strong brand
                                        53
1.            2.            3.
Creating the   Offering a     Delivering
  best TV      choice of    broad revenue
 experience    platforms       growth

                   54
Home of blockbuster movies        Home of world’s best dramas

   Home of sport for all     55
                                  Home of family entertainment
Targeted
                           App launched       Kids App      advertising

restart

           Streaming
          box launched                                      On Demand
                         Box Sets launched   Sky Go Extra
                                                                HD

                              NOW TV            New           Sky Q
                             launched         homepage
                                 56
New range of   Available on smartphones   Streaming to TV HD coming
  passes            & other devices       with NOW TV box   soon
                                          57
Best content
 on choice of
  platforms

Partnering with
 leading telcos

                  58
• Take share in pay and free-to-air
 – 3 FTA channels with TV8 fastest growing in Italy
 – Grow pay-TV on back of content investment

• Roll out innovation
 – Launch Sky AdSmart in 2017

• Grow digital inventory

                                                59
UK and Ireland   Germany and Austria   Italy

                      60
• Relentless drive for efficiency

• Culturally important

• A core capability at Sky

• Fuel to invest in content and innovation

• 2016/17 our biggest year ever

• Over £300m of further value this year
                                          61
• Continued broad growth in UK and Ireland                  Earnings per share

• Execute proven strategy in Germany and Italy
                                                                        63.1p
• Launch and grow transactional revenues
                                                                49.0p

• Build a scale advertising business
                                                        24.9p

• Launch and scale mobile
                                                        2008    2012    2016    2020

• Realise efficiencies in market and from integration
                                            62
EPS is from continuing operations
• 2015/16 - building blocks in place for future

• Strong plans for 2016/17 in each market

• Continue to invest for customers

• Strong, sustainable, revenue and profit growth

                                                   A League Of Their Own

                                          63
Q&A
      The X Factor

65
APPENDIX
           Formula 1®
2,000

      1,500

     1,000

       500

          0
                  Nil          Nil

               2015/16      2016/17     2017/18      2018/19   2019/20    2020/21   2021/22   2022/23   2023/24   2024/25   2025/26 >10-15 years       >15 years

                                                                         USD        EUR       GBP

GBP/EUR @ 1.20                                                                                                                       Average debt maturity of 6.9 years
USD are shown based on their hedged GBP or EUR equivalent                                                                                c70% of gross debt is in Euros
                                                                                     67
(£918m)           £6,218m

                                                                (£229m)        £5,300m
£5,056m      +£1,216m                      (£758m)

                          (£473m)

 Net Debt     Operating   Net Interest,    Dividends and        Acquisitions   Underlying      Unfavourable     Net Debt
 June 2015    Cashflow    taxation, JV’s        ESOP             (inc Sky DE    Net Debt    non-cash movement   June 2016
                            and Other                           minorities)    June 2016      (predominantly
                                                                                               Euro FX rates)

                                                           68
Corporate
                                                               Acquisition     Acquisition   Restructuring                   Amortisation of                     Statutory
                                           Adjusted Income     Transaction     Integration   and Efficiency     IAS39          Acquired         Tax impact of      Income
    £'m                                       Statement           Costs           Costs       Programmes      Derivatives     Intangibles      Adjusting Items   Statement

    Revenue                                     11,965                                                                                                             11,965
    Direct Costs                               (6,102)                            (18)            (28)            (8)                                             (6,156)
    Gross Profit                                5,863                                                                                                              5,809
    Operating Costs                            (4,305)             (4)            (66)           (114)                           (343)                            (4,832)
    Operating Profit                             1,558             (4)            (84)           (142)            (8)            (343)                -              977
    Joint Ventures                                 9                                                                              (7)                                 2
    Net Interest                                 (221)                                                            (6)                                               (227)
    Profit before Tax                           1,346              (4)            (84)           (142)           (14)            (350)               -               752
    Taxation                                    (269)                                                                                               180             (89)
    Profit after Tax                             1,077             (4)            (84)           (142)           (14)            (350)              180              663

    EPS (p)                                      63.1                                                                                                              39.0
    W. Av shares                                1,707                                                                                                              1,707

    Equity Shareholders                         1,077                                                                                                              666
    Non-controlling interest                       -                                                                                                               (3)

•   Our income statement for the year has been adjusted for the following items:
     –    Advisory and transaction fees incurred on the purchase of Sky Italia and Sky Deutschland
     –    Costs relating to the integration of Sky Italia and Sky Deutschland and the achievement of synergies in the enlarged Group
     –    Costs relating to the corporate restructuring & efficiency programmes
     –    Remeasurement of all derivative financial instruments not qualifying for hedge accounting and hedge ineffectiveness
     –    Amortisation of acquired intangible assets                                      69
     –    Tax effect of above items
Corporate                                                      Profit on sale of
                                         Adjusted     Acquisition   Acquisition   Restructuring                  Amortisation of     Profit on         stake in                      Statutory
                                          Income      Transaction   Integration   and Efficiency     IAS39          Acquired       sale of Stake      National       Tax impact of     Income
    £'m                                 Statement        Costs         Costs       Programmes      Derivatives     Intangibles         in ITV        Geographic Adjusting Items      Statement

    Revenue                               9,989                                                                                                                                        9,989
    Direct Costs                         (5,002)                                       (10)                                                                                           (5,012)
    Gross Profit                          4,987                                                                                                                                        4,977
    Operating Costs                      (3,619)         (50)          (10)            (95)                           (231)                                                           (4,005)
    Operating Profit                      1,368          (50)          (10)           (105)             -             (231)              -                -              -              972
    Joint Ventures                           28                                                                                                                                          28
    Net Interest                          (200)           (57)                                        (18)                                                                             (275)
    Profit on the sale of investments         -                                                                                        492              299                             791
    Profit before Tax                     1,196          (107)         (10)           (105)           (18)            (231)            492              299               -            1,516
    Taxation                               (251)                                                                                                                         67            (184)
    Profit after Tax                        945          (107)         (10)           (105)           (18)            (231)            492              299              67            1,332

    EPS (p)                                56.0                                                                                                                                         79.1
    W. Av shares                          1,690                                                                                                                                        1,690

    Equity Shareholders                   947                                                                                                                                          1,337
    Non-controlling interest              (2)                                                                                                                                           (5)

•    Our income statement for the year has been adjusted for the following items:
      –    Advisory and transaction fees and finance costs incurred on the purchase of Sky Italia and Sky Deutschland
      –    Costs relating to the integration of Sky Italia and Sky Deutschland and the achievement of synergies in the enlarged Group
      –    Costs relating to the corporate restructuring & efficiency programmes
      –    Remeasurement of all derivative financial instruments not qualifying for hedge accounting and hedge ineffectiveness
      –    Amortisation of acquired intangible assets
      –    Profit on disposal of our stake in ITV
      –    Profit on disposal of our stake in National Geographic                          70
      –    Tax effect of above items
£m                                                          2015          2016    Change
    Operating Profit                                              1,397       1,558    +12%

    Operating profit (statutory)                                  1,368       1,558

    JVs and Associates                                              28         9       (68%)   Disposal of interest in Nat Geo

    Interest costs                                                (200)       (221)    +10%    Full year impact increased level of debt

    Tax                                                           (251)       (269)     +8%

    Effective tax rate                                            21.0%       20.0%            Reduction of 1% in UK corporate tax rate

    Profit after tax                                               945        1,077    +14%

Twelve months ended 30 June and 2016 includes the benefit of the 53rd week.
                                                                                71
£m                                                         2015           2016

    Adjusted EBITDA                                            1,993          2,276
                                                                                           First full year consolidation of Italy and Germany and
    Working Capital                                              188          (86)         phasing of key rights payments year on year
    Capex                                                       (519)         (559)        Investing in growth projects (e.g. NOW TV combo, mobile)

                                                                                           First full year consolidation of Italy and Germany
    Capitalised STBs                                            (85)          (205)        Capitalisation of Sky Q boxes

    Operating free cash flow                                   1,577          1,426
    Campus development                                         (139)          (135)
                                                                                           Annualised impact of higher debt
    Interest, tax and JV’s                                     (378)          (430)
                                                                                           Higher tax from increased profit
     Free cash flow                                            1,060          861

Twelve months ended 30 June and 2016 includes the benefit of the 53rd week.
                                                                                      72
You can also read