PRESENTATION OF 1H2020 RESULTS - Arvida Group Limited Six Months Ended 30 September 2019
←
→
Page content transcription
If your browser does not render page correctly, please read the page content below
PRESENTATION OF
  1H2020 RESULTS

                 Arvida Group Limited
  Six Months Ended 30 September 2019

                       19 November 2019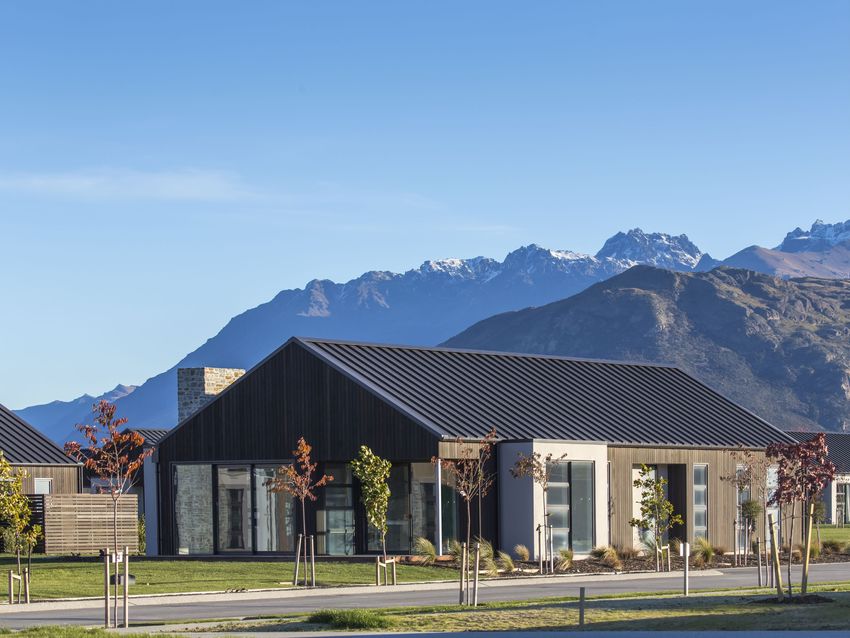
1H2020 RESULT HIGHLIGHTS
Continued excellent financial and operational performance
31% lift in Underlying Profit1 to $23.4m
Consistently high care occupancy at 95%; underpins recurring care cash flows
148 resales and 44 new sales settled; total number of sales up 16% on pcp
53% lift in total gains to $17.9m; reflects increased volume, pricing and margin
Delivered 94 new units in 1H20, on track to deliver 200 in FY20 in line with guidance
Annual delivery rate to exceed 250 units in FY21
Completed acquisition of three quality villages and $152m capital raising
Conducted second staff engagement survey; recorded 96% staff give their best
everyday and broad improvement
Additional care facility achieved 4 year certification; 18 (72%) care facilities have now
attained gold standard 4 year certification
1. Underlying Profit is a non-GAAP unaudited financial measure and differs from NZ IFRS net profit after tax. A reconciliation to Reported Net Profit after Tax is provided in the
financial section of this presentation and definition appended.
1H20 RESULTS PRESENTATION
2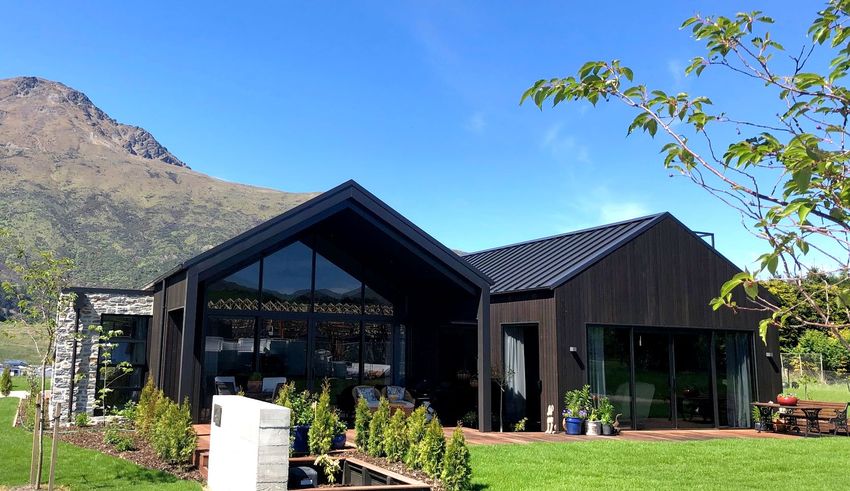
UNDERLYING GROWTH TRENDS

Revenue ($m)                                                                                                       Underlying Profit1 ($m)
                                                                                                                                                                                                      +31% pcp
                                                                                           +5% pcp
                                                                                                                                                                                                       23.4
                                                                                            79.6
                                                                             76.7                                                                                  20.6                       20.7
                                                               75.7
                                                72.3                                                                                                                              17.9

                                                                                                                                      13.5
                                                                                                                                                     12.4
                                  60.0
                                                                                                                        9.6
                   54.5

     46.9

     1H17          2H17           1H18          2H18           1H19          2H19          1H20                         1H17          2H17           1H18          2H18           1H19       2H19      1H20

Operating Cash Flow ($m)                                                                                          Total Assets ($m)
                                                                                                                                                                                                     +53% pcp

                                                                                                                                                                                                       1,842
                                                                             43.1
                                                39.4                                       +17% pcp

                                                                                                                                                                                             1,300
                                                                                           30.4                                                                                  1,203
                                                                                                                                                                   1,132
                   24.3                                        26.0
                                                                                                                                       795           847
     15.4                         14.5                                                                                  537

     1H17          2H17           1H18          2H18           1H19          2H19          1H20                         1H17          2H17           1H18          2H18           1H19       2H19      1H20

1. Underlying Profit is a non-GAAP (unaudited) financial measure and differs from NZ IFRS net profit after tax. A reconciliation to Reported Net Profit after Tax is provided in the
financial section of this presentation and definition is appended.
                                                                                                                                                                                         1H20 RESULTS PRESENTATION
                                                                                                                                                                                                                 3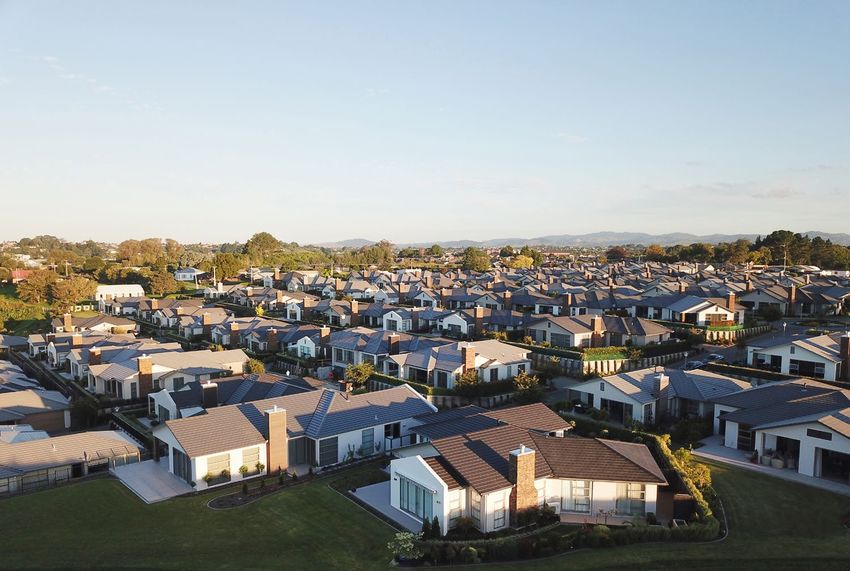
BUSINESS
OVERVIEW

           4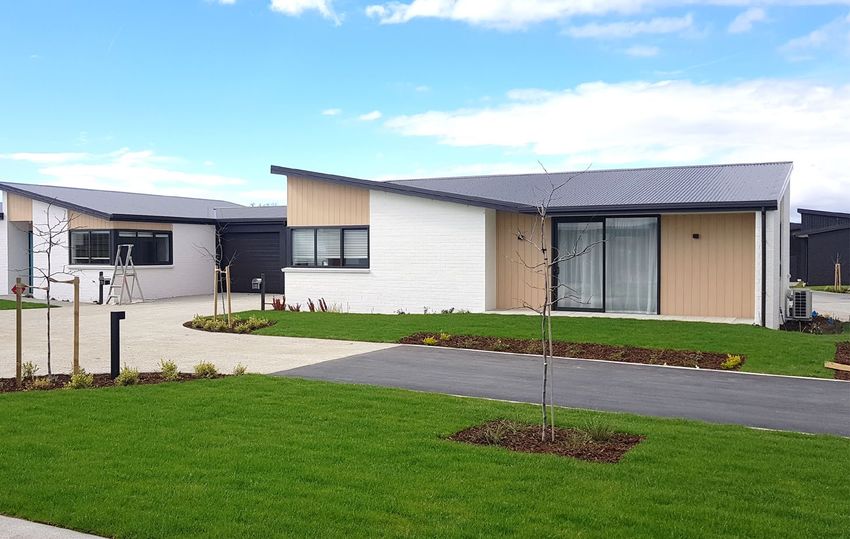
OUR STATED STRATEGY

                      1H20 RESULTS PRESENTATION
                                              5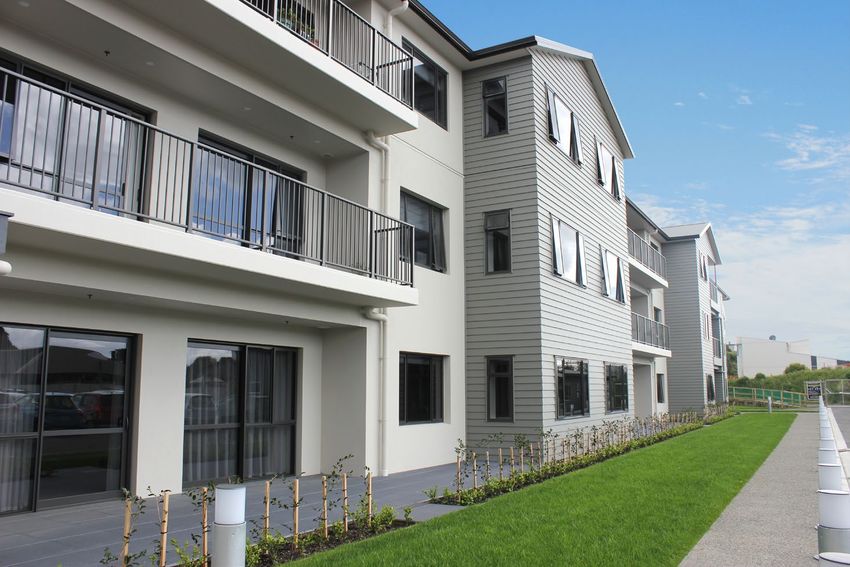
OPERATIONAL HIGHLIGHTS
Consistently high care occupancy of 95% maintained, which remains significantly above average
sector experience
95%
Eighteen of our 25 care facilities have now fully achieved the gold standard of four-year Ministry of Occupancy
Health certification:
− Track record of improvement to Ministry clinical standards that is both a reflection of the
work completed by village and clinical managers on clinical quality as well as implementing 72%
4-year
The Attitude of Living Well model of care across the Group cert
Electronic resident management system embedded in all 25 care facilities enabling individualised
and real time care to meet the changing needs of residents. Medimap electronic medication
management system also integrated with this system further assisting to improve workplace Engagement
efficiencies index at
Village Manager awarded Legendary Service award at NZ Aged Care Association conference
Second annual survey of staff engagement and motivation completed:
86%
− Staff engagement in their everyday work indexed at 86%, up from 78%
− 96% of staff again confirmed they were determined to give their best effort at work each day
13,500 training courses completed by staff through the Altura learning portal; trend of more training
No health and safety incidents reported to Worksafe in the period albeit minor incidents of a
non-serious nature occurred and Worksafe did carry out an assessment visit with issues addressed:
− A positive culture of reporting accidents and incidents exists and an electronic quality,
health, safety & environmental management reporting tool has been implemented
− In the staff survey 88% of staff considered Arvida to have a safe work environment,
a strong improvement on the prior survey
A recent audit of all of our development and construction sites confirmed a positive
health and safety environment
1H20 RESULTS PRESENTATION
6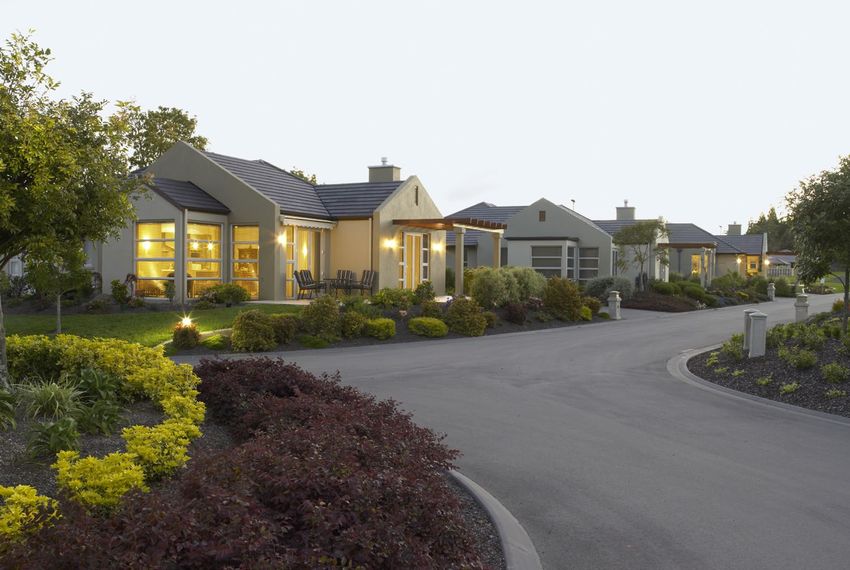
PORTFOLIO

             1H20 RESULTS PRESENTATION
            Image of Queenstown Country Club
                                         7   villa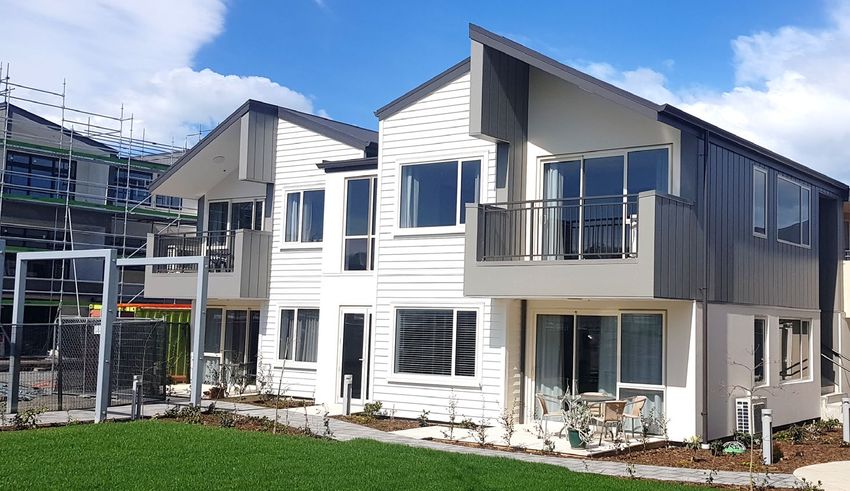
THREE QUALITY VILLAGES ACQUIRED
BETHLEHEM SHORES BETHLEHEM COUNTRY CLUB
Portfolio changes:
Three high quality villages acquired for $180m funded
through a combination of $142m new equity capital,
$10m vendor scrip and a tranche of new bank debt.
Completion occurred on 31 July 2019 as scheduled with
integration now largely complete. Onboarding of
village and construction teams was seamless. Updating
of sales collateral, websites, legal documents,
application forms and sales processes completed
Our first greenfield site, Waimea Plains in Richmond, is
now open. The first stage of 38 villas is complete and
the first residents have moved in
Wendover in Christchurch was closed in August after
QUEENSTOWN COUNTRY CLUB consideration of redevelopment options. The property
is currently being marketed for sale
1H20 RESULTS PRESENTATION
8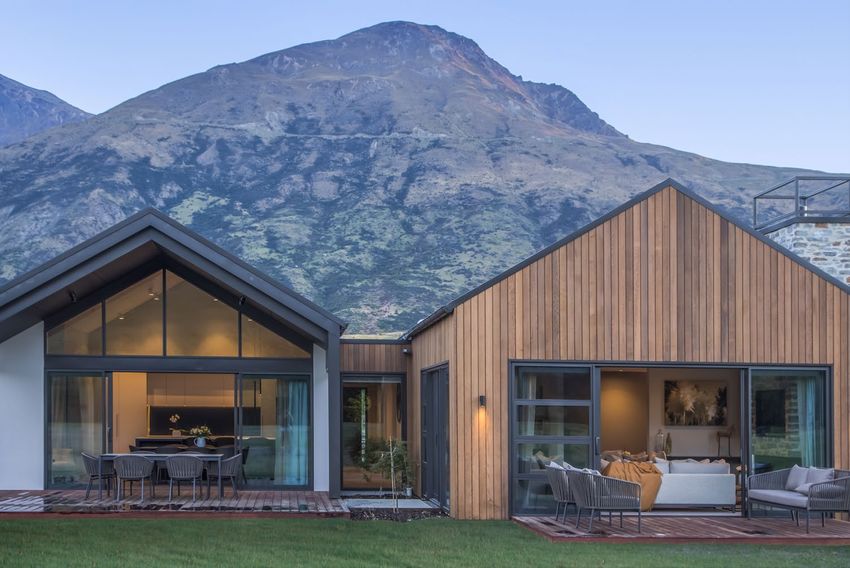
ARVIDA IS CARE FOCUSED

                                        CARE                              VILLAGE

                                         Assisted                  Assisted                 Independent
                                          Living                    Living
                                                                                                                      32 Villages
                                            Beds                  SAs/Care                     ILUs        Total
                                                                                                                      20 integrated villages
North Island                                 891                       304                     1,329       2,524      5 care facilities
                                                                                                                      7 retirement villages
South Island                                 791                       373                     353          1,517
                                                                                                                      1 Greenfield Site
Total existing stock                        1,682                      677                    1,682        4,041

Brownfield                                    29                       480                     667          1,176

Greenfield                                     -                        155                    362          517

Development pipeline                          29                       635                    1,029        1,693

Decommissions                               (121)                       (9)                      -         (130)

Total built                                1,590                      1,303                    2,711       5,604

                                        Standard                  Subject to                 Subject to    Current
                                          (govt                   ORA with                   ORA with     portfolio
                                       funded) &                     DMF                        DMF        is 58%                         Existing Village
                                           PAC                    structure;                 structure;    needs-
                                       (premium                      care                     villas &      based                         Existing Village with Development
                                         charge)                   services                 apartments    accomm.
                                          beds                    delivered                                                               Future Village (greenfield site)

     1. Portfolio metrics include Village at the Park in which Arvida has a 50% interest.

                                                                                                                                                  1H20 RESULTS PRESENTATION
                                                                                                                                                                          9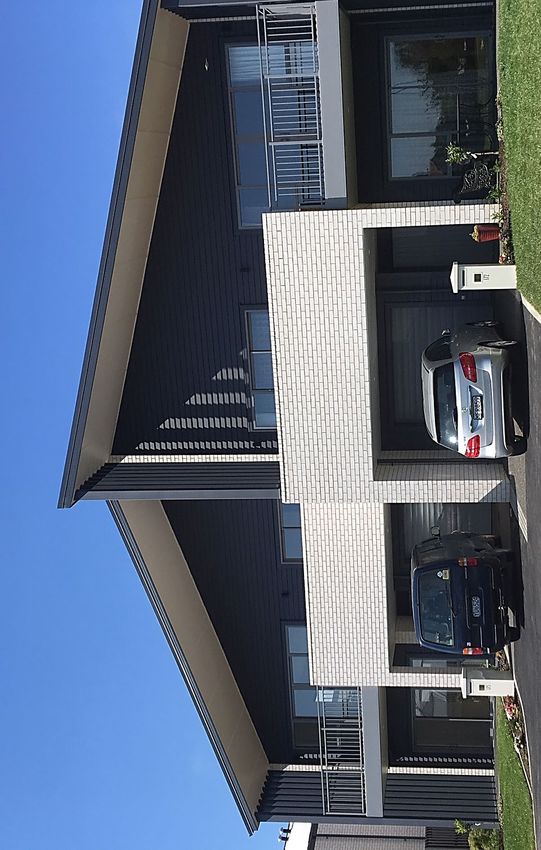
DEVELOPMENT
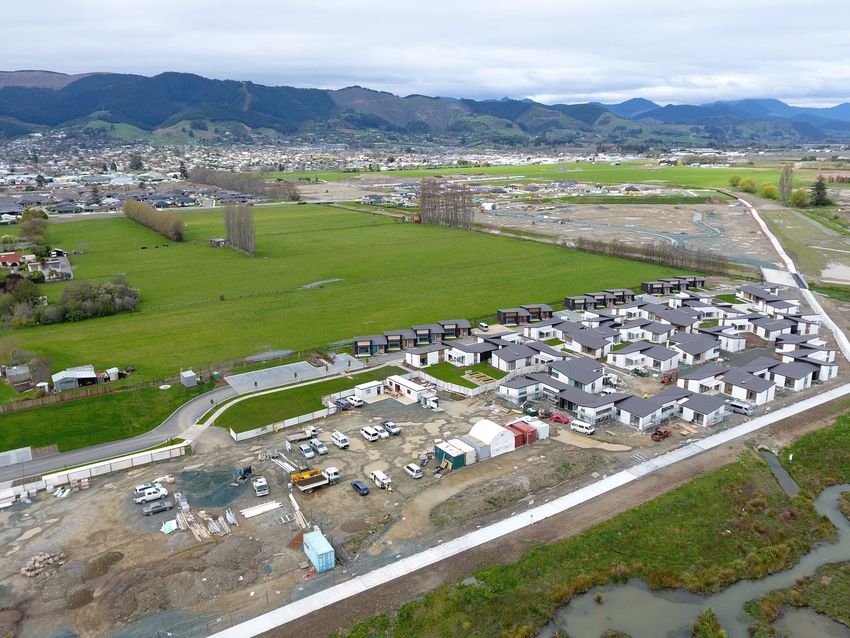
Waimea Plains
8 hectares in Richmond
Boundary line indicative onlyDEVELOPMENT IN PROGRESS AND PLANNED
New Unit Delivery 1H20 2H20 FY20 Av. $000 Commentary
Lauriston Park 12 - 12 718 On track to deliver 106 units in 2H20, in line with
1,045 meeting target delivery of 200 units for FY20
Bethlehem Country Club 2 4 6
Plans in place to deliver 250+ units in FY21
Bethlehem Shores 4 5 9 1,100
Internal construction teams working across four
Glenbrae - 10 10 278 villages, with new National Head of Construction
Mary Doyle 3 9 12 835 appointed
Construction progressing well on care
Village at the Park 24 - 24 729
developments at Aria Bay and Copper Crest, both
Waimea Plains 38 - 38 532 tracking to a FY21 delivery
St Albans 4 21 25 531 Resource consent received for Lauriston Park care
and apartments development, with construction to
Park Lane - 49 49 595
commence next year
Queenstown Country Club 7 8 15 1,219 Application for resource consent at Kerikeri is still
Total 94 106 200 progressing, anticipate earthworks to commence on
receipt
New Unit delivery Construction commenced on next stage of 25 villas
at Waimea Plains
250+ Well progressed on plans for care facilities at
200 Bethlehem Shores and Queenstown Country Club
Artist impression.
113
97
FY 18 19 20e 21e
1H20 RESULTS PRESENTATION
11LAURISTON PARK, CAMBRIDGE BETHLEHEM COUNTRY CLUB, TAURANGA
12 Villas completed; 4 sales settled 1H20, 3 settled 2H20, 2 Villas completed; 1 sale settled 1H20, 1 sale settled 2H20
3 contracted
BETHLEHEM SHORES, TAURANGA MARY DOYLE, HAVELOCK NORTH
4 Villas completed; 3 sales settled 1H20, 1 sale settled 2H20 3 Villas completed; 2 sales settled 1H20, 1 sale settled 2H20
1H20 RESULTS PRESENTATION
12VILLAGE AT THE PARK, WELLINGTON WAIMEA PLAINS, RICHMOND
24 Apartments completed; 21 sales settled 1H20, 3 sales settled 38 Villas and townhouses completed; 1 sale settled 1H20, 5 sales
2H20 settled 2H20, 18 sales contracted
ST ALBANS, CHRISTCHURCH QUEENSTOWN COUNTRY CLUB, QUEENSTOWN
4 Apartments completed; 1 sale settled 1H20, 1 sale settled 2H20, 7 Villas completed; 7 sales settled 1H20
2 contracted
1H20 RESULTS PRESENTATION
13DEVELOPMENT PIPELINE OF 1,693 UNITS
1H20 RESULTS PRESENTATION
141H20 FINANCIALS
REPORTED PROFIT (IFRS)
NZ$m 1H20 1H19 YoY change FY19 Commentary
Care & village service fees 64.1 62.7 2% 125.6 Revenue grew 5% to $79.6m on
continuing strong core operational
Deferred management fees 12.9 10.4 24% 21.4
performance and recent acquisitions;
Other revenue 2.6 2.6 (2%) 5.4 offset by rest home bed decommissions
DMF up 24% which included a two
Total revenue 79.6 75.7 5% 152.4
month contribution from the recent
Gain on acquisition of villages 3.7 0.0 nm 0.0 acquisitions of $1.4m
Changes in fair values 33.3 24.5 36% 46.4 Strong fair value increases reflect the
recent village acquisitions, delivery of
Share of profit arising from JV (net of tax) 3.1 0.7 371% 3.4 new units and the increase in existing
Total income 119.7 100.9 19% 202.2 unit pricing during the year
Operating expenses increased 7% due
Operating expenses (68.4) (63.9) 7% (129.9) to the acquired villages, higher nursing
Depreciation (2.8) (2.4) 11% (5.0) costs, inbuilt increases in caregiver
rates, higher minimum wages and
Total expenses (71.2) (66.3) 7% (134.9) increasing insurance costs
Operating profit 48.5 34.6 40% 67.3 Income tax expense is benefiting from a
higher tax shield
Financing costs (2.3) (1.7) 35% (3.6)
Impairment of goodwill 0.0 0.0 nm (1.5) Head Office Costs 1H20 1H19
One-off items (0.5) (0.2) 181% (0.3) Employee costs 3.2 3.1
Profit before income tax 45.7 32.7 40% 61.9 Other 1.4 1.8
Income taxation (0.7) (2.2) (66%) (2.8) Total expense 4.6 4.9
Net profit after tax 45.0 30.5 47% 59.1 Capitalised wages 1.2 0.7
1H20 RESULTS PRESENTATION
16NEW UNIT ORA SALES
Sales Analysis1 1H20 1H19 YoY change FY19 Commentary
New Sales Settled sales of 44 new units in 1H20
ILUs 43 27 59% 64 A further 20 sales settled 2H20 to date
Gross value of sales up 98% from 1H19, reflecting
Serviced apartments 1 1 - 1
increased volume and sale prices
Care suites - 2 (100%) 5 Average gross value per new sale settlement at
Total new units sold 44 30 47% 70 $779k, up from $578k in 1H19
34.3 17.3 98% 44.3 Available new sale uncontracted stock is 3% of
Value $m
total ORA portfolio
Av. value per new sale $000 779 578 35% 633
Continue to receive steady enquiry for new
Development gain $m 5.2 2.6 100% 7.5 product
Adj. development margin % 19% 16% 18%
New Sale Volumes New Sales ($m) and Margins2
40 20%
19% 19%
76
16% 34.3
30 15%
20 10%
44
40
17.3
30
10 5%
20 3.6
12 3 1.2
0 0%
1H 2H $m 1H17 1H18 1H19 1H20
2017 2018 2019 2020 New Sales Margin (RHS)
1. The figures above include Village at the Park , which is 50% owned by Arvida. The “Value $m” line includes 100% of the value and the “Development gain $m” line includes
50% of gains. A table is appended that excludes Village at the Park from the above.
2. Margin for 1H18 was 43% on 3 sales 1H20 RESULTS PRESENTATION
17ORA RESALES
Sales Analysis1 1H20 1H19 YoY change FY19 Commentary
Resales Resale of 148 units, 10% up on 1H19
Occupancy remains high, with around 50 units
Villas / apartments 53 40 33% 90
available for resale or 2% of total ORA portfolio
Serviced apartments 93 88 6% 159 Gross proceeds of $53.9m, with average value per
Care suites 2 7 (71%) 9 resale up 17% to $364k
Realised $12.7m of resale gains and an
Total resales 148 135 10% 258 improvement in resale margins to 24%
Value $m 53.9 42.1 28% 87.1 Resales price achieved was on average 3% above
the unit pricing assumed in 31 March 2019
Av. value per resale $000 364 312 17% 338
independent valuations
Resale gains $m 12.7 9.1 40% 19.5 DMF realised on resales was $8.7m, excluding
Village at the Park
Resale margin % 24% 22% 23%
Resale Volumes and Margins Average Resale Prices ($000)
150 30%
24%
533
22% 25%
19% 19% 458
100 20% 429
88 93 15% 328
271
50 67 68 10% 250 256
227 217
53 195
40 5%
30 7 2
20
0 0%
1H17 1H18 1H19 1H20 1H17 1H18 1H19 1H20
ILUs SAs CS Margin (RHS) ILUs SAs CS
1. The figures above include Village at the Park , which is 50% owned by Arvida. The “Value $m” line includes 100% of the value and the “Resale gain $m” line includes 50% of
gains. A table is appended that excludes Village at the Park from the above.
1H20 RESULTS PRESENTATION
18UNDERLYING PROFIT RECONCILIATION
NZ$m (Unaudited) 1H20 1H19 YoY change FY19 Commentary
Net profit after tax 45.0 30.5 47% 59.1 Underlying Profit increased 31% to
$23.4m
Change in fair values (36.1) (25.0) 44% (49.1)
On a cents per share basis, the
Deferred tax (0.2) 0.5 (151%) (0.2) increase in Underlying Profit was 16%,
representing a CAGR of 13% over the
Impairment of goodwill 0.0 0.0 nm 1.5
last 4 years
Gain on acquisition (3.7) 0.0 nm 0.0 The key drivers were:
One-off costs 0.5 0.2 181% 0.3 − The recent acquisition of new
villages contributed to the
Underlying operating profit 5.5 6.2 (12%) 11.6 underlying profit; and
Gains on resales 12.7 9.1 41% 19.5 − 192 sales (up 16% on 1H19) with
higher volumes and margins
Gain on sale of new units 5.2 2.6 97% 7.5
driving the increase in total gains
Underlying profit1 23.4 17.9 31% 38.6
1. Underlying Profit is a non-GAAP unaudited financial measure and differs from NZ IFRS net profit after tax. A definition is
appended.
Movements in Underlying Profit NZ$m Underlying Profit (cents per share)
+16%
2.5
+17%
3.2 23.4 5.0
+7%
(0.2)
4.3
17.9 3.7
3.5
1H19 Underlying Corporate & Existing FY20 1H20 Underlying
Profit Interest portfolio Acquisitions Profit 1H17 1H18 1H19 1H20
1H20 RESULTS PRESENTATION
19BALANCE SHEET
NZ$m 1H20 FY19 Commentary
Cash and cash equivalents 5.1 4.6 Total asset base now over $1.8b,
with $1.5b of investment property
Property, plant and equipment 173.8 168.7
Desktop valuations of retirement
Investment property 1,547.9 1,021.6 villages completed by CBRE and
JLL with no material changes to the
Investment in JV 26.8 24.3
valuers assumptions
Intangibles 53.9 54.0 The value of Investment Property
Other assets 34.2 26.4 increased $526m (vs FY19) as a
result of:
Total assets 1,841.7 1,299.6 − $427m of village acquisitions
External debt 273.4 190.1 − $57m of development activity
− $35m of fair value increases
Residents’ loans 713.0 466.1
Total portfolio Embedded Value
Deferred tax liability 24.0 27.7 (EV) was up $108m since 31 March
Other liabilities 101.6 66.0 2019 to $371m. The major change
was the acquisition of $88m of EV
Total liabilities 1,112.0 749.9 through the recent transaction
Net assets 729.7 549.7 On a per share basis, EV represents
68 cents per share, 8% increase on
Movements in Investment Property (NZ$m) FY19
EV is an indicator of the potential
427 35 1,548 future cash flows from realised
57 resale gains and deferred
1,022 7
management fee receivables
FY19 Capex Development Village Village 1H20
spend acquisitions revaluations
1H20 RESULTS PRESENTATION
20CAPITAL STRUCTURE
NZ$m 1H20 1H19 YoY change FY19 Commentary
Investment property 1,548 928 67% 1,022 Total drawn debt of $274m includes
development project work in progress of $92m,
ORA / DMF (753) (458) 64% (490)
development land of $104m and the balance
Retirement villages 795 470 69% 532 covered by stock
A third tranche was added to the bank debt
Care facilities 201 201 0% 201
facility in June 2019. Facility C has a limit of
996 671 48% 733 $125m and tenure of 4 years
Investment in JV 27 22 23% 24 The total facility of $375m is split evenly
between three tranches with expiry dates of
Implied value 1,023 693 48% 757 June 2021, June 2022 and June 2023
Net debt (269) (148) 82% (186) Interest rate hedges at balance date equated to
26% of drawn debt. Hedges have a weighted
Net implied value 754 545 38% 571
average maturity of 3.5 years and a weighted
Net implied value per share $1.39 $1.32 5% $1.38 average fixed rate of 2.8%
Bank Debt Facilities Bank Covenants
NZ$m 1H20 1H19 YoY change FY19 Actual Covenant
Debt per accounts 273.4 149.6 83% 190.1 Interest cover 3.6x 2.25x
Plus: Capitalised costs 0.6 0.5 20% 0.4 Loan to value 30.6% 50%
Drawn debt 274.0 150.1 83% 190.5
Less: Cash 5.1 2.5 104% 4.6
Total Net Debt 268.9 147.6 82% 185.9
Gearing (ND / ND + E) 27% 22% 25%
1H20 RESULTS PRESENTATION
21CASH FLOWS
NZ$m 1H20 1H19 YoY change FY19 Capital Expenditure
Receipts from residents for care fees and
66.6 65.4 2% 130.9 NZ$m 1H20
village services
Residents’ loans from resales 48.8 35.7 37% 76.3 Purchase of furniture & fittings 1.9
Residents’ loans from new sales 18.4 15.6 18% 39.6 Development capital expenditure 56.8
Repayment of residents’ loans (32.8) (20.4) 61% (46.3) ILU refurbishment 2.4
Payments to suppliers and employees (67.1) (66.6) 1% (124.3) SA unit refurbishment 1.2
Financing costs (net) (2.0) (1.6) 25% (3.3) Care facility refurbishment 0.2
Taxation (1.5) (2.0) (25%) (3.8) General building works 1.5
Net cash flow from operating activities 30.4 26.0 17% 69.1 Unit title buybacks 4.1
Purchase of investment property (63.1) (38.7) 63% (105.5) Total capital expenditure 68.1
Purchase of property, plant and equipment (2.6) (2.3) 11% (4.3)
Payments for investments in villages (169.5) 0.0 nm 0.0 Is represented by:
Purchase of property, plant &
Capitalised interest paid (2.4) (1.2) 92% (3.2) 2.6
equipment
Net cash flow from investing activities (237.6) (42.3) 462% (113.0) Purchase of investment property 63.1
Net cash flow from financing activities 207.7 15.5 1236% 45.3 Capitalised interest 2.4
Closing cash balance 5.1 2.5 109% 4.6 Net cash from investing activities 68.1
1H20 RESULTS PRESENTATION
22DIVIDEND AND OUTLOOK
Commentary Dividend (cents per share)
1.45 cps dividend declared for 2Q of FY20:
− Brings total dividend for 1H20 to 2.90 cps, 12% up on 5.35
5.01
the corresponding prior period 4.45
4.12 4.25
Record date for entitlement is 3 December 2019, payment on
11 December 2019:
− Ordinary dividend partially imputed with 0.10 cps of
1.45
imputation credits and supplementary dividend of
0.045 cps payable for non-resident shareholders
1.45
Current quarterly dividend sustainable for FY20
The business is continuing to perform well, with good FY15 1 FY16 FY17 FY18 FY19 FY20e
momentum in earnings and lift in our full year targets following 1Q 2Q 3Q 4Q Special
completion of the recent acquisitions
Sector Challenges Business Outlook
Aged Residential Care Funding Model Review recommended The increasing build rate from development activities will
further stratification of funding however sufficiency of overall deliver future growth in earnings and shareholder value. With
care funding remains a key sector challenge a large development pipeline in place, a proven development
Disparity in nurse pay to public sector has not been addressed in capability and the creation of an internal construction team,
public policy creating instability in the skilled workforce of those we are confident in our ability to deliver an increasing number
employers seen as offering unattractive terms of units
Construction sector remains tight and continues to place The stabilisation of the housing sector with interest rates likely
pressure on margins and delivery timeframes to be at record lows for the foreseeable future, assists with
conversion of embedded value to cash
Integrating village operations and leveraging care expertise to
the wider community provides an opportunity to expand cash
flows for those not prepared to live in villages
1. Annualised. Arvida paid a dividend of 1.03 cps in respect of the FY15
1H20 RESULTS PRESENTATION
23APPENDIX Park Lane Apartments, Christchurch
PORTFOLIO AT 30 SEPTEMBER 2019
         Village                                           Region                Villas       Apts         SA          CS          RH    H     D       2H20     FY21+^
1      Kerikeri                                          Kerikeri                   -           -           -           -           -     -     -        -        280
2      Aria Bay                                          Auckland North             -          34          17           -          37     -     -        -      117 (37)
3      Aria Gardens                                      Auckland North             -           -           -           -          42    91    20        -         -
4      Aria Park                                         Auckland City              -           -          46           -          40    44     -        -      95 (93)
5      Cascades                                          Hamilton                   -           5          32           -          42    32     -        -        90
6      Lauriston Park                                    Cambridge                 183          -           -           -           -     -     -        -        90
7      Bethlehem Views                                   Tauranga                   -           -           -           -          30    38    20        -         -
8      Copper Crest                                      Tauranga                  156          -           -           -           -     -     -        -        86
9      Bethlehem Country Club                            Tauranga                  147          3           -           -           -     -     -        4         16
10     Bethlehem Shores                                  Tauranga                  150          -           -           -           -     -     -        5        188
11     Glenbrae                                          Rotorua                   78           -          26           -          20    21     -        10        12
12     Mary Doyle                                        Havelock North            161         48          38           8          26    60    64        9         9
13     Olive Tree                                        Palmerston North          95           -          43           -          32     -    17        -         -
14     Molly Ryan                                        New Plymouth              35           -          28           -          20    13     -        -         -
15     Waikanae                                          Kapiti                    4            -          20           -           21   36     -        -         -
16     Lansdowne                                         Masterton                 69           -          29           -          29    21     -        -         -
17     Village at the Park 1                             Wellington                38          123          -           17          -    42    33        -         16
18     Ashwood                                           Blenheim                  18           -          35           -          47    48    26        -         -
19     The Wood                                          Nelson                     5           -          37           -          30    46     -        -         -
20     Oakwoods                                          Nelson                    116          -          45           -          26    22     -        -        30
21     Waimea Plains                                     Tasman                    38           -           -           -           -     -     -        -        237
22     Bainlea House                                     Rangiora                   -           -           -           -           -     -    27        -         -
23     Bainswood on Victoria                             Rangiora                   -           -           -           -          25    32     -        -         -
24     Bainswood                                         Rangiora                  4            -          14           -          26     -     -        -         -
25     St Albans                                         Christchurch               -           -          57           -           -    19     -        21       20
26     Ilam                                              Christchurch               -           -          45           -          22    34    20        -         -
27     Mayfair                                           Christchurch               11          -          23           -          27    35     -        -         -
28     Maples                                            Christchurch               -           -          25           -          49     3     -        -         -
29     St Allisa                                         Christchurch               -           -           -           -          55    34    20        -         -
30     Park Lane                                         Christchurch               8          29          45           -          26    16     -       49         -
31     Rhodes                                            Christchurch               -          34           -           -           -     -     -        -         31
32     Queenstown Country Club                           Queenstown                39           -           -           -           -     -     -        8        270
33     Strathallan                                       Timaru                    51           -          47           -           10   46    20        -         -
         TOTALS                                                                  1,406        276         652          25          682   733   267      106      1,587

     ^ Gross units expected to be delivered (expected decommissions shown in brackets). Subject to final investment decision approval.
     1. Arvida has a 50% interest in Village at the Park.
                                                                                                                                                1H20 RESULTS PRESENTATION
                                                                                                                                                                        25
ADDITIONAL DISCLOSURES
Care Operations NZ$m 1H20 1H19 FY19 Village Operations NZ$m 1H20 1H19 FY19
Rest home fees 18.5 18.9 37.6 RV weekly fees 5.3 4.7 9.3
Dementia fees 7.5 7.6 14.8 Deferred management fees 12.9 10.4 21.4
Hospital fees 25.0 23.9 48.5 Other revenue 1.2 1.2 2.1
Premium fees 2.5 2.2 4.5 Operating revenue 19.4 16.3 32.8
Other revenue 1.1 1.1 2.9 Realised gains on resales 12.7 9.1 19.5
Care revenue 54.6 53.7 108.3 Realised development margin 5.2 2.6 7.5
Serviced apartment fees 5.2 5.5 10.7 Total village revenue 37.3 28.0 59.8
Total care revenue 59.8 59.2 119.0
Sales Analysis excluding Village At The Park
1H20 Resales New Sales
Units $000 Units $000
Villas / apartments 47 25,068 22 18,462
Serviced apartments 88 23,368 1 355
Care suites 2 390 0 0
Total Sales 137 48,826 23 18,817
Value $m 48.8 18.8
Av. value per sale $000 356 818
Gains $m 12.3 3.9
Margin % 25% 21%
1H20 RESULTS PRESENTATION
26DEFINITIONS
Underlying Profit (or Underlying NPAT)
Underlying Profit is a non-GAAP unaudited financial measure used by Arvida to monitor financial performance and determine dividend distributions.
Arvida calculates Underlying Profit by making the following adjustments to Reported Net Profit after Tax:
Removing the change in fair value of investment properties, property, plant and equipment and derivatives (from the Statement of Comprehensive
Income);
Removing any impairment of goodwill;
Removing any loss on disposal of chattels from the decommissioning of development sites;
Removing any gains on acquisition of subsidiaries;
Adding back the Directors’ estimate of realised gains on occupation right agreement units;
Adding back the Directors’ estimate of realised development margin on the cash settlement of the first sale of new ORA units following the development
or conversion to an ORA unit;
Adding back the deferred taxation component of taxation expense so that only current tax expense is reflected; and
Adding back transaction costs.
Resale Gain
The Directors’ estimate of realised gains on resales of ORA is calculated as the net cash flow received by Arvida on the settlement of the resale of pre-existing
ORAs (i.e. the difference between the ORA licence payment received from the incoming resident and the ORA licence payment previously received from the
outgoing resident).
Development Margin
The Directors’ estimate of realised development margin is calculated as the cash received on settlement of the first sale of new ORA units less the development
costs associated with developing the ORA units.
Development costs include:
Construction costs directly attributable to the relevant project, including any required infrastructure (e.g. roading) and amenities related to the units (e.g.
landscaping) as well as any demolition and site preparation costs associated with the project. The costs are apportioned between the ORA units, in
aggregate, using estimates provided by the project quantity surveyor. The construction costs for the individual ORA units sold are determined on a pro-
rated basis using gross floor areas of the ORA units;
An apportionment of land valued based on the gross floor area of the ORA units and care suites developed. The value for brownfield development land is
the acquisition cost or the estimated fair value of land at the time a change of use occurred (from operating as a care facility or retirement village to a
development site), as assessed by an external independent valuer. Greenfield development land is valued at historical cost; and
Capitalised interest costs to the date of project completion apportioned using the gross floor area of ORA units developed.
Development costs do not include:
Construction, land (apportioned on a gross floor area basis) and interest costs associated with common areas and amenities or any operational or
administrative areas.
1H20 RESULTS PRESENTATION
27IMPORTANT NOTICE
Disclaimer
The information in this presentation has been prepared by Arvida Group Limited with due care and attention. However, neither the Company nor any of its
directors, employees, shareholders nor any other person shall have any liability whatsoever to any person for any loss (including, without limitation, arising from
any fault or negligence) arising from this presentation or any information supplied in connection with it.
This presentation may contain projections or forward-looking statements regarding a variety of items. Such projections or forward-looking statements are
based on current expectations, estimates and assumptions and are subject to a number of risks, uncertainties and assumptions. There is no assurance that
results contemplated in any projections and forward-looking statements in this presentation will be realised. Actual results may differ materially from those
projected in this presentation. No person is under any obligation to update this presentation at any time after its release to you or to provide you with further
information about Arvida Group Limited.
A number of non-GAAP financial measures are used in this presentation. You should not consider any of these in isolation from, or as a substitute for, the
information provided in the unaudited consolidated financial statements for the six months ended 30 September 2019, which will be made available at
www.arvida.co.nz.
Forward-looking statements are subject to any material adverse events, significant one-off expenses or other unforeseeable circumstances.
The information in this presentation is of a general nature and does not constitute financial product advice, investment advice or any recommendation. Nothing
in this presentation constitutes legal, financial, tax or other advice.
1H20 RESULTS PRESENTATION
28You can also read