PRESENTATION OF FY2018 RESULTS - Arvida Group Limited Year Ended 31 March 2018 28 May 2018
←
→
Page content transcription
If your browser does not render page correctly, please read the page content below
PRESENTATION OF
  FY2018 RESULTS

          Arvida Group Limited
      Year Ended 31 March 2018

                    28 May 2018
FY18 RESULT HIGHLIGHTS

Financial   Accretive                                                                                                                                         Development
Performance Acquisitions                                                                                                                                      Activity
Reported NPAT at $58m;                                                         Three quality villages                                                         97 new units delivered;
43% increase in Underlying                                                     integrated into Group;                                                         expanded development
Profit1 to $33m                                                                immediately earnings                                                           programme and development
                                                                               accretive and performing well                                                  team

Financial                                                                      Strong Care                                                                    Positive
Position                                                                       Demand                                                                         Outlook
Assets now over $1.1b with                                                     Care facility occupancy                                                        Exceptional NPS result;
conservative capital structure;                                                remains very high at 96% well                                                  increased dividend declared
$77m rights issue successfully                                                 above industry average;                                                        plus special dividend
completed to fund                                                              70% of total revenue
acquisitions                                                                   underpinned by care fees

1. Underlying Profit is a non-GAAP (unaudited) financial measure and differs from NZ IFRS net profit after tax. A reconciliation to Reported Net Profit after Tax is provided on
page 19 and definition on page 28.

                                                                                                                                                                                   FY18 RESULTS PRESENTATION
                                                                                                                                                                                                           2
STRONG TRENDS CONTINUE

Reported NPAT (IFRS) ($m)                                                                                         Underlying Profit1 ($m)

                                                                                                                                                                                           33.0
                                                                                  57.6
                                                 53.7
                                                                                                                                                                    23.1

                                                                                                                                  15.8
               24.0

              FY16                              FY17                              FY18                                           FY16                              FY17                    FY18

Operating Cash Flow ($m)                                                                                          Total Assets ($m)

                                                                                                                                                                                           1,133
                                                                                   53.9

                                                 39.7                                                                                                              795

                24.1                                                                                                              461

               FY16                              FY17                             FY18                                          FY16                              FY17                    FY18

1. Underlying Profit is a non-GAAP (unaudited) financial measure and differs from NZ IFRS net profit after tax. A reconciliation to Reported Net Profit after Tax is provided on
page 19 and definition on page 28.
                                                                                                                                                                                   FY18 RESULTS PRESENTATION
                                                                                                                                                                                                           3
BUSINESS
OVERVIEW

           4
OUR STATED STRATEGY

Strategy Update

     1                                                                                                        3

     2

1.       Attitude of Living Well model emphasises resident autonomy, engagement and relationship-centred care. Comprises five wellness pillars
1
         – eating, thinking, resting, moving and engaging well – that encourage holistic practice and excellence in clinical care in an environment
         that supports living well

2
2.       Resident survey of both retirement village and care facilities measures our performance annually

3.
3        Incorporates the community aspects of the Attitude of Living Well model where we help the resident regain connection to the wider
         community:
            −    Continue to develop product that integrates with the community, allowing better connections and relationships
            −    Better positions the business for the next wave of customers; the Baby Boomers

                                                                                                                             FY18 RESULTS PRESENTATION
                                                                                                                                                      5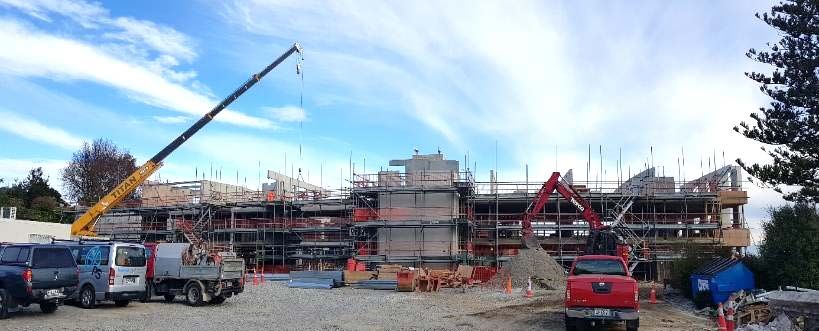
SNAPSHOT OF ARVIDA
Overview Village Locations
Listed on NZX in December 2014
Balance sheet growth of 250% since listing
Nearly 4,000 residents across 29 villages
High needs-based portfolio
1,850 retirement units; including villas, apartments,
serviced apartments and care suites
1,743 care beds; including rest home, dementia and
hospital-level care
Brownfield development in progress at 8 villages,
earthworks underway at first greenfield development
Development pipeline of 1,000+ units at 31 March 2018
Gross Returns (since IPO)
600
48
500
119
400 46
300 154
534
200 415 Existing Village
100 215 Existing Village with Development Activity
NZDm
- Future Village (greenfield site)
IPO Capital raised Vendor scrip Total capital Capital growth Current market Dividend return
from investors consideration invested capitalisation
FY18 RESULTS PRESENTATION
6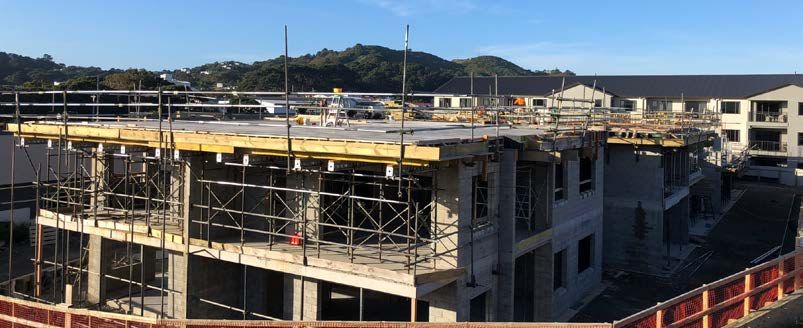
PORTFOLIO COMPOSITION AT 31 MARCH 2018
Portfolio Composition1 Aged Care Composition
FY17 DEV ACQ ADJ FY18
Rest Home 714 - 49 -20 743
Dementia 150 - 117 - 267
Hospital 582 - 140 +11 733 37%
42% 43%
Total Aged Care 1,446 - 306 -9 1,743
63%
Serviced Apts/Suites 588 4 97 -1 688
Villas/Apts 713 97 354 -2 1,162 15%
Total Retirement
1,301 101 451 -3 1,850
Units
Total Units/Beds 2,747 101 757 -12 3,593 Rest Home Dementia Hospital Serviced Apts Villas/Apts
Development 907 1,099
Commentary Needs-based Composition
4,692 units/beds
4 care suite conversions at Mary Doyle and Village at the
Park since acquired 3,593 units/beds
38%
97 new units developed over the period 32%
Other adjustments in accommodation mix reflect a
combination of swing beds and decommissioning for 68%
62%
development
Current Composition Post-development Composition
Needs-based ILUs
1. Figures include 100% of Village at the Park. The Group has a 50% interest in Village at the Park.
FY18 RESULTS PRESENTATION
7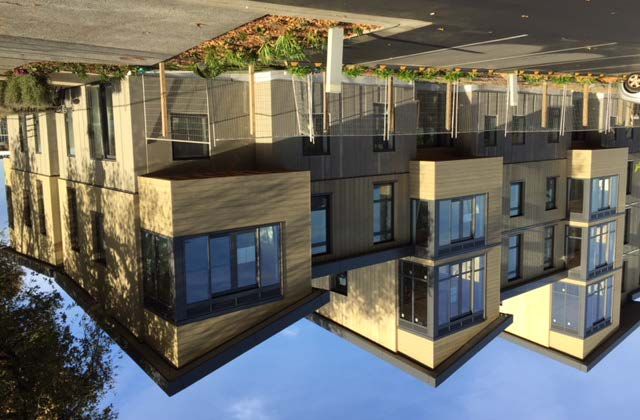
EXCELLENCE IN CARE
NUMBER OF CARE BEDS
Care facility occupancy in March 2018 higher at 96% with average for last 12 months at
95% across our 26 care facilities (1,743 beds) FY18 1,743
Continued excellent Ministry of Health audit results with 12 facilities now achieving the
gold standard of 4 years certification: FY17 1,446
− 83% of certification audits completed this year achieved extended 4 year period
− 13 facilities have 3 years certification and only one facility has 2 year CARE FACILITY OCCUPANCY
certification (to be audited later this year)
FY18 96%
− Clinical standard is substantially above national level, where nationally 21% of
aged care facilities^ hold 4 year certification relative to 46% of Arvida’s facilities FY17 95%
Exceptional resident survey exceeding last year’s inaugural result on higher
participation:
CARE BED NET PROMOTER SCORE
− Net Promoter Score of +53 in villages and +51 in care facilities, much higher than
FY18 +51
industry context
FY17 +42
-100 -50 0 50 100
^ HDANZ Aug 2017, designated audit agency for approximately 55% NZ aged care.
FY18 RESULTS PRESENTATION
8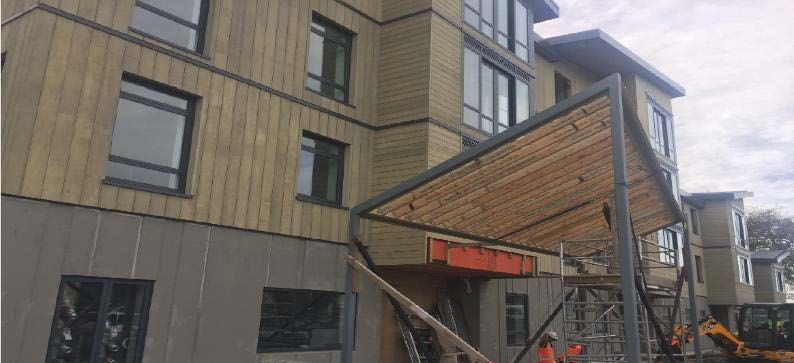
OPERATIONAL HIGHLIGHTS
Continue to invest in our people providing training and development opportunities:
− Introduced aged care specific educational videos – a first for aged care in NZ with over 10,000 courses completed
− Launched leadership programme for care teams across the Group to support the Attitude of Living Well
Developing additional services that reflect The Attitude of Living Well to support village residents to receive in-home care as part of the
Living Well model
SafePlus audit of seven villages found high level of Health & Safety practices in place:
− Achieved ACC Workplace Safety Management Practices level 3 across Group
− National Health & Safety Manager recently appointed
Rollout of resident management system across group progressing well – now in 23 villages
Integration of Strathallan and Mary Doyle completed – JV at Village at the Park operating well
Nutrition and healthy food options focus across Group by National Dietitian:
− Providing opportunities for resident engagement with foodservice and dining experiences that promote companionship
− Food control plan templated across Group and independently verified by external audit
FY18 RESULTS PRESENTATION
9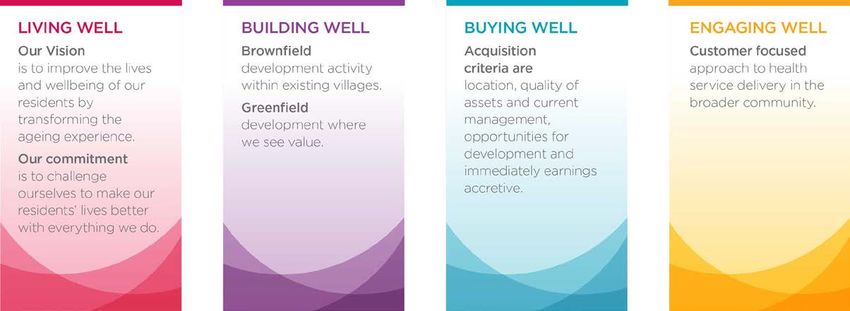
DEVELOPMENT
Artist impression of Richmond, Nelson

                                                      10
DEVELOPMENT ACTIVITY
FY18 New Unit Delivery Villas Apts S. Apts Total Commentary
Copper Crest 13 - - 13 In November 2017, guidance for FY18 was provided
that Arvida expected to:
Mary Doyle 5 - - 5
− Deliver a total of 95 new units
Lauriston Park 22 - - 22 − Settle 73 new sales (with 70 over 2H18)
Lansdowne Park 5 - - 5 For FY18, Arvida:
− Delivered 97 new units across 6 villages
Village at the Park - 28 - 28
− Settled sales of 79 new units during the year,
Oakwoods 24 - - 24 which included 73 of the new units delivered in
FY18
Total 69 28 - 97
Despite the delivery of new units being in the
second half of the year, the sales team achieved a
significant proportion of presales to enable the
settlement of 73 of the 97 new units developed
Sales Analysis FY18 FY17 YoY change FY16 within the year
Gross sale proceeds for the year were $41.7m, with
New Sales
average value per new sale up 20% to $528k
Villas 73 16 356% 10 Total development gains for the year were $6.5m,
Serviced apartments 2 16 (88%) 10 up from $2.4m in FY17. This included $1.9m of
gains on 31 new sales at the villages acquired
Care suites 4 - nm - during the year
Total new units sold 79 32 146% 20 Development margin improved to 19%, up from
17% in FY17
Value $m 41.7 14.0 197% 9.3
Note: The sales analysis includes sales from Village
Av. value per new sale $000 527.8 438.7 20% 465.0 the Park, which is 50% owned by Arvida. The
“Value $m” line includes 100% of the value and the
Development gain $m 6.5 2.4 180% 1.5
“Development gain $m” line includes 50% of gains
Development margin % 19% 17% 200bp 16%
FY18 RESULTS PRESENTATION
11EXPANDED DEVELOPMENT TEAM
Development processes are well established with new unit delivery occurring and a sizeable pipeline of over 1,000 new units identified to
develop, representing a 30% increase in the current portfolio
With the strong development pipeline within the Waikato and Bay of Plenty regions – a demographic 'Golden Triangle' for retirement
living and aged care – changes have been made to our construction delivery in the region:
− Arvida will now deliver head contractor functions in-house to complete multi-level construction in the region, enabling Arvida to
capture additional construction margin
− Builds on and strengthens Arvida’s in-house project management capability and provides a blueprint for expansion of in-house
construction functions across the country
− Development team expanded with a number of strategic hires in the region, including Senior Project Manager, Quantity
Surveyor, Site Manager, Quality Assurance Manager and National Health & Safety Manager
− Team has significant experience with multi-level construction and brings a depth of local knowledge and industry relationships
− Villa construction will continue to be through local house builders
An internal Construction Risk Committee has been established to provide governance over in-house construction projects:
− The Committee is tasked with reviewing construction progress, reviewing trade tendering and monitoring risks
− Appointed an independent adviser to the Committee that has over 40 years’ experience in the commercial construction industry
in NZ
Significant care and apartment developments in the planning phase in the region are: Copper Crest in Tauranga; Lauriston Park in
Cambridge; and Cascades in Hamilton
FY18 RESULTS PRESENTATION
12CURRENT DEVELOPMENT PROGRAMME
Planned delivery of 111 new units in FY19
Village Location Status Villas Apts FY20+
Aria Bay Auckland Under construction - 25 -
Copper Crest Tauranga Under construction 25 - 5 villas
Copper Crest Tauranga Construction to commence (consented) - - 79 Apts/Care
Lauriston Park Cambridge Construction to commence (consenting) - - 12 villas
Mary Doyle Havelock North Under construction 10 - 32 Villas
Village at the Park Wellington Under construction - - 24 Apts
St Albans Christchurch Under construction - - 45 Apts/Care
Park Lane Christchurch Under construction - 28 51 Apts
Rhodes on Cashmere Christchurch Under construction - 23 50 Apts/Care
Richmond Nelson Enabling works commenced - - 77 Villas/Apts
Total FY19 Delivery 35 76 375 units / beds
A further 613 units/beds are in the early stages of planning for construction on existing land:
− Includes 109 villas/apartments and 81 care suites planned at Richmond
Note, figures are gross units expected to be delivered (nil decommissions in current programme).
FY18 RESULTS PRESENTATION
13DEVELOPMENT ACTIVITY
Aria Bay Apartments, Auckland St Albans Apartments, Christchurch
Completion 1H19 Completion 2H20
Village at the Park Apartments, Wellington
Copper Crest – Stage 7 Villas, Tauranga
Completion 1H20 Completion 2H19-1H20
FY18 RESULTS PRESENTATION
14DEVELOPMENT ACTIVITY
Park Lane Care Apartments – Stage One, Christchurch
Completion 1H19
Rhodes on Cashmere Care Apartments – Stage One, Christchurch
Completion 2H19
FY18 RESULTS PRESENTATION
15FY18 FINANCIALS
REPORTED PROFIT (IFRS)
NZ$m FY18 FY17 YoY change FY16 Commentary
Care & village service fees 109.9 85.7 28% 72.4 NPAT of $57.6m up 7% on last year
Deferred management fees 18.1 12.3 48% 7.8 Higher revenue for the year from a
combination of new acquisitions,
Other revenue 4.3 3.4 24% 2.3 higher care bed rates and maturing
deferred management fee profile.
Total revenue 132.3 101.4 30% 82.5
Care fees totalled $93m.
Gain on acquisition of subsidiaries 0.0 3.2 (100%) 0.0 Changes in fair value predominantly
Changes in fair values 42.0 40.1 5% 16.0 driven by strong increase in the value
of retirement villages that delivered
Share of profit arising from JV (net of tax) 5.1 0.0 nm - new stock during the year and
Total income 179.4 144.7 24% 98.5 continuing increase in land values for
care facilities
Operating expenses (108.8) (80.9) 35% (65.1) The JV share of profit mainly arose
Depreciation (4.3) (3.4) 24% (2.9) from an increase in the value of the
retirement village
Total expenses (113.1) (84.3) 34% (68.0)
Operating expenses increased due to
Operating profit before financing, one-off new acquisitions, pay equity
66.3 60.4 10% 30.5
costs
settlement and higher corporate
Financing costs (2.2) (1.3) 70% (0.9) costs
Impairment of goodwill (1.2) 0.0 nm 0.0 Of the 21 cash generating units
(‘CGU’) with goodwill attached, two
One-off items (1.0) (1.0) 2% (1.4) CGU’s were unable to support the
Profit before income tax 61.9 58.1 7% 28.2 carrying value and were impaired
Income tax at a similar level to FY17
Income taxation (4.3) (4.4) (4%) (4.2)
due to higher tax shield from
Net profit after tax 57.6 53.7 7% 24.0 development activity
FY18 RESULTS PRESENTATION
17ORA RESALES
Sales Analysis FY18 FY17 YoY change FY16 Commentary
Resales Resale of 216 units, 30% up on FY17
Occupancy remains high, with around 40 units
Villas 72 47 53% 35
available for resale or 2% of total portfolio
Serviced Apartments 144 119 21% 114 Gross proceeds of $67.0m, with average value per
resale up 13% to $310k
Total resales 216 166 30% 149
Realised $13.3m of resale gains, and an
Value $m 67.0 45.5 47% 36.5 improvement in resale margins to 20%. This
includes $1.8m of gains from 26 resales at the
Av. value per resale $000 310.0 274.1 13% 244.9 village acquired during the year
Resale gains $m 13.3 8.9 49% 5.0 Note: The sales analysis includes sales from
Village the Park, which is 50% owned by Arvida.
Resale margin % 20% 19% 14% The “Value $m” line includes 100% of the value and
the “Resale gains $m” line includes 50% of gains
Resale Volumes and Margins Average Resale Prices ($000)
20% 500
150
144 400 454
15%
100 114 119 358
300 336
10%
200 241 238
72 223
50
5%
47 100
35
0 0% 0
FY16 FY17 FY18 FY16 FY17 FY18
ILUs SAs Margin ILUs SAs
FY18 RESULTS PRESENTATION
18UNDERLYING PROFIT RECONCILIATION
NZ$m (Unaudited) FY18 FY17 YoY change FY16 Commentary
Net profit after tax 57.6 53.7 7% 24.0 Underlying Profit increased 43% to
$33.0m
Less: Change in fair values (46.9) (40.0) 17% (16.0)
On a cents per share basis, the
Add: Deferred tax 0.3 0.5 (29%) (0.1) increase in Underlying Profit was 16%
1.2 - nm - The key drivers were:
Add: Impairment of goodwill
− The acquisition of new villages
Less: Gain on acquisition of subsidiaries 0.0 (3.2) (100%) 0.0 during the year strongly
Add: One-off costs 1.0 1.0 2% 1.4 contributed to the underlying
profit; and
Underlying operating profit 13.2 11.8 11% 9.3
− Total ORA of 295 sales (up 49% on
Add: Gains on resales 13.3 8.9 50% 5.0 FY17) and improved development
and resale margins drove increase
Add: Gain on sale of new units 6.5 2.4 167% 1.5 in total gains (up 75% on FY17)
Underlying profit1 33.0 23.1 43% 15.8
1. Underlying Profit is a non-GAAP (unaudited) financial measure and differs from NZ IFRS net profit after tax. A definition
is provided on page 28.
Movements in Underlying Profit $m Underlying Profit (cents per share)
5.6
5.8 16% 8.9
(1.5) 27% 7.7
33.0 6.1
23.1
FY17 Underlying Corporate & Interest Existing portfolio FY18 Acquisitions FY18 Underlying FY16 FY17 FY18
Profit Profit
FY18 RESULTS PRESENTATION
19BALANCE SHEET
NZ$m FY18 HY18 FY17 Commentary
Cash and cash equivalents 3.1 1.9 1.3 Total asset base now in excess of
$1.1b
Property, plant and equipment 225.4 189.9 156.5
All care facilities and retirement
Investment property 806.3 585.7 569.9 villages were revalued in FY18
Investment in JV 21.2 0.0 0.0 The value of Investment Property
increased $220.6m (vs HY18) as a
Goodwill 55.7 51.1 51.1 result of:
Other assets 21.0 18.1 16.7 − Settlement of acquired villages
− Fair value movements at existing
Total Assets 1,132.7 846.7 795.5
and completed villages
External debt 122.5 109.8 73.5 A valuation panel was used for the
first time. CBRE valued 22 sites and
Residents’ loans 415.2 294.6 290.9
Jones Lang LaSalle valued 7 sites
Deferred tax liability 30.6 21.4 20.8 A comparison of the valuation
Other liabilities 53.9 42.2 38.7 assumptions used are contained
within the appendix
Total Liabilities 622.2 468.0 423.9
$93m of new share capital was
Net Assets 510.5 378.7 371.6 issued during the year to fund the
acquisition of three villages
FY18 RESULTS PRESENTATION
20EMBEDDED VALUE
Embedded Value ($000 per unit) Commentary
Total embedded value (EV) in the portfolio was up
$69 million or 45% since 31 March 2017 to $222 million:
$130k − $47 million relates to acquired villages (measured at 31
$117k March 2018)
62
63 EV per unit increased to $130,000; up from $117,000 per unit
at the beginning of FY2018. Includes:
$62k $67k
− $68,000 of DMF cash flows per unit to be realised
24 68
20 − $62,000 of resale gains per unit
54
42 43 On a per share basis, EV represents 54.1 cents per share:
− 18% increase on the comparative period
FY15 FY16 FY17 FY18 EV is an indicator of the potential future cash flows from
DMF Resales Gains realised resale gains and deferred management fee
receivables
Embedded Value Composition Calculation is based on independent valuation reports:
− Resale Gain EV is calculated by the current unit price less
Average EV per unit ($000) Villas SAs Total the ingoing unit price less any capital gain sharing
Resale Gains 84 33 62 − DMF EV is calculated by the contractual amount owed at
valuation date
DMF 78 54 68
Unit titled or company-owned units previously excluded from
Total EV 162 87 130 calculation of EV have been included in FY18
FY18 RESULTS PRESENTATION
21CAPITAL STRUCTURE
Bank Debt Facilities NZ$m FY18 FY17 YoY change
NZ$m Drawn Investment Property 807 570 42%
General facility 122.5 Less: ORA / DMF (436) (306) 42%
Cash (3.1) Retirement Villages 371 264 41%
Total Net Debt 119.4 Add: Care Facilities 201 178 13%
Gearing (ND / ND + E) 19% Independent Valuation 572 443 29%
Add: Investment in JV 21 0 nm
Financial Covenants
Add: Work in Progress 56 20 180%
Interest Cover 2.25x
Implied Value 649 463 40%
Loan to Value 50%
Less: Net Debt (119) (72) 67%
Commentary 530 391 34%
Net Implied Value
Total net debt of $119m includes development Net Implied Value per Share $1.28 $1.17 9%
project work in progress of $56m and
development land of $34m
All bank debt facility financial covenants met
The debt facility of $150m is split evenly between
two tranches with expiry dates of June 2020 and
June 2022
Arvida is currently in the process of negotiating
an extension to the bank debt facility limit and
tenure
FY18 RESULTS PRESENTATION
22CASH FLOWS
NZ$m FY18 FY17 YoY change FY16 Commentary
Receipts from residents for care fees and Operating cash flow improved
113.1 90.3 25% 70.8
village services
36%, mainly due to the increase in
Residents’ loans 91.3 62.4 46% 41.3 ORA transactions during the year.
Repayment of residents’ loans (37.7) (26.0) 45% (20.4) Cash flows of $91m were received
from new resident loans (split
Payments to suppliers and employees (106.3) (76.8) 39% (63.7) $63m from resales and $28m from
Other operating cash flows (0.0) (3.3) (100%) new sales). Repayments of
(0.2)
resident loans totalled $38m
Financing costs (1.9) (1.1) 75% (0.9)
Investing cash flow was spent on
Taxation (4.6) (5.8) (21%) (2.8) the acquisition of three new
villages and the continuation of the
Net cash flow from operating activities 53.9 39.7 36% 24.1
development program. During the
Bank overdraft acquired from subsidiaries 3.0 (0.2) nm 0.1 year $65m was spent on
development projects; $6m on
Purchase of investment property (12.1) (19.2) (37%) (11.4)
retirement village upgrades, $5m
Purchase of property, plant and equipment (66.2) (23.3) 184% (3.3) on unit title and adjoining land
purchases, $2m on care facility
Payments for investments in subsidiaries (43.8) (66.5) (34%) (29.3)
upgrades (including the
Net advances to joint venture (11.9) 0.0 nm 0.0 completion of the refurbishment at
St Allisa)
Net insurance claim proceeds 0.0 0.9 (100%) 17.8
Financing cash flow comprised
Capitalised interest paid (1.9) (0.3) 620% 0.1 $77m raised in the rights issue, an
Net cash flow from investing activities (132.9) (108.6) 22% (26.0) increase in debt and $17m of
dividends paid to shareholders
Net cash flow from financing activities 80.9 68.3 18% 1.8
Closing cash balance 3.1 1.3 1.8
FY18 RESULTS PRESENTATION
23FY18 FINAL DIVIDEND AND OUTLOOK
Commentary Dividend (cents per share)
4Q dividend of 1.56 cps declared. Dividend comprises regular
ordinary dividend of 1.30 cps and special dividend of 0.26 cps
5.01
Brings total dividend for FY18 to 5.01 cps, 13% up on FY17
4.45
Full year dividend payout ratio at 60% consistent with lower 4.12 4.25
end of policy band
Record date for payment is 13 June 2018, payment on 21 June
2018:
− Ordinary dividend partially imputed with 0.25 cps of
imputation credits
− Supplementary dividend of 0.13 cps for non-resident
shareholders
Lift in regular dividend paid for 4Q sustainable for FY19 with
momentum in revenue and earnings continuing whilst retaining FY15 FY16 FY17 FY18 FY19e
1
balance sheet capacity to fund current development pipeline 1Q 2Q 3Q 4Q Special
Labour cost pressures to remain:
− Pay equity funding deficit likely to persist with our caregivers
having a level of qualification higher than the industry
average. We are active with industry bodies to ensure
Ministry of Health/DHB funding levels fairly contribute to the
increased wage cost
− Flow on affect to broader workforce in conjunction with
tightening labour market from immigration policy
Continue to monitor property sector outlook with house price
growth slowing and construction market remaining tight:
− Retain timing flexibility on development programme to
achieve hurdles
1. Annualised. Arvida paid a dividend of 1.03 cps in respect of the FY15
24APPENDIX
25PORTFOLIO AT 31 MARCH 2018
Village Region Villas Apts SA CS RH Hospital Dementia FY19 FY20+ Planning^
1 Aria Bay Retirement Village Auckland - 9 24 - 57 - - 25 - 115 (51)
2 Aria Gardens Auckland - - - - 42 91 20 - - -
3 Aria Park Retirement Village Auckland - - 46 - 40 44 - - - -
4 Cascades Retirement Village Hamilton - 5 32 - 45 32 - - - 120
5 Lauriston Park Retirement Village Cambridge 171 - - - - - - - 12 90
6 Views Lifecare Tauranga - - - - 30 38 20 - - -
7 Copper Crest Retirement Village Tauranga 130 - - - - - - 25 84 -
8 Glenbrae Village Bay of Plenty 78 - 26 - 17 21 - - - 22
9 Mary Doyle Lifecare Havelock North 144 48 40 5 26 60 64 10 32 -
10 Olive Tree Village and Olive Tree Apartments Palmerston North 95 - 48 - 28 - 17 - - -
11 Molly Ryan Retirement Village New Plymouth 35 - 28 - 20 13 - - - -
12 Waikanae Country Lodge Village Kapiti Coast 4 - 20 - 21 36 - - - -
13 Lansdowne Park Lifestyle Village Masterton 69 - 29 - 29 21 - - - -
14 Village at the Park Lifecare # Wellington 38 107 - 9 42 33 - 24 16
15 Ashwood Park Retirement Village Blenheim 18 - 35 - 47 48 26 - - -
16 The Wood Retirement Village Nelson 5 - 38 - 30 46 - - - -
17 Oakwoods Retirement Village Nelson 116 - 45 - 26 22 - - - -
18 Richmond Site Tasman - - - - - - - - 77 190
19 Bainlea House Waimakariri - - - - - - 27 - - -
20 Bainswood on Victoria Waimakariri - - - - 26 32 - - - -
21 Bainswood Retirement Village Waimakariri 4 - 14 - 26 - - - - -
22 Wendover Retirement Village ^ Christchurch - - 11 - 43 - - - - 60
23 St Albans Retirement Village ^ Christchurch - - 53 - - 18 - - 45 -
24 Ilam Lifecare Christchurch - - 45 - 22 34 20 - - -
25 Mayfair Retirement Village Christchurch 11 - 23 - 28 36 - - - -
26 Maples Retirement Village Christchurch - - 25 - 49 3 - - - -
27 St Allisa Rest Home Christchurch - - - - 55 34 20 - - -
28 Park Lane Retirement Village Christchurch 8 - 45 - 26 16 - 28 51 -
29 Rhodes on Cashmere Christchurch - 16 - - - - - 23 50 -
30 Strathallan Lifecare Timaru 51 - 47 - 10 46 20 - - -
TOTALS 977 185 674 14 743 733 267 111 375 613
^ Gross units expected to be delivered (expected decommissions shown in brackets). Subject to final investment decision approval.
# Portfolio metrics presented as if a 100% interest held. Arvida has a 50% interest in Village at the Park.
FY18 RESULTS PRESENTATION
26FY18 PORTFOLIO VALUATION ASSUMPTIONS
Discount Rates (retirement village) CBRE JLL FY17 Independent Living Units CBRE JLL FY17
High 16.5% 15.5% 16.0% Av. Ingoing Age 77 yrs 78 yrs 76 yrs
Low 13.5% 12.3% 12.5% Av. Current Age 82 yrs 83 yrs 80 yrs
Av. Current Price $488k $445k $411k
Long Term Property Price Growth CBRE JLL FY17
High 3.5% 3.5% 3.5% Serviced Apt CBRE JLL FY17
Low 2.0% 2.5% 2.0% Av. Ingoing Age 84 yrs 84 yrs 84 yrs
Av. Current Age 87 yrs 87 yrs 87 yrs
Short Term Property Price Growth CBRE JLL FY17
Av. Current Price $245k $311k $245k
High 2.0% 3.0% 2.5%
Low 0.0% 1.5% 0.0%
Tenure – ILUs (yrs) CBRE JLL FY17
High 9.0 8.0 9.0
Low 6.3 6.8 6.2
Tenure – Serviced Apt (yrs) CBRE JLL FY17
High 4.8 5.0 4.9
Low 4.0 4.0 4.0
EBITDA per Bed $000 CBRE JLL FY17
High 23.0 21.5 20.8
Low 9.4 14.6 10.4
FY18 RESULTS PRESENTATION
27DEFINITIONS
Underlying Profit (or Underlying NPAT)
Underlying Profit is a non-GAAP unaudited financial measure used by Arvida to monitor financial performance and determine dividend distributions.
Arvida calculates Underlying Profit by making the following adjustments to Reported Net Profit after Tax:
Removing the change in fair value of investment properties, property, plant and equipment and derivatives (from the Statement of Comprehensive
Income);
Removing any impairment of goodwill;
Removing any loss on disposal of chattels from the decommissioning of development sites;
Removing any gains on acquisition of subsidiaries;
Adding back the Directors’ estimate of realised gains on occupation right agreement units;
Adding back the Directors’ estimate of realised development margin on the cash settlement of the first sale of new ORA units following the development
or conversion to an ORA unit;
Adding back the deferred taxation component of taxation expense so that only current tax expense is reflected; and
Adding back transaction costs.
Resale Gain
The Directors’ estimate of realised gains on resales of ORA is calculated as the net cash flow received by Arvida on the settlement of the resale of pre-existing
ORAs (i.e. the difference between the ORA licence payment received from the incoming resident and the ORA licence payment previously received from the
outgoing resident).
Development Margin
The Directors’ estimate of realised development margin is calculated as the cash received on settlement of the first sale of new ORA units less the development
costs associated with developing the ORA units.
Development costs include:
Construction costs directly attributable to the relevant project, including any required infrastructure (e.g. roading) and amenities related to the units (e.g.
landscaping) as well as any demolition and site preparation costs associated with the project. The costs are apportioned between the ORA units, in
aggregate, using estimates provided by the project quantity surveyor. The construction costs for the individual ORA units sold are determined on a pro-
rated basis using gross floor areas of the ORA units;
An apportionment of land valued based on the gross floor area of the ORA units and care suites developed. The value for brownfield development land is
the acquisition cost or the estimated fair value of land at the time a change of use occurred (from operating as a care facility or retirement village to a
development site), as assessed by an external independent valuer. Greenfield development land is valued at historical cost; and
Capitalised interest costs to the date of project completion apportioned using the gross floor area of ORA units developed.
Development costs do not include:
Construction, land (apportioned on a gross floor area basis) and interest costs associated with common areas and amenities or any operational or
administrative areas.
FY18 RESULTS PRESENTATION
28IMPORTANT NOTICE
Disclaimer
The information in this presentation has been prepared by Arvida Group Limited with due care and attention. However, neither the Company nor any of its
directors, employees, shareholders nor any other person shall have any liability whatsoever to any person for any loss (including, without limitation, arising from
any fault or negligence) arising from this presentation or any information supplied in connection with it.
This presentation may contain projections or forward-looking statements regarding a variety of items. Such projections or forward-looking statements are
based on current expectations, estimates and assumptions and are subject to a number of risks, uncertainties and assumptions. There is no assurance that
results contemplated in any projections and forward-looking statements in this presentation will be realised. Actual results may differ materially from those
projected in this presentation. No person is under any obligation to update this presentation at any time after its release to you or to provide you with further
information about Arvida Group Limited.
A number of non-GAAP financial measures are used in this presentation. You should not consider any of these in isolation from, or as a substitute for, the
information provided in the audited consolidated financial statements for the year ended 31 March 2018, which will be made available at www.arvida.co.nz.
Forward-looking statements are subject to any material adverse events, significant one-off expenses or other unforeseeable circumstances.
The information in this presentation is of a general nature and does not constitute financial product advice, investment advice or any recommendation. Nothing
in this presentation constitutes legal, financial, tax or other advice.
FY18 RESULTS PRESENTATION
29You can also read